. 2020 May;8(9):e14417.
doi: 10.14814/phy2.14417.

Metabolic changes during pregnancy in glucose-intolerant NZO mice: A polygenic model with prediabetic metabolism

Affiliations

Metabolic changes during pregnancy in glucose-intolerant NZO mice: A polygenic model with prediabetic metabolism

Katharina Grupe et al. Physiol Rep. 2020 May.

Abstract

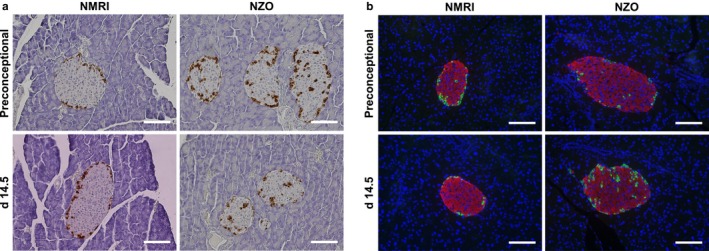
Gestational diabetes mellitus (GDM) is a complex metabolic disease involving genetic and environmental factors. Recent studies have underlined its heterogeneity, so it is reasonable to divide patients into subpopulations depending on whether an insulin secretion or sensitivity defect is predominant. Since testing for GDM is usually performed in the second trimester, misinterpretation of prediabetes as gestational diabetes may occur. As with type 2 diabetes (T2DM), rodent models are needed for both GDM and prediabetes, but few do exist. Here, we compared the metabolic changes in pregnant normal NMRI mice with those in New Zealand obese (NZO) mice. Male animals of this strain are an established model of T2DM, whereas female mice of this strain are protected from hyperglycemia and β-cell death. We demonstrate that female NZO mice exhibited impaired glucose tolerance, preconceptional hyperinsulinemia, and hyperglucagonemia without any signs of manifest diabetes. The NZO model showed, compared with the NMRI control strain, a reduced proliferative response of the Langerhans islets during pregnancy (3.7 ± 0.4 vs. 7.2 ± 0.8% Ki-67-positive nuclei, p = .004). However, oral glucose tolerance tests revealed improved stimulation of insulin secretion in both strains. But this adaption was not sufficient to prevent impaired glucose tolerance in NZO mice compared with the NMRI control (p = .0002). Interestingly, glucose-stimulated insulin secretion was blunted in isolated primary NZO islets in perifusion experiments. In summary, the NZO mouse reflects important characteristics of human GDM and prediabetes in pregnancy and serves as a model for subpopulations with early alterations in glucose metabolism and primary insulin secretion defect.

Keywords: impaired glucose tolerance; polygenic mouse model; prediabetes; pregnancy.


Conflict of interest statement

All authors declare no conflicts of interest relevant to this work.

Figures

FIGURE 1
FIGURE 1
Impaired glucose tolerance and preconceptional hyperinsulinemia in female NZO mice. Blood glucose and plasma insulin concentrations during oral glucose tolerance tests of NZO mice (black circles) and NMRI control mice (white squares). (a, e) Preconceptional, (b, f) day 14.5 of gestation, and (c, g) postpartum. (d) Area under the curve (AUC) for blood glucose calculated using the trapezoidal rule of NZO mice (black bars) and NMRI control mice (white bars). (h) AUC for insulin secreted during OGTT of NZO and NMRI control mice. Squared parts of the bars indicate first phase (0–30 min) of insulin secretion. Data are presented as means ± SEM (n = 7–11 animals per group). ***p < .001, ****p < .0001, NMRI postpartum vs. day 14.5: §p = .0183
FIGURE 2
FIGURE 2
Detailed bar chart of Figure 1e–g highlighting the improved stimulation of insulin secretion in NZO mice during pregnancy. Insulin secretion during the first 30 min of OGTT at time points (a, d) preconceptional, (b, e) day 14.5 of gestation, and (c, f) postpartum of NMRI (upper graphs) and NZO mice (lower graphs). Data are presented as means ± SEM (n = 7–11 animals per group). *p < .05, **p < .01, ***p < .001
FIGURE 3
FIGURE 3
Insulin secretion defect of freshly isolated NZO islets. (a) Insulin secretion at time points preconceptional and day 14.5 of gestation of NZO mice (preconceptional: black line, black circles; d 14.5: grey line, black circles) and NMRI control mice (preconceptional: black line, white squares; d 14.5: grey line, white squares). Islets were perifused from 0 min to 60 min with medium containing 5 mM glucose. Then glucose concentration was raised to 20 mM for 40 min of perifusion, followed by a wash out period of 20 min at 5 mM glucose. (b) Area under the curve (AUC) was calculated using the trapezoidal rule (NZO: black bars; NMRI: white bars). Data are presented as means ± SEM (n = 4–5 animals per group). *p < .05, **p < .01
FIGURE 4
FIGURE 4
Insulin resistance without manifest diabetes in female NZO mice. (a) Body weights of NZO and NMRI control mice at time points preconceptional (white bars) and day 14.5 of gestation (black bars). (b) Number of pups of NZO (black bars) and NMRI control mice (white bars). (c) Random and (d) postabsorptive (6 hr food deprivation) blood glucose of NZO and NMRI control mice at time points preconceptional (white bars) and day 14.5 of gestation (black bars). (e) Random and (f) postabsorptive plasma insulin concentrations of both strains. (g) Calculation of insulin resistance by the homeostasis model assessment method (HOMA‐IR) and (h) Matsuda index of insulin sensitivity (ISI) of NZO and NMRI control mice. Data are presented as means ± SEM (a and b n = 10, c and e n = 5–7, d, f, g, and h n = 7–11 animals per group). *p < .05, **p < .01, ***p < .001, ****p < .0001
FIGURE 5
FIGURE 5
Different adaptation of Langerhans islets in NZO and NMRI mice during gestation. (a) Mean percentage of islet cells positive for Ki‐67 and (b) islet size of NZO and NMRI control mice at both time points, preconceptional (white bars), and on day 14.5 of gestation (black bars). (c) Total pancreatic insulin and (d) glucagon contents were determined in acid‐ethanol extracts. (e) Mean percentage of islet cells positive for glucagon and (f) somatostatin. Data are presented as means ± SEM (n = 4–7 animals per group). *p < .05, **p < .01, ***p < .001, ****p < .0001
FIGURE 6
FIGURE 6
Different α‐cell distribution in female NZO mice. (a) Representative images showing glucagon‐positive islet cells (brown) of NZO and NMRI control mice at time points preconceptional and on day 14.5 of gestation. (b) Representative images of a double immunofluorescence staining for insulin (red) and glucagon (green) at time points preconceptional and on day 14.5 of gestation. Nuclei were stained with DAPI (blue). Scale bars: 100 µm
FIGURE 7
FIGURE 7
Preconceptional hyperglucagonemia in female NZO mice. (a) Random and (b) postabsorptive (6 hr food deprivation) plasma glucagon concentrations of NZO and NMRI control mice at both time points, preconceptional (white bars) and on day 14.5 of gestation (black bars). Data are presented as means ± SEM (n = 5–7 animals per group)

Similar articles

Cited by

References

    1. Ahlqvist, E. , Storm, P. , Käräjämäki, A. , Martinell, M. , Dorkhan, M. , Carlsson, A. , … Groop, L. (2018). Novel subgroups of adult‐onset diabetes and their association with outcomes: A data‐driven cluster analysis of six variables. The Lancet Diabetes and Endocrinology., 6(5), 361–369. 10.1016/S2213-8587(18)30051-2 - DOI - PubMed
    1. American Diabetes Association (2013). Diagnosis and Classification of Diabetes Mellitus. Diabetes Care, 36(Suppl. 1), S67–S74. - PMC - PubMed
    1. American Diabetes Association . (2019). Classification and diagnosis of diabetes: Standards of medical care in diabetes—2019. Diabetes Care, 42(Supplement 1), S13–S28. - PubMed
    1. Andrikopoulos, S. , Blair, A. R. , Deluca, N. , Fam, B. C. , & Proietto, J. (2008). Evaluating the glucose tolerance test in mice. American Journal of Physiology‐Endocrinology and Metabolism, 295(6), E1323–E1332. 10.1152/ajpendo.90617.2008 - DOI - PubMed
    1. Bozkurt, L. , Göbl, C. S. , Pfligl, L. , Leitner, K. , Bancher‐Todesca, D. , Luger, A. , … Kautzky‐Willer, A. (2015). Pathophysiological characteristics and effects of obesity in women with early and late manifestation of gestational diabetes diagnosed by the international association of diabetes and pregnancy study groups criteria. The Journal of Clinical Endocrinology and Metabolism, 100(3), 1113–1120. 10.1210/jc.2014-4055 - DOI - PMC - PubMed

Publication types

MeSH terms