. 2020 Jun 1;123(6):2297-2310.
doi: 10.1152/jn.00105.2020. Epub 2020 May 6.

Molecular characterization of frog vocal neurons using constellation pharmacology

Affiliations

Molecular characterization of frog vocal neurons using constellation pharmacology

Ryota T Inagaki et al. J Neurophysiol. .

Abstract

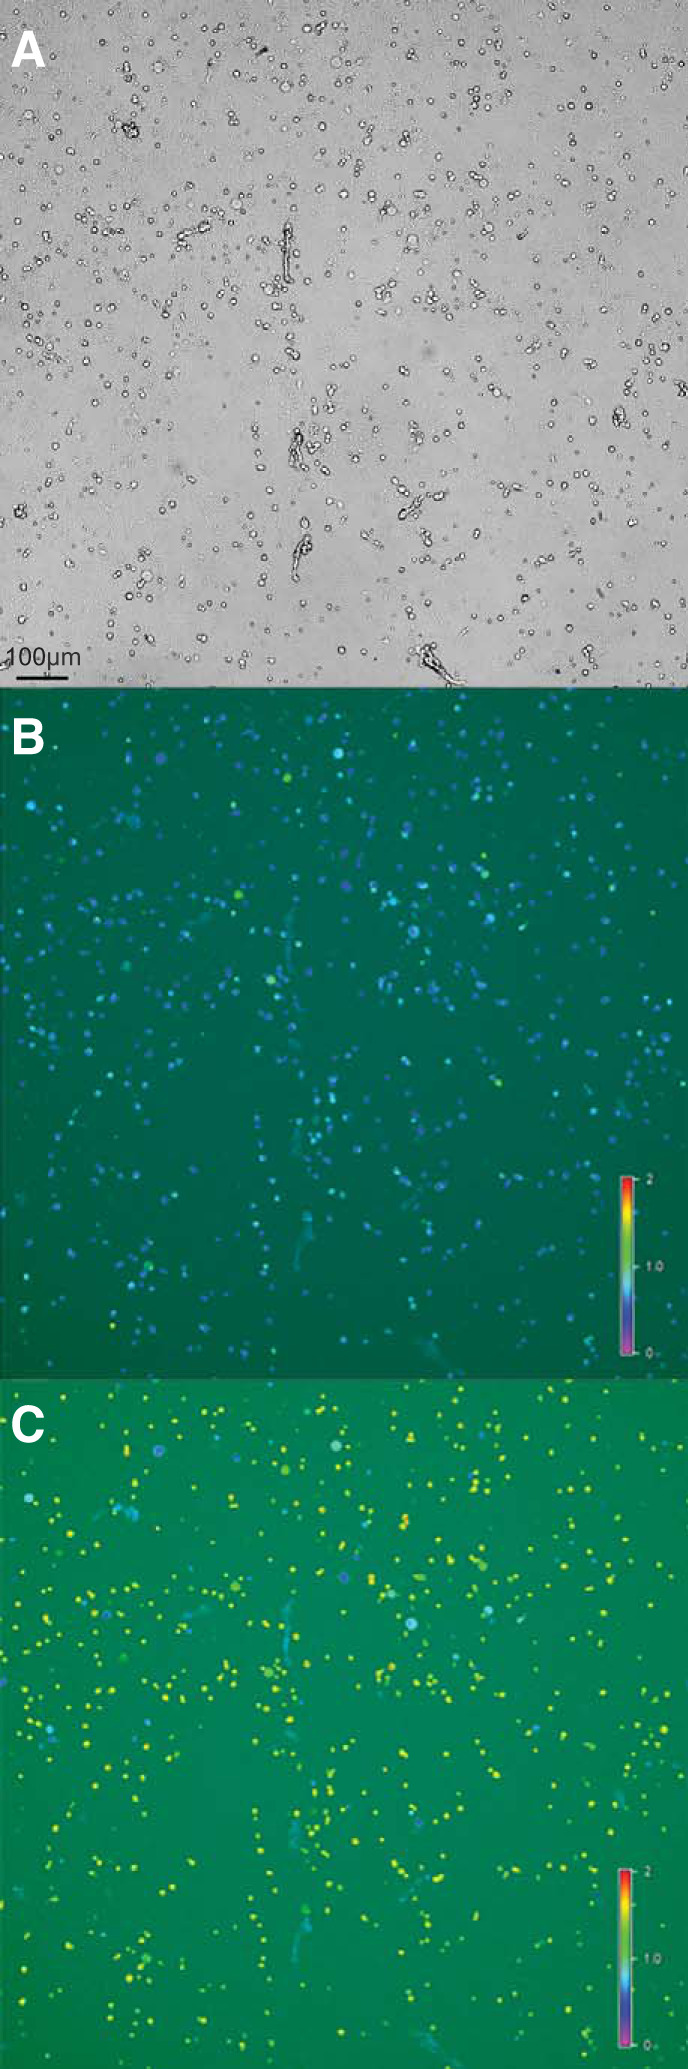
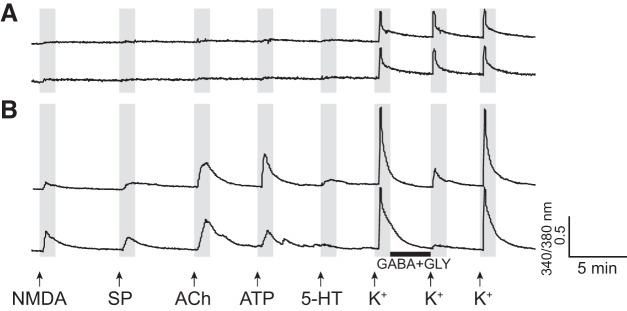
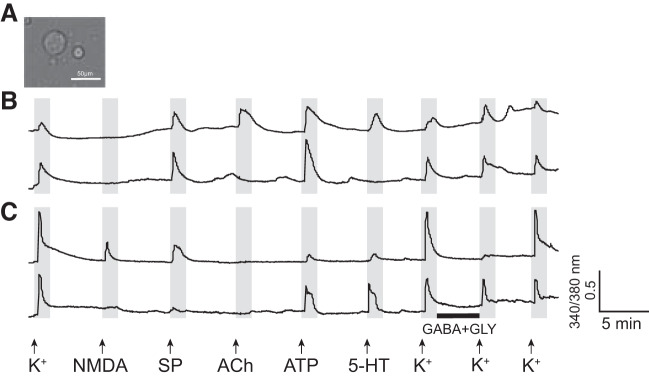
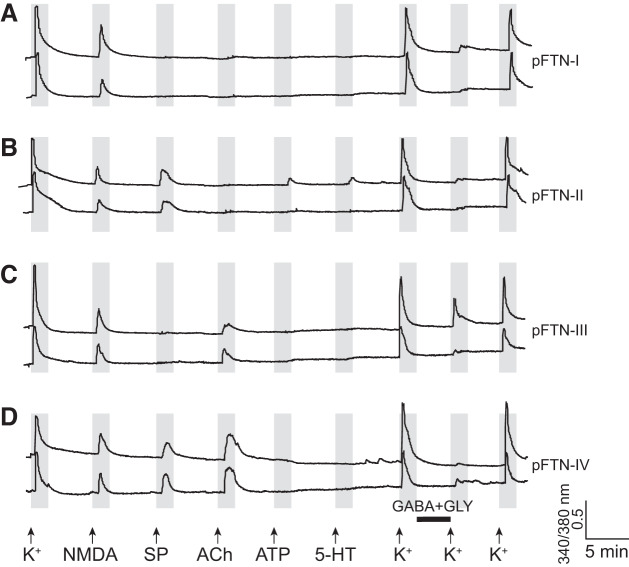
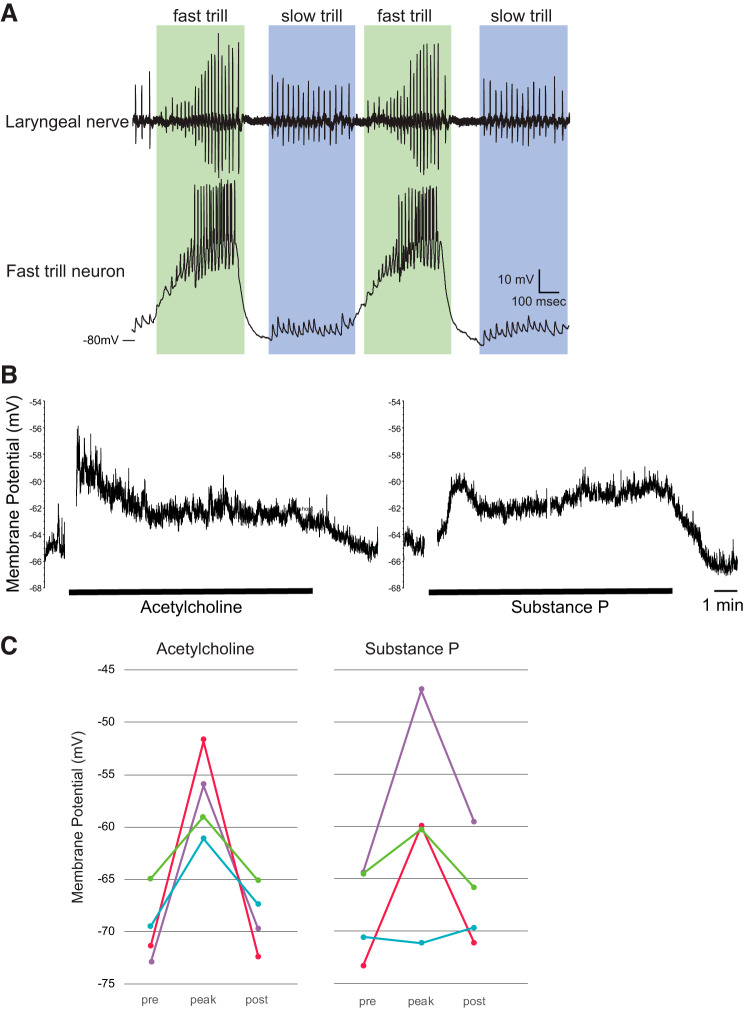
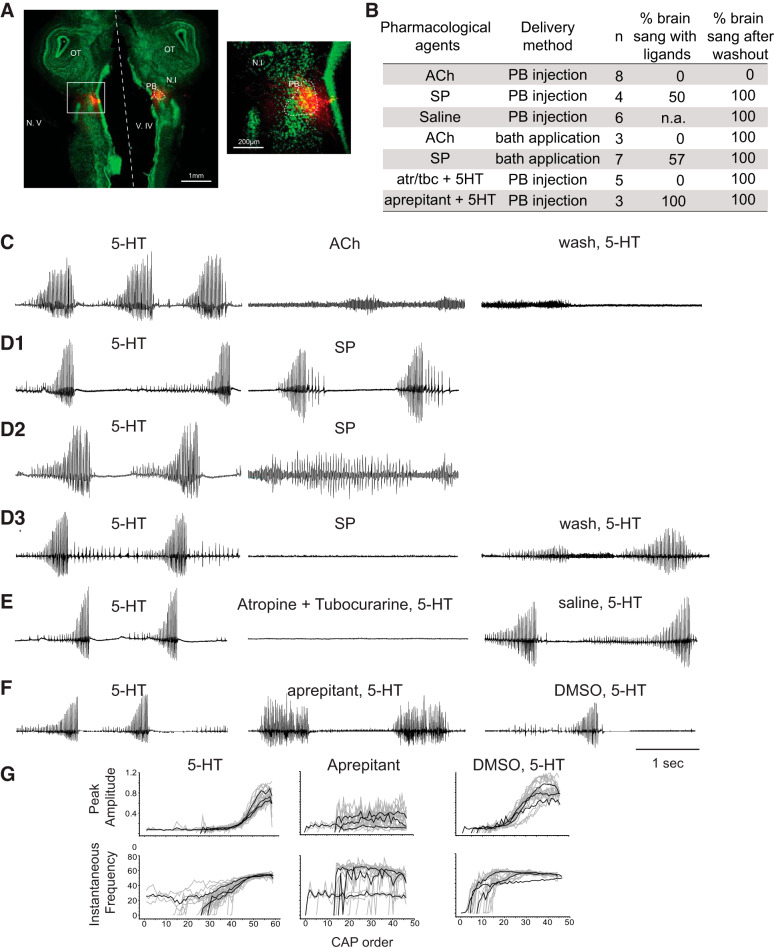
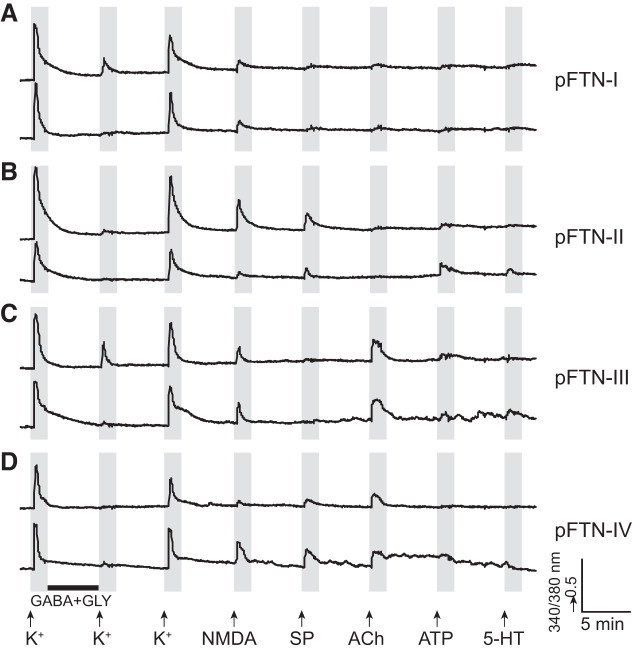
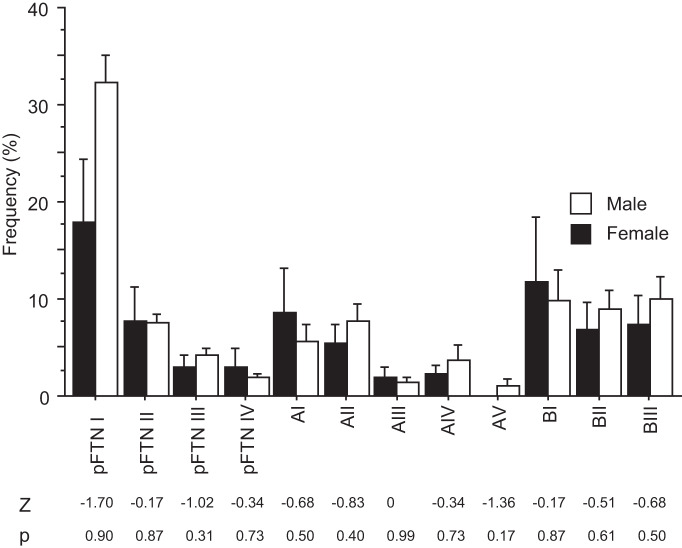
Identification and characterization of neuronal cell classes in motor circuits are essential for understanding the neural basis of behavior. It is a challenging task, especially in a non-genetic-model organism, to identify cell-specific expression of functional macromolecules. Here, we performed constellation pharmacology, calcium imaging of dissociated neurons to pharmacologically identify functional receptors expressed by vocal neurons in adult male and female African clawed frogs, Xenopus laevis. Previously we identified a population of vocal neurons called fast trill neurons (FTNs) in the amphibian parabrachial nucleus (PB) that express N-methyl-d-aspartate (NMDA) receptors and GABA and/or glycine receptors. Using constellation pharmacology, we identified four cell classes of putative fast trill neurons (pFTNs, responsive to both NMDA and GABA/glycine applications). We discovered that some pFTNs responded to the application of substance P (SP), acetylcholine (ACh), or both. Electrophysiological recordings obtained from FTNs using an ex vivo preparation verified that SP and/or ACh depolarize FTNs. Bilateral injection of ACh, SP, or their antagonists into PBs showed that ACh receptors are not sufficient but necessary for vocal production, and SP receptors play a role in shaping the morphology of vocalizations. Additionally, we discovered that the PB of adult female X. laevis also contains all the subclasses of neurons at a similar frequency as in males, despite their sexually distinct vocalizations. These results reveal novel neuromodulators that regulate X. laevis vocal production and demonstrate the power of constellation pharmacology in identifying the neuronal subtypes marked by functional expression of cell-specific receptors in non-genetic-model organisms.NEW & NOTEWORTHY Molecular profiles of neurons are critical for understanding the neuronal functions, but their identification is challenging especially in non-genetic-model organisms. Here, we characterized the functional expression of membrane macromolecules in vocal neurons of African clawed frogs, Xenopus laevis, using a technique called constellation pharmacology. We discovered that receptors for acetylcholine and/or substance P are expressed by some classes of vocal neurons, and their activation plays a role in the production of normal vocalizations.

Keywords: constellation pharmacology; motor programs; parabrachial nucleus; premotor neurons; vocalizations.


Conflict of interest statement

No conflicts of interest, financial or otherwise, are declared by the authors.

Figures

Fig. 1.
Fig. 1.
Images of dissociated cells obtained from parabrachial nucleus (PB) of male Xenopus laevis. A: bright-field image of dissociated cells from PB. B: pseudocolored ratiometric calcium image acquired at resting condition. Note that many cells are blue in color indicating low cytoplasmic [Ca2+]. C: pseudocolored ratiometric calcium image during application of 30 mM KCl. Note that many cells are in green to yellow color, indicating higher cytoplasmic [Ca2+].
Fig. 2.
Fig. 2.
Example calcium imaging traces from two parabrachial neurons. The x-axis and y-axis indicate time and a relative measurement of cytoplasmic [Ca2+], respectively. Arrows indicate the time at which pharmacological agents were applied, and the black horizontal bar indicates the time during which cells were incubated with GABA and glycine (Gly). A: two traces that exemplify neurons that show consistent response to a high concentration of [K+]o but do not respond to any other ligands applied. These neurons belong to class B-III (Table 2). B: two traces that exemplify neurons that respond to the application of N-methyl-d-aspartate (NMDA), substance P (SP), ACh, ATP, and GABA with glycine, but not to the application of 5-HT. The neurons belong to pFTN-IV (Table 2). In A, the peak [Ca2+]i transient amplitude in response to the second [K+]o (preceded by incubation with GABA and glycine) is the same as those in response to the first and third [K+]o, whereas, in B, the second application of [K+]o elicits reduced responses compared with the first and third [K+]o applications. These response profiles are taken as evidence for the lack (A) or presence (B) of the functional expression of the receptors for GABA and/or glycine, respectively.
Fig. 3.
Fig. 3.
Characteristics of class A and class B neurons. A: a photomicrograph of representative class A (left, larger) and B (right, smaller) neurons. B: two example calcium imaging traces of class A neurons. The x- and y-axes indicate the time and a relative measurement of cytoplasmic [Ca2+], respectively. Arrows indicate the time at which pharmacological agents were applied, and the black horizontal bar indicates the time during which cells were incubated with GABA and glycine (Gly). Note that the peak amplitude of [Ca2+] transients in response to a high concentration of [K+]o is smaller compared with the peak amplitude in response to ATP, and this is one of the criteria we used to define class A neurons. The top and bottom traces are examples of class A-I and class A-II, respectively (Table 2). Many class A neurons show intrinsic [Ca2+] oscillation in the absence of any ligands, as evidenced in these traces, for reasons that are not clear. C: two example calcium imaging traces of class B neurons. The top and bottom traces are examples of pFTN-II and B-III neurons, respectively. Note that the peak amplitude of [Ca2+] transients in response to a repeated application of a high concentration of K+ is consistently higher than those in response to other ligands.
Fig. 4.
Fig. 4.
Example calcium imaging traces of putative fast trill neurons (pFTN) I through IV. The x- and y-axes indicate the time and a relative measurement of cytoplasmic [Ca2+], respectively. Arrows indicate the time at which pharmacological agents were applied, and the black horizontal bar indicates the time during which cells were incubated with GABA and glycine (Gly). A: two example calcium imaging traces from pFTN-I. These neurons respond to N-methyl-d-aspartate (NMDA) and GABA with glycine application, but not to ACh or substance P (SP). B: two example calcium imaging traces of pFTN-II. These neurons respond to NMDA, GABA with glycine, and SP. C: two example calcium imaging traces of pFTN-III. These neurons respond to NMDA, GABA with glycine, and ACh application. D: two example of calcium imaging traces of pFTN-IV. These neurons respond to NMDA, GABA with glycine, SP, and ACh application.
Fig. 5.
Fig. 5.
Responses of fast trill neurons (FTNs) to acetylcholine (ACh) and substance P (SP). A, top trace: recordings obtained from the laryngeal nerve of isolated brain preparation. Bottom trace: membrane potential recorded from the FTN during fictive vocal production. Green frame shows fast trill and blue frame shows slow trills, two distinct phases of the advertisement calls of male Xenopus laevis. The long-lasting depolarization of the membrane potential and the repetitive firing during the fast trill is a signature membrane potential activity of the FTNs. B: example trace of the membrane potential of the neuron (green plot in C) in response to the 10-min bath application of ACh (left) and SP (right). The parts of the traces with artifact associated with the ligand application and other random noises are removed. C: the membrane potentials (average of 30 s) of four FTNs before (pre), peak during (peak), and after (post) the application of ACh (left) and SP (right). Prior to the experiment, TTX was applied to the whole-brain preparation to block all synaptic transmission mediated by action potentials. Each color indicates data obtained from each neuron (n = 4). Based on the response profile, the blue neuron is pFTN-III, and the purple, red, and green neurons are pFTN-IV.
Fig. 6.
Fig. 6.
A role of substance P (SP) and acetylcholine (ACh) in the parabrachial (PB) nucleus in the production of fictive vocalizations. A: example injection site of agonists and antagonists shown in a horizontal section of the brain of Xenopus laevis. The top and the bottom of the images are the rostral and the caudal edge of the tissue, respectively, and the dotted white line indicates the midline. Neurotrace staining is in green, and injection sites are shown in red. A white rectangle area on the left image is enlarged on the right. N.I, nucleus isthmi; N.V., cranial nerve V; OT, optic tectum; V.IV, fourth ventricle. For all the laryngeal nerve recording traces shown in C through F, the y-axis is the same for before (5-HT), during (pharmacological agents), and after (wash, saline, DMSO) the drug injection for each brain, even though the noise is increased in some cases. B: summary of the pharmacological experiments. atr/tbc, Cocktail of atropine and tubocurarine; n, sample size; % brain sang with ligands, proportion of brains that generated fictive vocalizations (including fast and/or slow trills) in response to the ligand injection or bath application; % brain sang after washout, proportion of the brain that sang in response to the application of 5-HT after the target ligands were washed out for 1–4 h. C: laryngeal nerve recordings in response to the bilateral injection of ACh into PB (n = 6). Left: fictive advertisement calls recorded from the laryngeal nerve in response to the bath application of 5-HT 1 h before ACh injection. Middle: laryngeal nerve recordings obtained in response to ACh injected into PBs. Right: laryngeal nerve recordings obtained in response to 5-HT application 1 h after ACh was washed out of the bath. D: laryngeal nerve recordings in response to the bilateral injection of SP into PBs (n = 4). D1, D2, and D3 show three different responses observed from four brains injected with SP into PB. Left: fictive advertisement calls recorded from the laryngeal nerve in response to the bath application of 5-HT 1 h before SP injection. Right for D1 and D2, middle for D3, laryngeal nerve recordings after SP was injected bilaterally into the PBs. D3. Right: fictive advertisement calls recorded from the laryngeal nerve in response to the bath application of 5HT after a 1-h wash of SP injection into PB. E: laryngeal nerve recordings in response to the bilateral injection of atropine and tubocurarine followed by 5-HT (n = 5). Left: fictive advertisement calls recorded from the laryngeal nerve in response to the bath application of 5-HT. Middle: laryngeal nerve recordings obtained when atropine and tubocurarine were injected bilaterally into PBs immediately followed by the bath application of 5-HT. Right: laryngeal nerve recordings obtained when the vehicle (saline) was bilaterally injected into PB immediately followed by bath application of 5-HT. F: laryngeal nerve recordings in response to the bilateral injection of aprepitant immediately followed by 5-HT application (n = 3). Left: fictive advertisement calls recorded from the laryngeal nerve in response to the bath application of 5-HT. Middle: laryngeal nerve recordings obtained when aprepitant was injected bilaterally into PB immediately followed by the bath application of 5-HT. Right: laryngeal nerve recordings obtained when the vehicle (10% DMSO in saline) were bilaterally injected into PB followed by bath application of 5-HT. G: peak amplitude and instantaneous frequency of the compound action potentials (CAPs) plotted against CAP order for fictive fast trills obtained from brains before, during, and after aprepitant injection into the PBs (data shown in F). Gray traces are individual calls (n = 3 to 10 calls per animal per treatment), and the black traces are average for each animal for each experimental condition. Note that the CAP amplitude and instantaneous frequency show a progressive increase during fast trills before (5-HT, left) and after (DMSO, 5-HT, right), but not during bilateral injection of aprepitant into PBs (middle).
Fig. 7.
Fig. 7.
Example calcium imaging traces of putative fast trill neurons (pFTN) I through IV obtained from female parabrachial nucleus. The x- and y-axis indicate the time and a relative measurement of cytoplasmic [Ca2+], respectively. Arrows indicate the time at which pharmacological agents were applied, and the black horizontal bar indicates the time during which cells were incubated with GABA and glycine (Gly). NMDA, N-methyl-d-aspartate; SP, substance P.
Fig. 8.
Fig. 8.
Frequency histogram of 12 subclasses of parabrachial neurons of adult male (n = 8) and female (n = 4) Xenopus laevis. Each bar indicates the average and standard error. Although males and females produce sexually distinct vocalizations, all 12 subclasses of parabrachial (PB) neurons found in males are also found in females at a similar frequency. Mann–Whitney U test, Z statistics, and P value are shown under the histogram for each cell subclass. Note that none of the comparisons are statistically significant.

Similar articles

Cited by

References

    1. Babski H, Jovanic T, Surel C, Yoshikawa S, Zwart MF, Valmier J, Thomas JB, Enriquez J, Carroll P, Garcès A. A GABAergic Maf-expressing interneuron subset regulates the speed of locomotion in Drosophila. Nat Commun 10: 4796, 2019. doi:10.1038/s41467-019-12693-6. - DOI - PMC - PubMed
    1. Bass AH. Central pattern generator for vocalization: is there a vertebrate morphotype? Curr Opin Neurobiol 28: 94–100, 2014. doi:10.1016/j.conb.2014.06.012. - DOI - PMC - PubMed
    1. Bass AH, Baker R. Phenotypic specification of hindbrain rhombomeres and the origins of rhythmic circuits in vertebrates. Brain Behav Evol 50, Suppl 1: 3–16, 1997. doi:10.1159/000113351. - DOI - PMC - PubMed
    1. Bonis JM, Neumueller SE, Krause KL, Kiner T, Smith A, Marshall BD, Qian B, Pan LG, Forster HV. A role for the Kolliker-Fuse nucleus in cholinergic modulation of breathing at night during wakefulness and NREM sleep. J Appl Physiol (1985) 109: 159–170, 2010. doi:10.1152/japplphysiol.00933.2009. - DOI - PMC - PubMed
    1. Boscan P, Dutschmann M, Herbert H, Paton JF. Neurokininergic mechanism within the lateral crescent nucleus of the parabrachial complex participates in the heart-rate response to nociception. J Neurosci 25: 1412–1420, 2005. doi:10.1523/JNEUROSCI.4075-04.2005. - DOI - PMC - PubMed

Publication types

MeSH terms

LinkOut - more resources