

LncRNA HOTAIR enhances breast cancer radioresistance through facilitating HSPA1A expression via sequestering miR-449b-5p
- PMID: 32374522
- PMCID: PMC7327697
- DOI: 10.1111/1759-7714.13450
LncRNA HOTAIR enhances breast cancer radioresistance through facilitating HSPA1A expression via sequestering miR-449b-5p
Abstract
Background: Breast cancer (BRCA) is the leading cause of cancer-related death in women worldwide. Pre- and postoperative radiotherapy play a pivotal role in BRCA treatment but its efficacy remains limited and plagued by the emergence of radiation resistance, which aggravates patient prognosis. The long noncoding RNA (lncRNA)-implicated mechanisms underlying radiation resistance are rarely reported. The aim of this study was to determine whether lncRNA HOX transcript antisense RNA (HOTAIR) modulated the radiosensitivity of breast cancer through HSPA1A.
Methods: A Gammacell 40 Exactor was used for irradiation treatment. Bioinformatic tools and luciferase reporter assay were adopted to explore gene expression profile and demonstrate the interactions between lncRNA, miRNA and target mRNA 3'-untranslated region (3'-UTR). The expression levels of certain genes were determined by real-time PCR and western-blot analyses. in vitro and in vivo functional assays were conducted by cell viability and tumorigenicity assays.
Results: The levels of oncogenic lncRNA HOTAIR were positively correlated with the malignancy of BRCA but reversely correlated with the radiosensitivity of breast cancer cells. Moreover, the expression levels of HOTAIR were positively associated with those of heat shock protein family A (Hsp70) member 1A (HSPA1A) in clinical BRCA tissues and HOTAIR upregulated HSPA1A at the mRNA and protein levels in irradiated BRCA cells. Mechanistically, miR-449b-5p restrained HSPA1A expression through targeting the 3'-UTR of HSPA1A mRNA, whereas HOTAIR acted as a competing sponge to sequester miR-449b-5p and thereby relieved the miR-449b-5p-mediated HSPA1A repression. Functionally, HOTAIR conferred decreased radiosensitivity on BRCA cells, while miR-449b-5p overexpression or HSPA1A knockdown abrogated the HOTAIR-enhanced BRCA growth under the irradiation exposure both in vitro and in vivo.
Conclusions: LncRNA HOTAIR facilitates the expression of HSPA1A by sequestering miR-449b-5p post-transcriptionally and thereby endows BRCA with radiation resistance.
Key points: Therapeutically, HOTAIR and HSPA1A may be employed as potential targets for BRCA radiotherapy. Our findings shed new light into the mechanism by which lncRNAs modulate the radiosensitivity of tumors.
Keywords: Breast cancer; HOTAIR; HSPA1A; miR-449b-5p; radioresistance.
© 2020 The Authors. Thoracic Cancer published by China Lung Oncology Group and John Wiley & Sons Australia, Ltd.
Figures
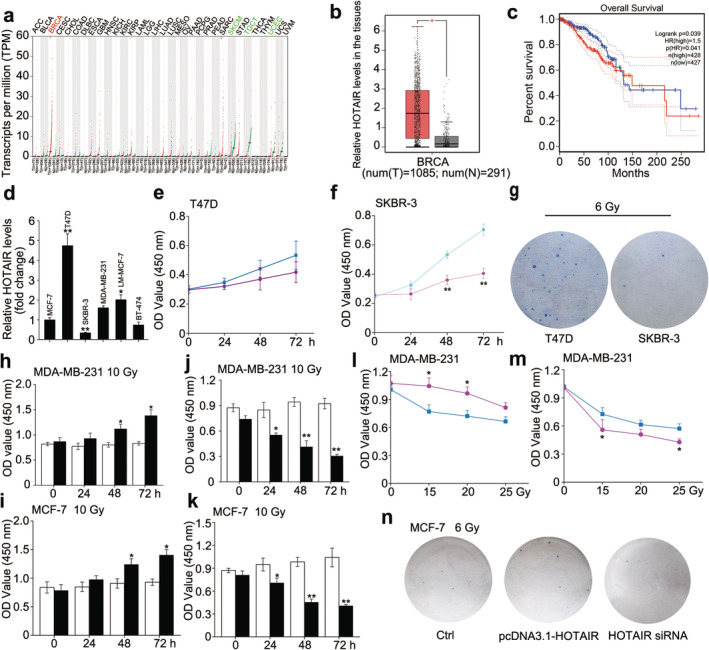
 ) Tumour, (
 ) Normal (b) and the relationship between HOTAIR levels and overall survival of BRCA patients (
 ) Tumour, (
 ) Normal (c) were obtained from the GEPIA database. (
 ) Low HOTAIR TPM, (
 ) High HOTAIR TPM (d) The relative abundance of HOTAIR in different BRCA cells was determined by real‐time PCR. (e and f) CCK‐8 assay was used to measure the cell viability of T47D (e) (
 ) 0 Gy, (
 ) 10 Gy and SKBR‐3 (f) after 0 or 10 Gy irradiation treatment. (
 ) 0 Gy, (
 ) 10 Gy (g) Colony formation assay was used to measure the proliferative ability of T47D and SKBR‐3 after 6 Gy irradiation treatment. (h and i) MDA‐MB‐231 and MCF‐7 cells were transfected with pcDNA3.1/pcDNA3.1‐HOTAIR 12 hours before the irradiation treatment, CCK‐8 assay was used to measure the cell viability after 10 Gy irradiation treatment. (
 ) pcDNA3.1, (
 ) pcDNA3.1‐HOTAIR (j and k) MDA‐MB‐231 and MCF‐7 cells were transfected with siRNA Ctrl/si‐HOTAIR 12 hours before the irradiation treatment, CCK‐8 assay was used to measure the cell viability after 10 Gy irradiation treatment. ; (
 ) siRNA Ctrl, (
 ) HOTAIR siRNA; (l and m) MDA‐MB‐231 cells were transfected with pcDNA3.1/pcDNA3.1‐HOTAIR (l) or siRNA Ctrl/si‐HOTAIR (
 ), pcDNA3.1, (
 ) pcDNA3.1‐HOTAIR (m) 12 hours before the irradiation treatment, CCK‐8 assay was used to measure the cell viability after 0, 15, 20 and 25 Gy irradiation treatment. (
 ) siRNA Ctrl, (
 ) HOTAIR siRNA (n) MCF‐7 cells were transfected with pcDNA3.1 + siRNA Ctrl/pcDNA3.1‐HOTAIR/si‐HOTAIR 12 hours before the irradiation treatment, then colony formation assay was used to measure the proliferative ability after 6 Gy irradiation treatment. Data are shown as mean ± SD of three independent experiments. Statistical significant differences are indicated: *, P < 0.05; **, P < 0.01; Student's t‐test.
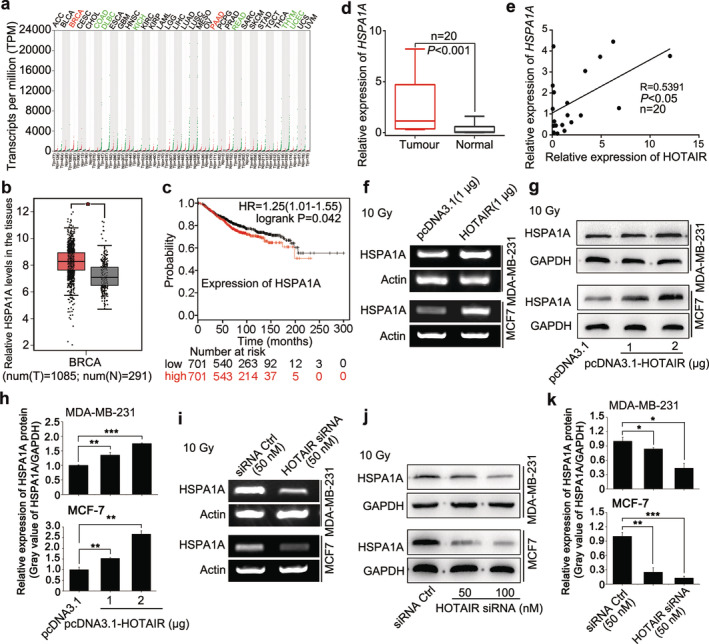
 ) Tumour, (
 ) Normal (b) were obtained from the GEPIA database. (
 ) Tumour, (
 ) Normal (c) The relationship between HSPA1A levels and overall survival of BRCA patients was explored by searching the Kaplan‐Meier Plotter database. (
 ) Low, (
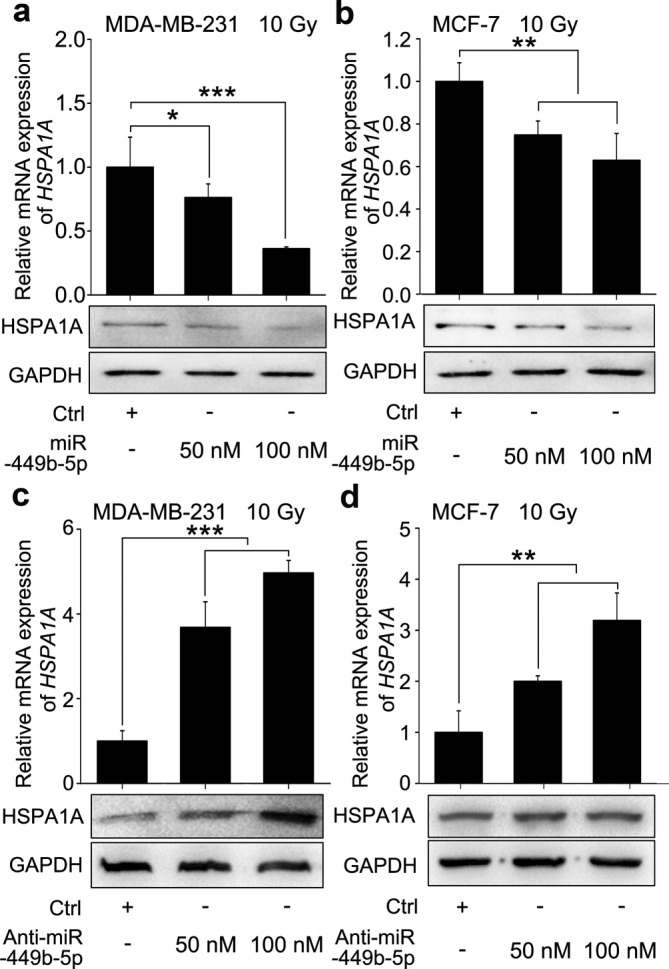
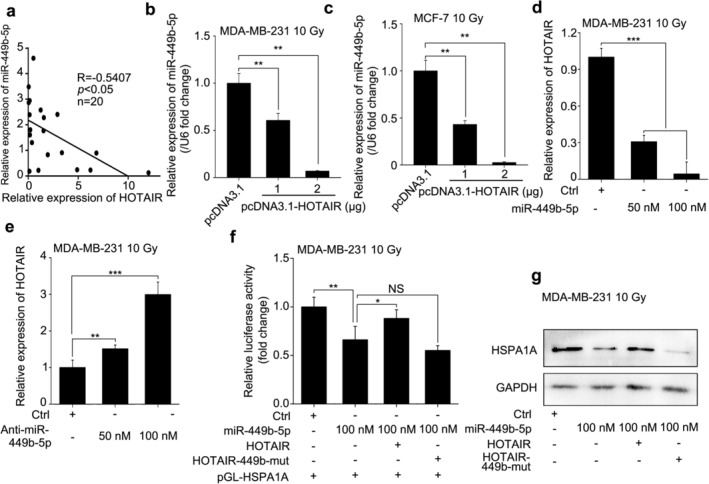
 ) High (d) The expression of HSPA1A at mRNA level in 20 cases of clinical BRCA tissues and their paired peritumor tissues (P < 0.001, Wilcoxon's signed‐rank test) was examined by real‐time PCR analysis. (e) The correlation of HSPA1A and HOTAIR mRNA levels in 20 cases of clinical BRCA tissues was measured by real‐time PCR and analyzed by Pearson's correlation (R = 0.5391, P < 0.05). (f–h) The levels of HSPA1A mRNA (f) and protein (g and h) in irradiated BRCA cell lines MDA‐MB‐231 and MCF‐7 after the transfection of pcDNA3.1/pcDNA3.1‐HOTAIR were tested by RT‐PCR and western blot analysis, respectively. The relative expression levels of HSPA1A in three independent experiments were statistically analyzed by measuring the gray value of each band using Image J software. (i–k) The levels of HSPA1A mRNA (i) and protein (j and k) in irradiated BRCA cell lines MDA‐MB‐231 and MCF‐7 after the transfection of siRNA Ctrl/si‐HOTAIR were tested by RT‐PCR and western blot analysis, respectively. The relative expression levels of HSPA1A in three independent experiments were statistically analyzed by measuring the gray value of each band using Image J software. Data are shown as mean ± SD of three independent experiments. Statistical significant differences are indicated: *, P < 0.05; **, P < 0.01; ***, P < 0.001; Student's t‐test.
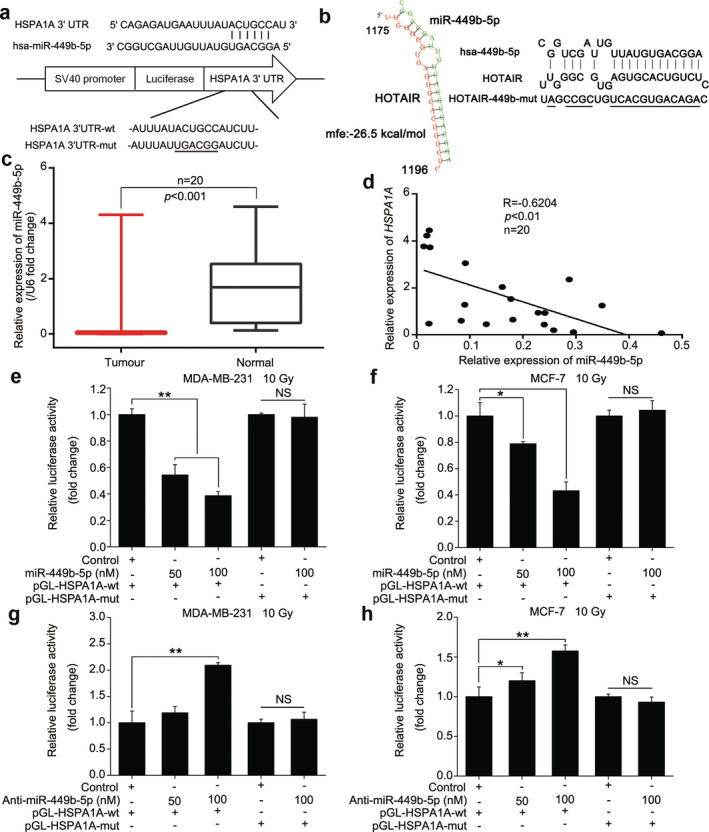
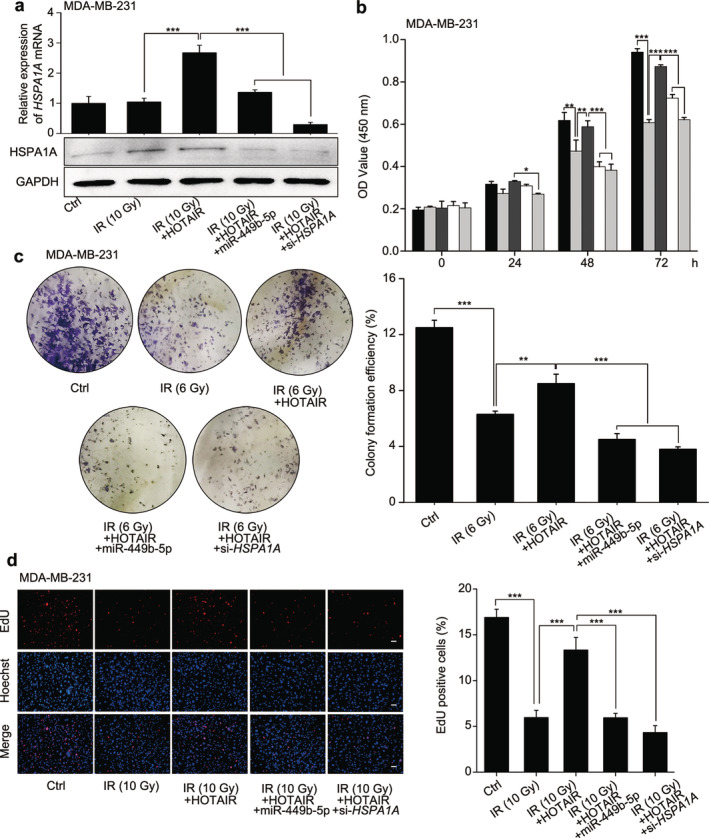
 ) Ctrl, (
 ) IR 10 Gy, (
 ) IR 10 Gy + HOTAIR, (
 ) IR 10 Gy + HOTAIR+miR‐449b‐5p, (
 ) IR 10 Gy + HOTAIR + si‐HSPA1A (c and d) The proliferative ability of MDA‐MB‐231 cells from each group was validated by colony formation assay (c) and EdU incorporation assay (d, scale bar, 30 μM), respectively. The colony formation efficiency and percentage of EdU positive cells were calculated. Data are shown as mean ± SD of three independent experiments. Statistical significant differences are indicated: *, P < 0.05; **, P < 0.01; ***, P < 0.001; NS, no significance; Student's t‐test.
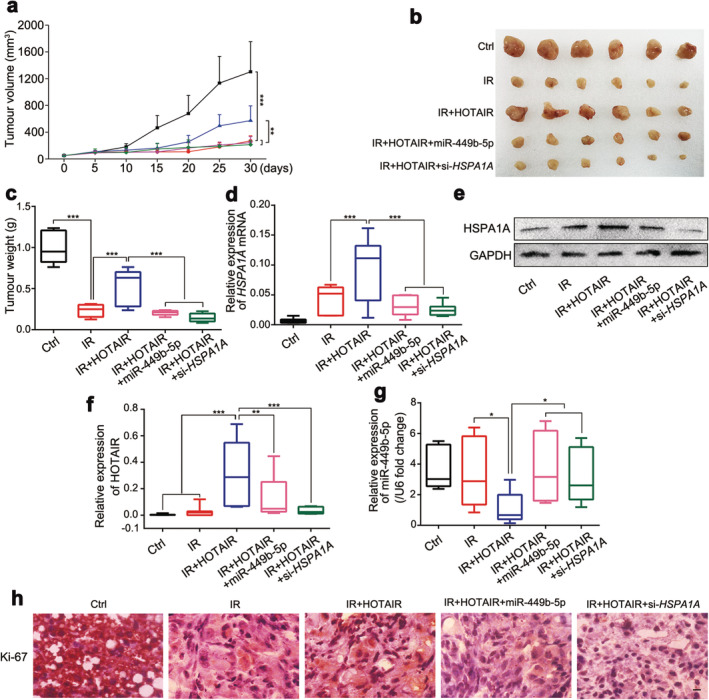
 ) Ctrl, (
 ) IR, (
 ) IR + HOTAIR, (
 ) IR + HOTAIR + miR‐449b‐5p, (
 ) IR + HOTAIR + si‐HSPA1A (b and c) The image of excised tumors and tumor weights of each group are presented. (d–g) The expression levels of HSPA1A mRNA and protein (d and e), HOTAIR (f) and miR‐449b‐5p (g) were quantified by real‐time PCR or western blot analysis. (h) The expression levels of Ki‐67 in tumor tissues were examined by IHC staining. Scale bar, 20 μM. Data are shown as mean ± SD of three independent experiments. Statistical significant differences are indicated: *, P < 0.05; **, P < 0.01; ***, P < 0.001; Student's t‐test.
References
-
- Harbeck N, Penault‐Llorca F, Cortes J et al Breast cancer. Nat Rev Dis Primers 2019; 5: 66. - PubMed
-
- Freddie B, Jacques F, Isabelle S et al GLOBOCAN Estimates of Incidence and Mortality Worldwide for 36 Cancers in 185 Countries. A Cancer Journal for Clinicians, CA: 2018.
-
- Llombart‐Cussac A, Cortes J, Pare L et al HER2‐enriched subtype as a predictor of pathological complete response following trastuzumab and lapatinib without chemotherapy in early‐stage HER2‐positive breast cancer (PAMELA): An open‐label, single‐group, multicentre, phase 2 trial. Lancet Oncol 2017; 18: 545–54. - PubMed
Publication types
MeSH terms
Substances
Grants and funding
- 2018M631391/China Postdoctoral Science Foundation/International
- 81572969/National Natural Science Foundation of China/International
- 81730086/National Natural Science Foundation of China/International
- 81803062/National Natural Science Foundation of China/International
- 81872555/National Natural Science Foundation of China/International
LinkOut - more resources
Full Text Sources
Medical
