. 2020 May 6;15(5):e0231999.
doi: 10.1371/journal.pone.0231999. eCollection 2020.

The genomic landscape of metastatic breast cancer: Insights from 11,000 tumors

Affiliations

The genomic landscape of metastatic breast cancer: Insights from 11,000 tumors

Jacob Rinaldi et al. PLoS One. .

Abstract

Background: Metastatic breast cancer is the leading cause of cancer death in women, but the genomics of metastasis in breast cancer are poorly studied.

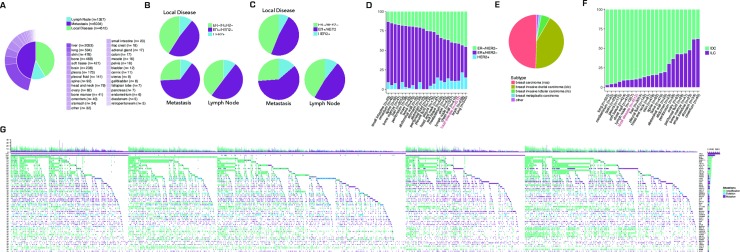
Methods: We explored a set of 11,616 breast tumors, including 5,034 metastases, which had undergone targeted sequencing during standard clinical care.

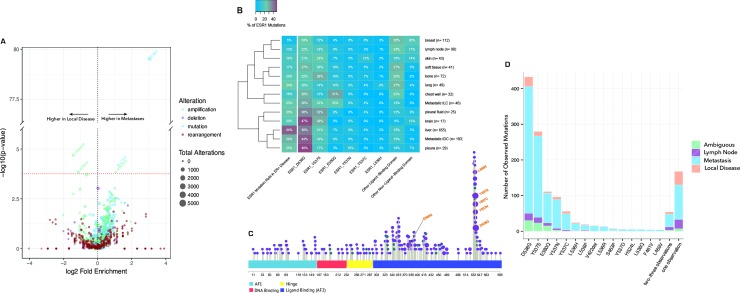
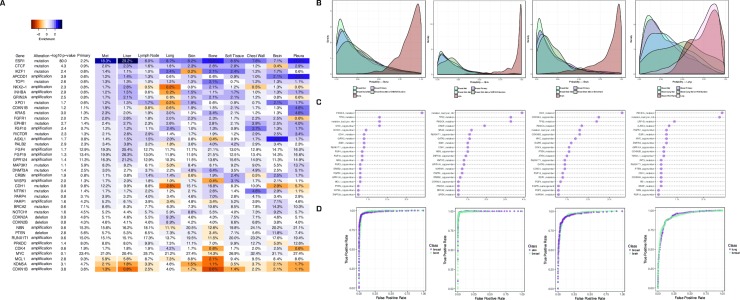
Results: Besides the known hotspot mutations in ESR1, we observed a metastatic enrichment of previously unreported, lower-prevalence mutations in the ligand-binding domain, implying that these mutations may also be functional. Furthermore, individual ESR1 hotspots are significantly enriched in specific metastatic tissues and histologies, suggesting functional differences between these mutations. Other alterations enriched across all metastases include loss of function of the CDK4 regulator CDKN1B, and mutations in the transcription factor CTCF. Mutations enriched at specific metastatic sites generally reflect biology of the target tissue and may be adaptations to growth in the local environment. These include PTEN and ASXL1 alterations in brain metastases and NOTCH1 alterations in skin. We observed an enrichment of KRAS, KEAP1, STK11 and EGFR mutations in lung metastases. However, the patterns of other mutations in these tumors indicate that these are misdiagnosed lung primaries rather than breast metastases.

Conclusions: An order-of-magnitude increase in samples relative to previous studies allowed us to detect novel genomic characteristics of metastatic cancer and to expand and clarify previous findings.


Conflict of interest statement

All authors were employees and may have held shares of Genentech/Roche or Foundation Medicine at the time this work was completed. Both companies are involved in the development of cancer drugs and clinical assays for metastatic breast cancer, and have multiple patents in related areas. This does not alter our adherence to PLOS ONE policies on sharing data and materials.

Figures

Fig 1
Fig 1. Overview of clinical and genomic data.
(a) Frequency of biopsy sites for 10,903 sequenced breast cancer samples. An additional 713 tumors had an ambiguous classification. (b) Prevalence of HER2 amplification and inferred ER status by biopsy site in 10,903 samples. ER status was inferred using a machine learning algorithm trained on 1,405 samples for which subtype was known–out-of-bag predictions are plotted for samples in training set, true values for these samples are shown in C (see S1 Fig). (c) Prevalence of HER2 amplification and ER IHC status by biopsy site in 1,405 samples with complete clinical annotation. (d) Prevalence of inferred molecular subtype by metastatic site (n = 11293, note that some samples have a tissue biopsy site that confers ambiguous primary/met/ln status and 98 samples were from unknown sites). (e) Prevalence of histological subtype for all sequenced samples (n = 11616). (f) Prevalence of histological subtype by biopsy site Histological subtype was inferred using a machine learning algorithm trained on annotated data (see S1 Fig, n = 11293). (g) Landscape of genomic alterations in the cohort. Each cell represents the status of one gene in one patient, colored by alteration type (mutation, amplification, or deletion). Genes (rows) are sorted by alteration rate. Barplot shows alterations per sample, colored by type.
Fig 2
Fig 2. Comparison of metastatic tumors and local disease.
(a) Enrichment analysis for alterations occurring at different rates in metastatic tumors vs. local disease, controlling for mutation load and molecular subtype (ER status and HER2 amplification). (b) Prevalence of ESR1 hotspot mutations by metastatic site and histological subtype. The far-left column represents the percent of patients with at least one ESR1 mutation. All other columns represent the percentage of ESR1 mutations of a certain type that we observe within a specific patient stratification (i.e., the top-left corner shows that 27% of the ESR1 mutations we see in soft tissue samples are D538G). ESR1 hotspots occur at significantly different frequencies at different metastatic sites, a result that we do not observe for other genes. (c) Distribution of ESR1 mutations in the cohort, sized by prevalence. The majority of mutations occur within the ligand-binding domain. (d) Number of ESR1 mutations by hotspot. All mutations observed 4 or more times are shown. Mutations observed 2–3 times, or 1 time, were pooled for analysis.
Fig 3
Fig 3. Mutations associated with specific metastatic sites.
(a) Alterations enriched at specific metastatic sites. P-values represent comparison between all metastases and local disease. Each cell represents the rate of a specific alteration at a specific metastatic site, colored by enrichment or depletion relative to all local tumors. (b) Probability distributions for a panel of validation samples, using machine learning algorithms trained to differentiate breast tumors from bone, skin, brain, and lung tumors (left to right) using genomic features. Alterations enriched at each metastatic site were not included in the classifiers, but were used to stratify patients—to determine if any of the observed enrichments could be explained by misdiagnosis of new primary tumors. (c) Variable importance for the machine learning algorithms used in (b). The x-axis represents the mean decrease in accuracy of the classifier when a variable is permuted and indicates how useful a specific alteration is in determining the tissue of origin of a tumor from the set of genomic alterations it harbors. (d) ROC curves for the machine learning algorithms used in (b). Each point represents the true and false positive rate for one indication using one threshold on the model output to make a classification decision. A larger area under the curve represents a more accurate model, and we achieve high accuracy in all cases (93.8%, 96.6%, 91.7%, and 85.9% from left to right).

Similar articles

Cited by

References

    1. Torre L. A., Islami F., Siegel R. L., Ward E. M. & Jemal A. Global cancer in women: burden and trends. (AACR, 2017). - PubMed
    1. Gupta G. P. & Massagué J. Cancer metastasis: building a framework. Cell 127, 679–695 (2006). 10.1016/j.cell.2006.11.001 - DOI - PubMed
    1. Valastyan S. & Weinberg R. A. Tumor metastasis: molecular insights and evolving paradigms. Cell 147, 275–292 (2011). 10.1016/j.cell.2011.09.024 - DOI - PMC - PubMed
    1. Scully O. J., Bay B.-H., Yip G. & Yu Y. Breast cancer metastasis. Cancer Genomics-Proteomics 9, 311–320 (2012). - PubMed
    1. Jatoi I. & Rody A. Management of Breast Diseases. (Springer, 2016).