. 2020 May 6;15(5):e0232595.
doi: 10.1371/journal.pone.0232595. eCollection 2020.

The search for yield predictors for mature field-grown plants from juvenile pot-grown cassava (Manihot esculenta Crantz)

Affiliations

The search for yield predictors for mature field-grown plants from juvenile pot-grown cassava (Manihot esculenta Crantz)

Michael O Adu et al. PLoS One. .

Abstract

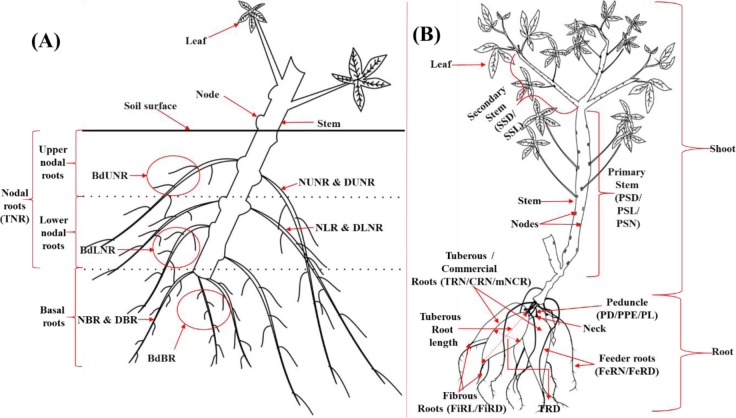
Cassava is the 6th most important source of dietary energy in the world but its root system architecture (RSA) had seldom been quantified. Ability to select superior genotypes at juvenile stages can significantly reduce the cost and time for breeding to bridge the large yield gap. This study adopted a simple approach to phenotyping RSA traits of juvenile and mature cassava plants to identify genotypic differences and the relationships between juvenile traits and harvest index of mature plants. Root classes were categorised and root and shoot traits of eight (8) juvenile pot-grown cassava genotypes, were measured at 30 and 45 days after planting (DAP). The same or related traits were measured at 7 months after planting of the same genotypes grown in the field while yield and yield components were measured in 12-months old field-grown plants. The field experiment was done in 2017 and repeated in 2018. Differences between genotypes for the measured traits were explored using analysis of variance (ANOVA) while traits in juvenile plants were correlated or regressed onto traits measured in 7- and 12-months old plants. The results show significant genotypic variations for most of the traits measured in both juvenile and 7-months old plants. In the 12-months old plants, differences between genotypes were consistent for both 2017 and 2018. Broad-sense heritability was highest for the number of commercial roots (0.87) and shoot fresh weight (0.78) and intermediate for the total number of roots (0.60), harvest index (0.58), fresh weight of roots (0.45). For all the sampling time points or growth stages, there were greater correlations between traits measured at a particular growth stage than between the same traits at different growth stages. However, some juvenile-mature plant trait relationships were significant, positive and consistent for both 2017 and 2018. For example, total root length and the total number of roots in 30 DAP, and branching density of upper nodal roots in 45 DAP, positively correlated with harvest index of 12-months old plants in both 2017 and 2018. Similarly, the diameter of nodal roots, for example, had a negative, significant correlation with fresh shoot biomass of mature plants in both 2017 and 2018. Regression of traits measured in 30 DAP explained up to 22% and 36% of the variation in HI of mature plants in 2017 and 2018, respectively. It is concluded that the simple, rapid, inexpensive phenotyping approach adopted in this study is robust for identifying genotypic variations in juvenile cassava using root system traits. Also, the results provide seminal evidence for the existence of useful relationships between traits of juvenile and mature cassava plants that can be explored to predict yield and yield components.


Conflict of interest statement

The authors have declared that no competing interests exist.

Figures

Fig 1
Fig 1
The categories given to pot-grown juvenile cassava plant (A) and field-grown 7-month old plant parts (B). A: Upper nodal roots: emerged from the topmost nodes within the top 7 cm below the soil surface; lower nodal roots: emerged from the nodes on the stem cutting with 7–13 cm below the soil surface; basal roots: emerged from the callus at the base of the stem cutting. NUNR: number of upper nodal roots; DUNR: diameter of upper nodal roots; BdUNR: branching density of upper nodal roots; NLNR: number of the lower nodal root; DLNR: diameter of lower nodal roots, BdLNR: branching density of lower nodal roots; TNR: total number of nodal roots; NBR: number of basal roots; DBR: diameter of basal roots; BdBR: branching density of basal roots. B: The tuberous roots are the indeterminate, vegetative and starchy storage root that results from the swelling of primary root crown root; the commercial or marketable roots are the premium tuberous roots with no defects; the fibrous roots are the non-storage extensions of the tuberous roots and feeder roots here designate the small, non-storage roots that may be crucial in water and nutrients acquisition from the soil. SSD: secondary stem diameter; SSL: secondary stem length; PSD: primary stem diameter; PSL: primary stem length; PSN: primary stem number; TRD: tuberous roots diameter; TRL: tuberous roots length: TRN: tuberous roots number; FeRD: feeder roots diameter; FeRL: feeder roots length; FeRN: feeder roots number; FiRL: fibrous roots length; FiRD: fibrous roots diameter; PD: peduncle diameter; PE: peduncle extent; PL: peduncle length.
Fig 2
Fig 2
A: Plot of quality of representation of the variables (cos2 of variables) on the factor map for all dimensions, including the first seven dimensions considered significant following the PCA. Components with eigenvalues greater than one were considered significant in PCA. B: Plot showing the total contribution of variables in accounting for the variability in the principal components. C: Plot showing the total contribution of variables in accounting for the variability in PC1 and PC2. The red dashed line on the graph indicates the expected average contribution and variables with a contribution greater than this expected average could be considered as important.
Fig 3
Fig 3. Phenotypic correlations between traits observed in cassava plants grown in soil-filled pots for 30 or 45 days after planting (DAP) and in the field for 7 or 12 months.
A: correlations between traits measured in 30-DAP-pot grown, 7-months plants and 12-months-field grown plants in 2017; B: correlations between traits measured in 45-DAP-pot grown, 7-months plants and 12-months-field grown plants in 2017; C: correlations between traits measured in 30-DAP-pot grown plants, 7-months plants and 12-months-field grown plants in 2018; and D: correlations between traits measured in 45-DAP-pot grown plants, 7-months plants and 12-months-field grown plants in 2018. In each panel, I, II, III, IV, V and VI are correlations between traits measured in 30/45-DAP plants; 30/45-DAP and 7-months plants; within traits of 7-months plants; 30/45-DAP plants and 12-months plants; 7 and 12-month plants; and within traits of 12-months plants, respectively. Full names of traits shown in the matrix are can be found in Tables 1–4. Size and colour of circles within the matrix indicate the magnitude of correlation. The scale is indicated in the bar below the matrix. Blank boxes indicate non-significant relationships (p< 0.05).
Fig 4
Fig 4. Examples of significant (p<0.05) correlations between shoot or root systems traits measured in cassava plants grown in the field for 7 months and traits measured from the same genotypes of cassava grown in soil-filled pots for 30 days.
A: primary stem length with the number of upper nodal roots (NUNR, r = 0.34), number of lower nodal roots (NLNR, r = 0.38), number of nodal roots (NNR, r = 0.37), and total number of roots (TNR, r = 0.40); B: primary stem length with shoot dry weight (SDW, r = 0.48) and root dry weight (RDW, r = 0.34); C: root fresh weight with the diameter of lower nodal roots (DLNR, r = 0.35); D: number of feeder roots with branching density of basal roots (BDBR, r = 0.43) E: number of feeder roots with the number of lower nodal roots (NLNR, r = 0.38) and number of nodal roots (NNR, r = 0.43); F: primary stem length with total root length (TRL, r = 0.31); G: primary stem diameter with shoot dry weight (SDW, r = -0.30) and root dry weight (RDW, r = -0.32) and H: primary stem diameter with number of basal roots (NBR, r = -0.48) and the total number of roots (TNR, r = -0.33).
Fig 5
Fig 5. Examples of significant (p<0.05) correlations between shoot or root systems traits measured in cassava plants grown in the field for 7 months and traits measured from the same genotypes of cassava grown in soil-filled pots for 45 days.
A: primary stem length with branching density of basal roots (BDBR, r = 0.36), branching density of lower nodal roots (BDLNR, r = 0.29) and branching density of upper nodal roots (BDUNR, r = 0.33); B: primary stem length with the number of basal roots (NBR, r = 0.37); C: leafless stem height with the branching density of upper nodal roots (BDUNR, r = 0.29) and branching density of basal roots (BDBR, r = 0.47); D: shoot fresh weight with the number of basal roots (NBR, r = 0.35), and root fresh weight with the number of basal roots (NBR, r = 0.39); E: number of tuberous roots with total roots length (TRL, r = 0.29); F: number of feeder roots with the number of basal roots (NBR, r = 0.48); G: diameter of the primary stem with the diameter of basal roots (DBR, r = -0.61), the diameter of lower nodal roots (DLNR, r = -0.37) and diameter of upper nodal roots (DUNR, r = -0.57); and H: primary stem diameter with total root length (TRL, r = -0.31).
Fig 6
Fig 6. Examples of significant (p<0.05) correlations between shoot or root systems traits measured in cassava plants grown in the field for 12 months and traits measured from the same genotypes of cassava grown in soil-filled pots for 30 days.
A: harvest index in 2017 with shoot fresh weight (r = 0.29) and root fresh weight (r = 0.41); harvest index in 2018 with shoot fresh weight (r = 0.39) and root fresh weight (r = 0.35); B: harvest index in 2017 with total root length (r = 0.36) and harvest index in 2018 with total root length (r = 0.41); C: number of commercial roots in 2018 with branching density of upper nodal roots (r = 0.37), branching density of lower nodal roots (r = 0.30) and branching density of basal roots (r = 0.32); D: harvest index in 2017 with total number of roots (r = 0.29) and harvest index in 2018 with total number of roots (r = 0.41); E: harvest index in 2018 with diameter of lower nodal roots (r = 0.47) and diameter of upper nodal roots (r = 0.32); F: shoot fresh weight in 2017 with diameter of upper nodal roots (r = -0.32) and shoot fresh weight in 2018 with diameter of upper nodal roots (r = -0.39); G: shoot fresh weight in 2018 with total root length (r = -0.36); H: total number of roots in 2017 with diameter of upper nodal roots (r = -0.33); shoot fresh weight in 2018 with total number of roots (r = -0.39), number of nodal roots (r = -0.43) and number of lower nodal roots (r = -0.44).
Fig 7
Fig 7. Examples of significant (p<0.05) correlations between shoot or root systems traits measured in cassava plants grown in the field for 12 months and traits measured from the same genotypes of cassava grown in soil-filled pots for 45 days.
A: harvest index in 2017 with branching density of upper nodal roots (r = 0.32) and harvest index in 2018 with branching density of upper nodal roots (r = 0.45); B: harvest index in 2018 with branching density of lower nodal roots (r = 0.36) and with branching density of basal roots (r = 0.33); C: harvest index in 2017 with the total number of nodal roots (r = 0.34) and harvest index in 2018 with number of basal roots (r = 0.35); D: harvest index in 2017 with the diameter of lower nodal roots (r = 0.34) and harvest index in 2018 with the diameter of basal roots (r = 0.32); E: root fresh weight in 2017 with number of lower nodal roots (r = 0.30) and with number of nodal roots (r = 9.30); F: total number of roots in 2017 with number of upper nodal roots (r = 0.35), with number of lower nodal roots (r = 0.47), and with number of all nodal roots (r = 0.41); G: shoot fresh weight in 2017 with the diameter of lower nodal roots (r = -0.33); H: shoot fresh weight in 2018 with root dry weigh (r = -0.29), and I: shoot fresh weight in 2018 with branching density of upper nodal roots (r = -0.32), and with branching density of basal roots (r = -0.33).

Similar articles

Cited by

References

    1. El-Sharkawy MA. Cassava biology and physiology. Plant molecular biology. 2003. November 1;53(5):621–41. 10.1023/B:PLAN.0000019065.31490.06 - DOI - PubMed
    1. MoFA. Agriculture in Ghana Facts and Figures (2010) Ministry of Food and Agriculture, Statistics, Research and Information Directorate (SRID). 2011.
    1. Parkes EY, Allotey DF, Akuffo EA. Yield Performance of five cassava genotypes under different fertilizer rates. International Journal of Agricultural Sciences. 2012. May 1;2(5):iv+-173.
    1. Safo‐Kantanka O, Owusu‐Nipah J. Cassava varietal screening for cooking quality: relationship between dry matter, starch content, mealiness and certain microscopic observations of the raw and cooked tuber. Journal of the Science of Food and Agriculture. 1992;60(1):99–104.
    1. Spencer DS, Ezedinma C. Cassava cultivation in sub-Saharan Africa In Achieving sustainable cultivation of cassava Volume 1 2017. pp. 141–157. Burleigh Dodds Science Publishing.