. 2020 May 6;15(5):e0226791.
doi: 10.1371/journal.pone.0226791. eCollection 2020.

Long-term in vivo biocompatibility of single-walled carbon nanotubes

Affiliations

Long-term in vivo biocompatibility of single-walled carbon nanotubes

Thomas V Galassi et al. PLoS One. .

Abstract

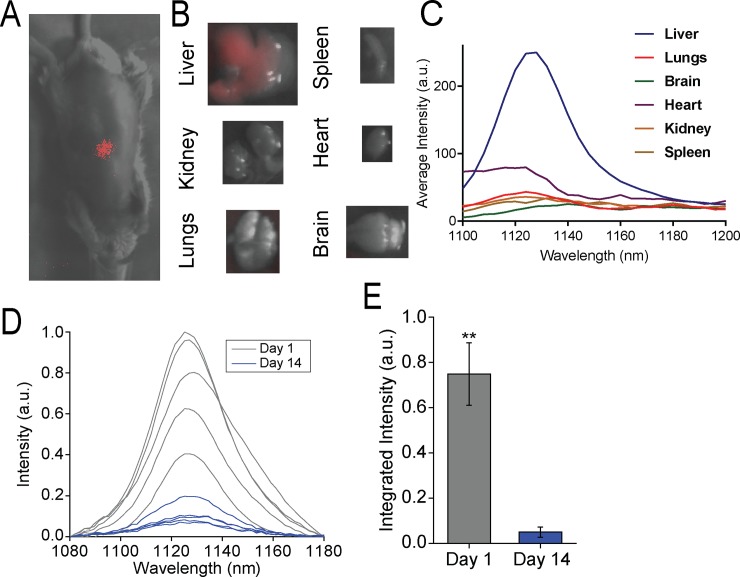
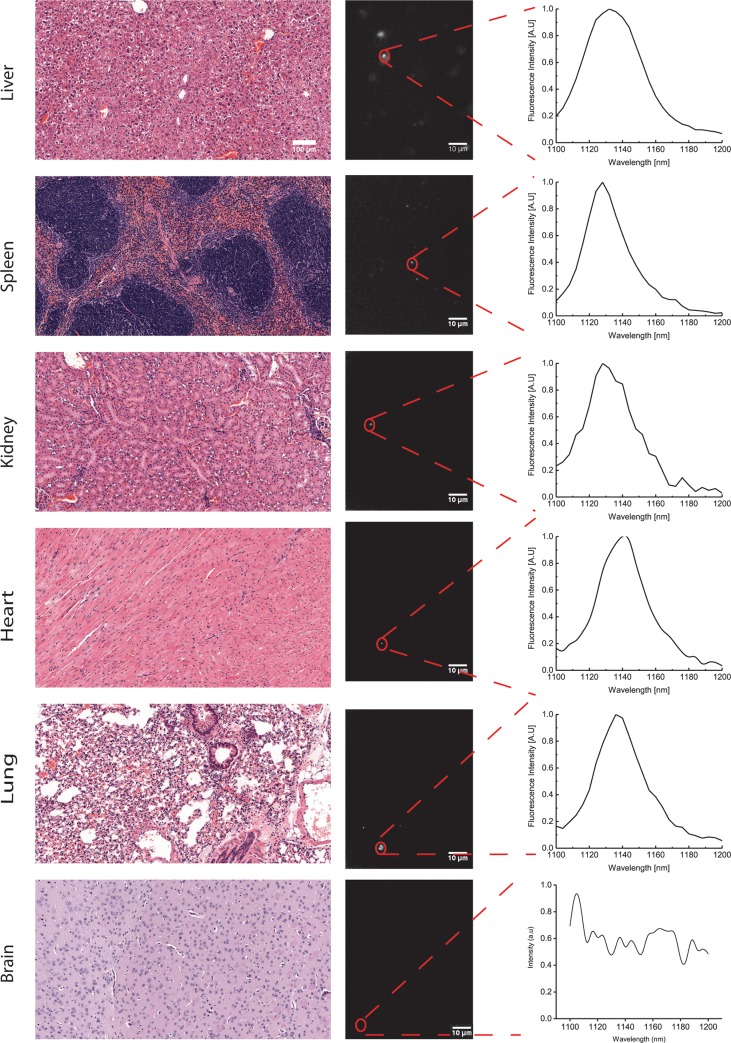
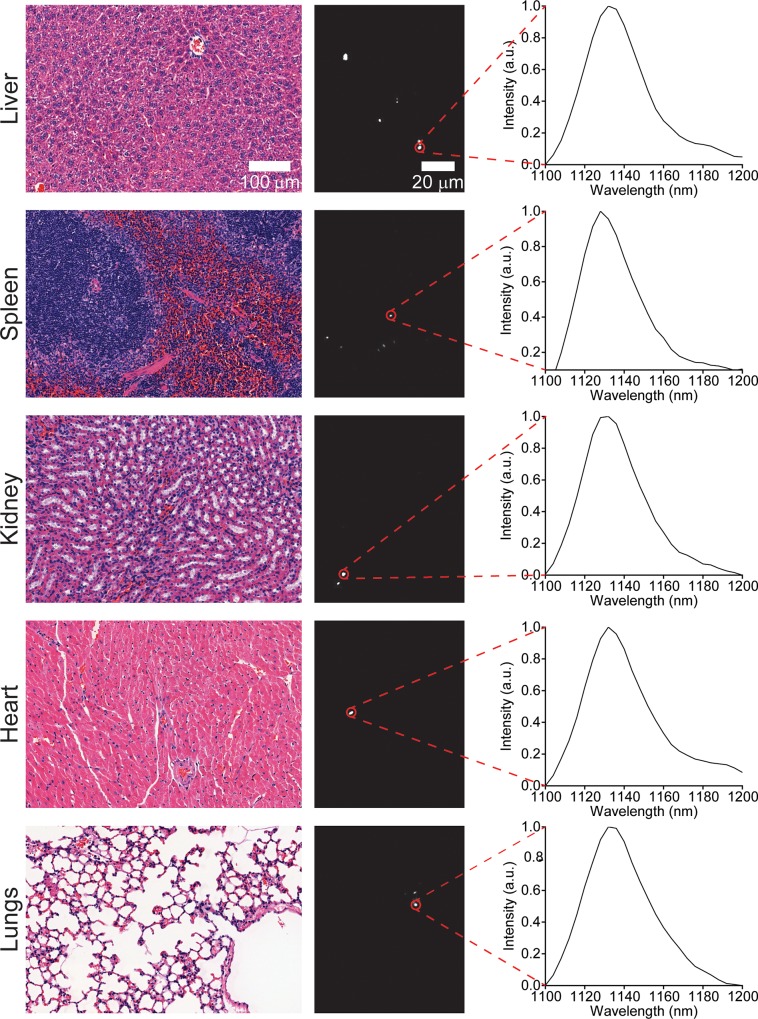
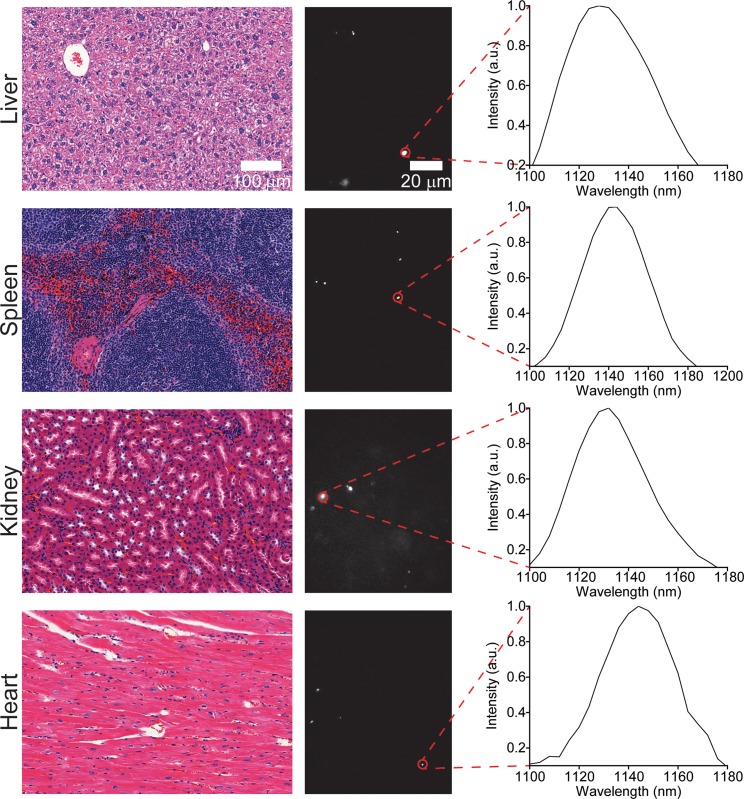
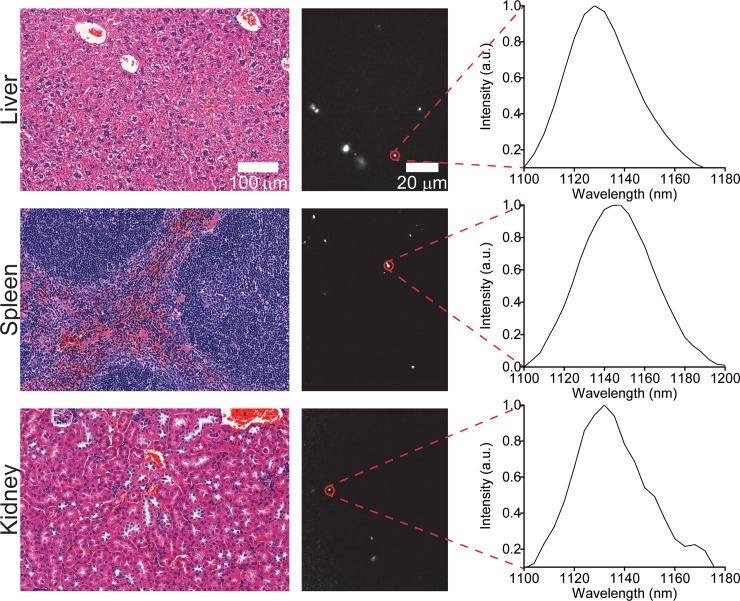
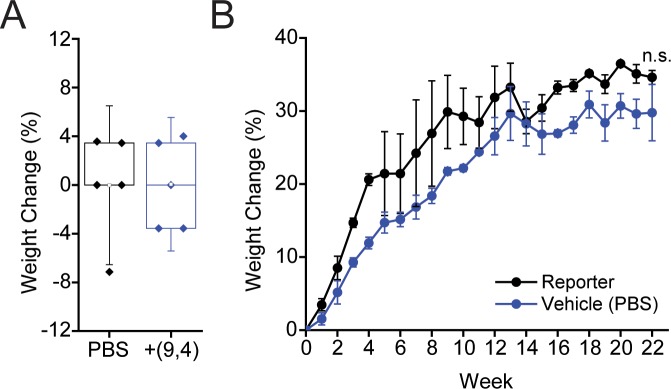
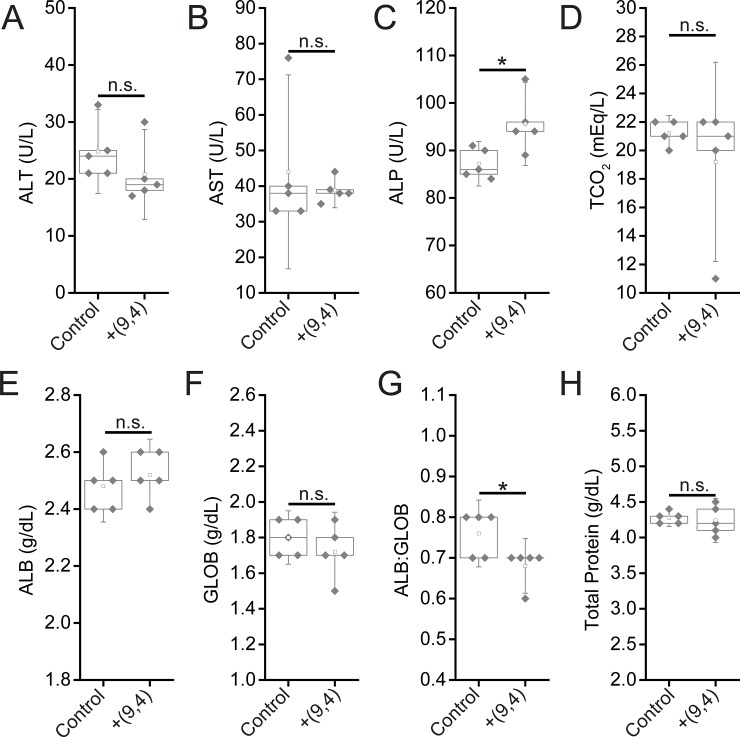
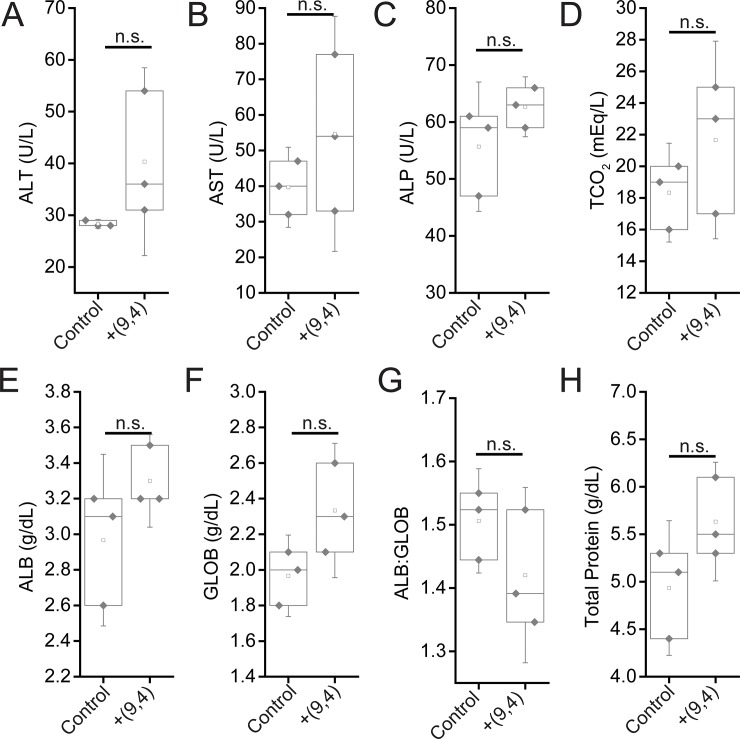
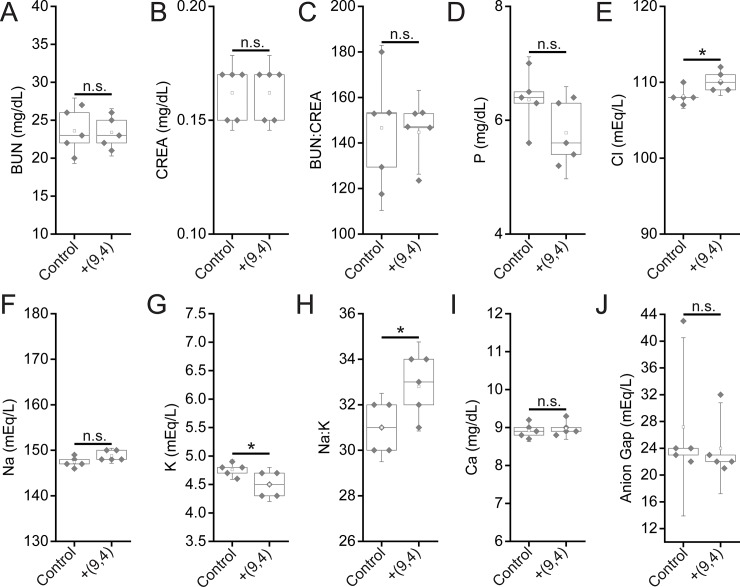
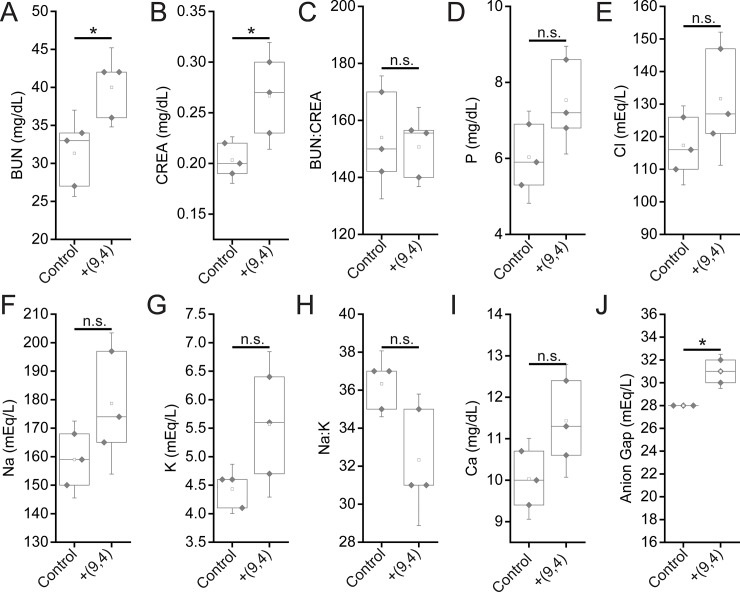
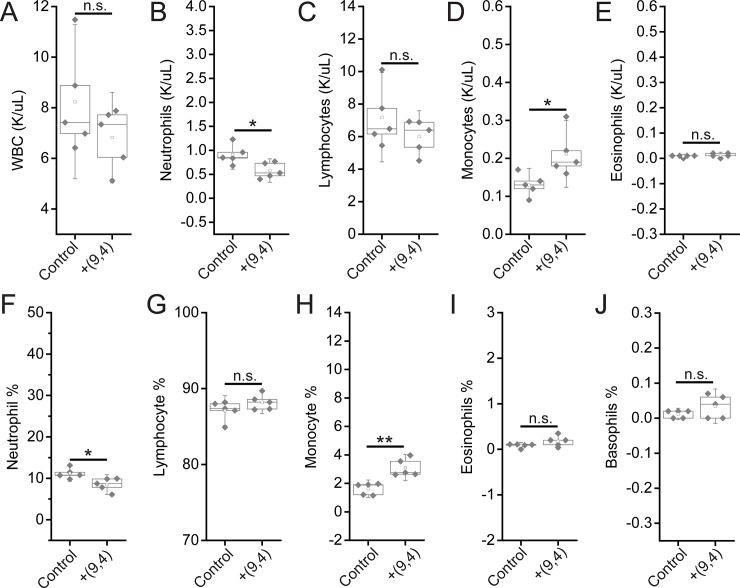
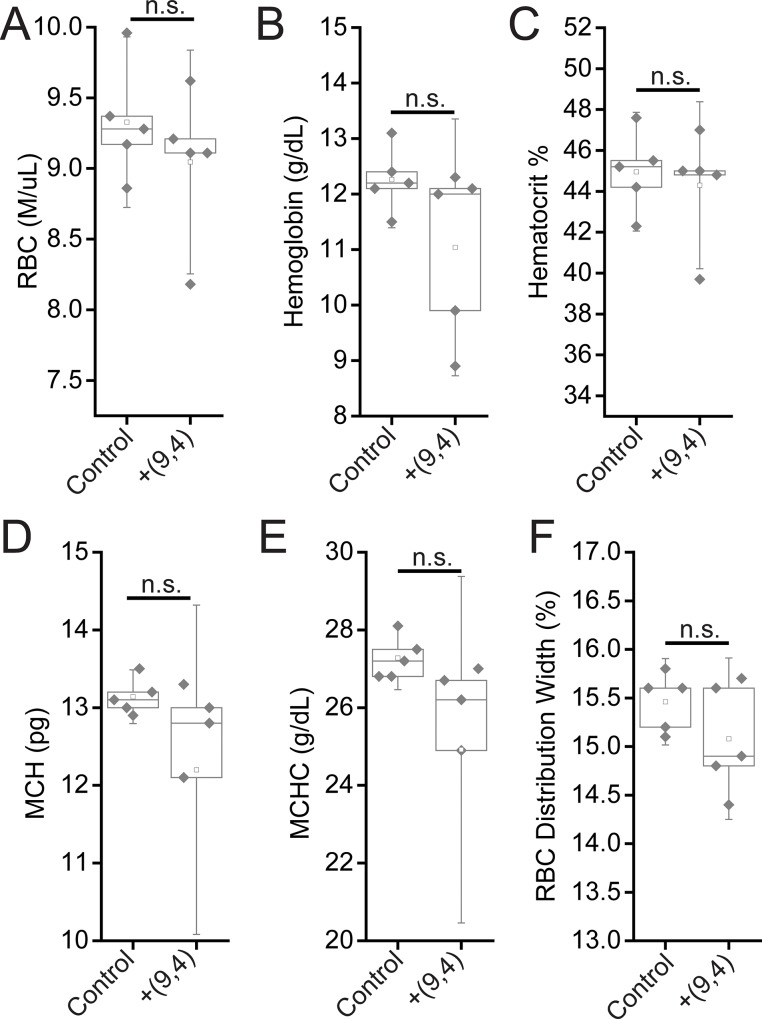
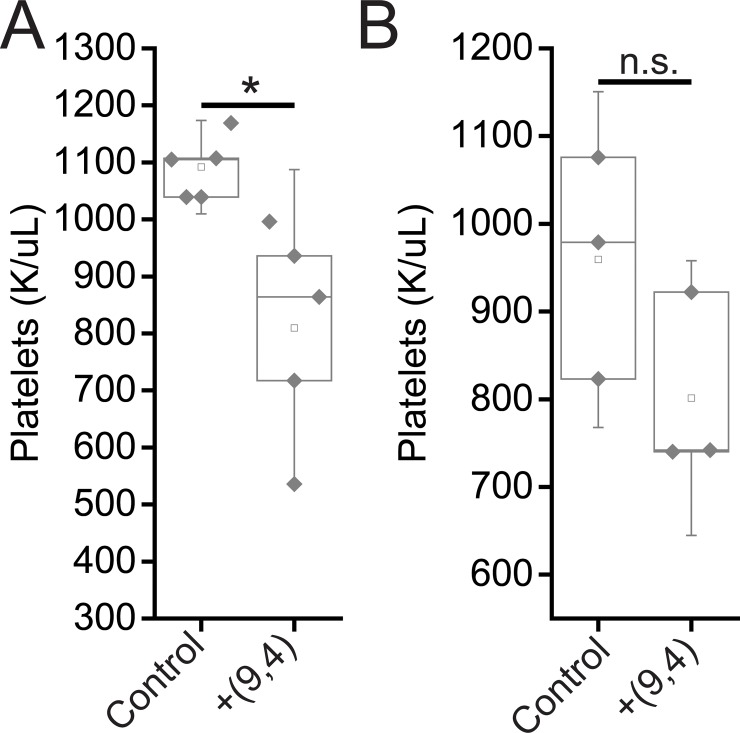
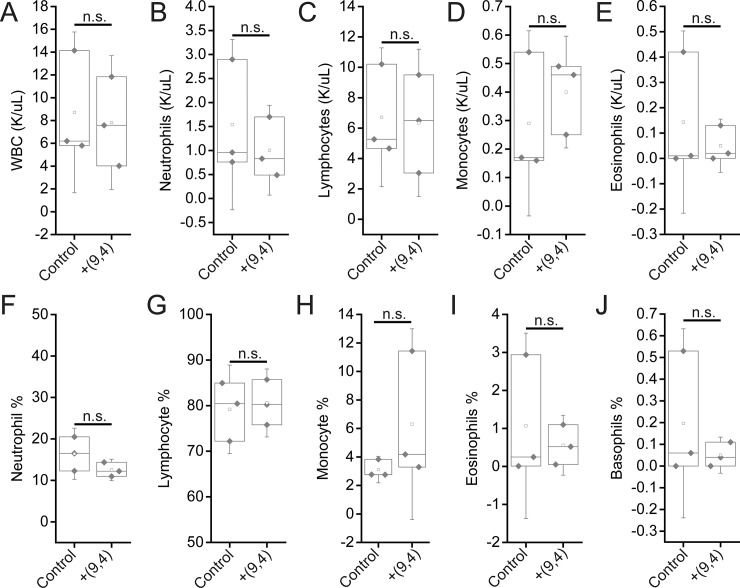
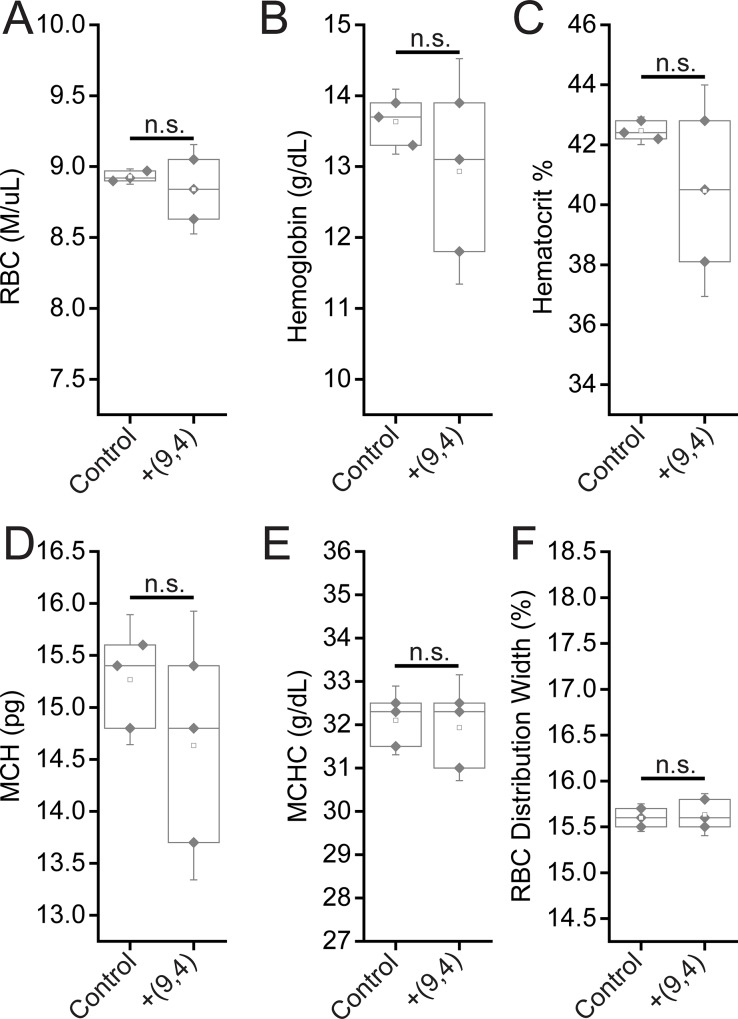
Over the past two decades, measurements of carbon nanotube toxicity and biodistribution have yielded a wide range of results. Properties such as nanotube type (single-walled vs. multi-walled), purity, length, aggregation state, and functionalization, as well as route of administration, greatly affect both the biocompatibility and biodistribution of carbon nanotubes. These differences suggest that generalizable conclusions may be elusive and that studies must be material- and application-specific. Here, we assess the short- and long-term biodistribution and biocompatibility of a single-chirality DNA-encapsulated single-walled carbon nanotube complex upon intravenous administration that was previously shown to function as an in-vivo reporter of endolysosomal lipid accumulation. Regarding biodistribution and fate, we found bulk specificity to the liver and >90% signal attenuation by 14 days in mice. Using near-infrared hyperspectral microscopy to measure single nanotubes, we found low-level, long-term persistence in organs such as the heart, liver, lung, kidney, and spleen. Measurements of histology, animal weight, complete blood count; biomarkers of organ function all suggest short- and long-term biocompatibility. This work suggests that carbon nanotubes can be used as preclinical research tools in-vivo without affecting acute or long-term health.


Conflict of interest statement

D.A.H. is named on a patent filed by MSKCC related to this work (“Composition and method for monitoring lipid”, US patent #10,401,295, issued September 3, 2019). D.A.H. is a cofounder and officer with equity interest of Goldilocks Therapeutics Inc., LipidSense Inc., and Nirova Biosense Inc., as well as a member of the scientific advisory boards of Concarlo Holdings LLC and Nanorobotics Inc. M.A.P. is a cofounder in Repair Ltd. R.E.S. is a member of the scientific advisory board of Miromatrix Inc. This does not alter our adherence to PLOS ONE policies on sharing data and materials.

Figures

Fig 1
Fig 1. Near-infrared spectroscopy of single-species DNA-nanotube complexes in vivo and ex-vivo.
A) Near-infrared fluorescence image of ssCTTC3TTC-(9,4) DNA-SWCNT complexes in-vivo 1 hour after intravenous injection (0.46μg). B) Near-infrared fluorescence images of the ssCTTC3TTC-(9,4) DNA-SWCNT complexes ex-vivo 1 hour after injection. C) Near-infrared emission spectra of ssCTTC3TTC-(9,4) DNA-SWCNT complexes of ex-vivo organs 1-h after injection. D) Near-infrared emission spectra of ssCTTC3TTC-(9,4) DNA-SWCNT complexes measured from the region of the mouse liver in vivo using a fiber optic probe device following intravenous injection into a mouse. E) Normalized integrated intensity of spectra depicted in (D). Error bars are standard deviation from N = 5 mice. ** = P < .01 as measured with a Student’s t-test.
Fig 2
Fig 2. Imaging carbon nanotubes in murine tissues 24 hours after injection.
H&E stains (left) and hyperspectral microscopy images (middle) of various organs 24 hours after intravenous injection with ssCTTC3TTC-(9,4) complexes. Representative fluorescence spectra (right) of the denoted complexes are shown.
Fig 3
Fig 3. Imaging carbon nanotubes in murine tissues one month after injection.
H&E stains (left) and hyperspectral microscopy images (middle) of various organs one month after intravenous injection with ssCTTC3TTC-(9,4) complexes. Representative fluorescence spectra (right) of the denoted complexes are shown.
Fig 4
Fig 4. Imaging carbon nanotubes in murine tissues three months after injection.
H&E stains (left) and hyperspectral microscopy images (middle) of various organs one month after intravenous injection with ssCTTC3TTC-(9,4) complexes. Representative fluorescence spectra (right) of the denoted complexes are shown.
Fig 5
Fig 5. Imaging carbon nanotubes in murine tissues five months after injection.
H&E stains (left) and hyperspectral microscopy images (middle) of various organs one month after intravenous injection with ssCTTC3TTC-(9,4) complexes. Representative fluorescence spectra (right) of the denoted complexes are shown.
Fig 6
Fig 6. Effects of nanotubes on mouse weight.
A) Weight change in mice 24 hours after injection with ssCTTC3TTC-(9,4) complexes or vehicle control (PBS). B) Weight change in mice followed 22 weeks after injection with ssCTTC3TTC-(9,4) complexes or vehicle control (PBS).
Fig 7
Fig 7. Serum chemistry measurements of biomarkers of hepatic injury in mice 24 hours after injection of nanotubes.
Samples were measured 24 hours after injection of PBS (control) or ssCTTC3TTC-(9,4) DNA-nanotube complexes. A) Serum alanine transaminase concentrations (ALT) in mice. B) Serum aspartate transaminase (AST) concentrations in mice. C) Serum alkaline phosphatase (ALP) concentrations in mice. D) Serum carbon dioxide (TCO2) levels in mice. E) Serum albumin (ALB) levels in mice. F) Serum globulin (GLOB) levels in mice. G) Serum ALB:GLOB ratio in mice. H) Serum total protein levels in mice. * = p < .05 as determined with a Student’s two way t-test. N = 5 mice per group.
Fig 8
Fig 8. Serum chemistry measurements of biomarkers of hepatic injury in mice 5 months after injection of nanotubes.
Samples were measured 5 months after injection of PBS (control) or ssCTTC3TTC-(9,4) DNA-nanotube complexes. A) Serum alanine transaminase concentrations (ALT) in mice. B) Serum aspartate transaminase (AST) concentrations in mice. C) Serum alkaline phosphatase (ALP) concentrations in mice. D) Serum carbon dioxide (TCO2) levels in mice. E) Serum albumin (ALB) levels in mice. F) Serum globulin (GLOB) levels in mice. G) Serum ALB:GLOB ratio in mice. H) Serum total protein levels in mice. Statistical significance was determined with a Student’s two way t-test. N = 3 mice per group.
Fig 9
Fig 9. Serum chemistry measurements of biomarkers of renal function in mice 24 hours after injection of nanotubes.
Samples were measured 24 hours after injection of PBS (control) or ssCTTC3TTC-(9,4) DNA-nanotube complexes. A) Blood urea nitrogen (BUN) concentration in mice. B) Serum creatinine (CREA) concentrations in mice. C) Serum BUN:CREA ratios in mice. D) Serum phosphate (P) concentration in mice. E) Serum chloride (Cl) concentrations in mice. F) Serum sodium (Na) concentrations in mice. G) Serum potassium (K) concentration in mice. H) Serum Na:K ratio in mice. I) Serum calcium (Ca) concentration in mice. J) Serum anion gap in mice. * = p < .05 as determined with a Student’s two way t-test. N = 5 mice per group.
Fig 10
Fig 10. Serum chemistry measurements of biomarkers of renal function in mice 5 months after injection of nanotubes.
Samples were measured 5 months after injection of PBS (control) or ssCTTC3TTC-(9,4) DNA-nanotube complexes. A) Blood urea nitrogen (BUN) concentration in mice. B) Serum creatinine (CREA) concentrations in mice. C) Serum BUN:CREA ratios in mice. D) Serum phosphate (P) concentration in mice. E) Serum chloride (Cl) concentrations in mice. F) Serum sodium (Na) concentrations in mice. G) Serum potassium (K) concentration in mice. H) Serum Na:K ratio in mice. I) Serum calcium (Ca) concentrations in mice. J) Serum anioin gap in mice. * = p < .05 as determined with a Student’s two way t-test. N = 3 mice per group.
Fig 11
Fig 11. Measurements of blood inflammatory markers in mice 24 hours after injection of nanotubes.
Samples were measured 24 hours after injection of PBS (control) or ssCTTC3TTC-(9,4) DNA-nanotube complexes. A) White blood cell (WBC) concentration in mouse blood. B) Neutrophil concentration in mouse blood. C) Lymphocyte concentration in mouse blood. D) Monocyte concentration in mouse blood. E) Eosinophil concentrations in mouse blood. F) Neutrophil percentage in mouse blood. G) Lymphocyte percentage in mouse blood. H) Monocyte percentage in mouse blood. I) Eosinophil percentage in mouse blood. J) Basophil percentage in mouse blood. * = p < .05 as determined with a Student’s two way t-test. N = 5 mice per group.
Fig 12
Fig 12. Measurements of blood oxygenation markers in mice 24 hours after injection of nanotubes.
Samples were measured 24 hours after injection of PBS (control) or ssCTTC3TTC-(9,4) DNA-nanotube complexes. A) Red blood cell (RBC) concentration in mouse blood. B) Hemoglobin concentration in mouse blood. C) Hematocrit percentage in mouse blood. D) Mean corpuscular hemoglobin quantity in mouse blood. E) Mean corpuscular hemoglobin concentration in mouse blood. F) Red blood cell (RBC) distribution width. Statistical significance was determined with a Student’s two way t-test. N = 5 mice per group.
Fig 13
Fig 13. Platelet counts in mice 24 hours and 5 months after injection of nanotubes.
Platelet counts were measured 24 hours (A) and 5 months (B) after injection of PBS (control) and ssCTTC3TTC-(9,4) complexes.
Fig 14
Fig 14. Measurements of blood inflammatory markers in mice 5 months after injection of nanotubes.
Samples were measured 5 months after injection of PBS (control) or ssCTTC3TTC-(9,4) DNA-nanotube complexes. A) White blood cell (WBC) concentration in mouse blood. B) Neutrophil concentration in mouse blood. C) Lymphocyte concentration in mouse blood. D) Monocyte concentration in mouse blood. E) Eosinophil concentrations in mouse blood. F) Neutrophil percentage in mouse blood. G) Lymphocyte percentage in mouse blood. H) Monocyte percentage in mouse blood. I) Eosinophil percentage in mouse blood. J) Basophil percentage in mouse blood. Statistical significance was determined with a Student’s two way t-test. N = 3 mice per group.
Fig 15
Fig 15. Measurement of blood oxygenation markers in mice 5 months after injection of nanotubes.
Samples were measured 5 months after injection of PBS (control) or ssCTTC3TTC-(9,4) DNA-nanotube complexes. A) Red blood cell (RBC) concentration in mouse blood. B) Hemoglobin concentration in mouse blood. C) Hematocrit percentage in mouse blood. D) Mean corpuscular hemoglobin quantity in mouse blood. E) Mean corpuscular hemoglobin concentration in mouse blood. F) Red blood cell (RBC) distribution width. Statistical significance was determined with a Student’s two way t-test. N = 3 mice per group.

Similar articles

Cited by

References

    1. Bachilo SM, Strano MS, Kittrell C, Hauge RH, Smalley RE, Weisman RB. Structure-assigned optical spectra of single-walled carbon nanotubes. science. 2002. December 20;298(5602):2361–6. 10.1126/science.1078727 - DOI - PubMed
    1. Lehman JH, Terrones M, Mansfield E, Hurst KE, Meunier V. Evaluating the characteristics of multiwall carbon nanotubes. Carbon. 2011. July 1;49(8):2581–602.
    1. Baughman RH, Zakhidov AA, De Heer WA. Carbon nanotubes—the route toward applications. science. 2002. August 2;297(5582):787–92. 10.1126/science.1060928 - DOI - PubMed
    1. Ong LC, Chung FF, Tan YF, Leong CO. Toxicity of single-walled carbon nanotubes. Archives of toxicology. 2016. January 1;90(1):103–18. 10.1007/s00204-014-1376-6 - DOI - PubMed
    1. Heller DA, Jena P V., Pasquali M, Kostarelos K, Delogu LG, Meidl RE, et al. Banning carbon nanotubes would be scientifically unjustified and damaging to innovation. Nat Nanotechnol. 2020. March 10;15(3):164–6. - PMC - PubMed

Publication types

MeSH terms