. 2020 May 6;15(5):e0232540.
doi: 10.1371/journal.pone.0232540. eCollection 2020.

2.7 Å cryo-EM structure of vitrified M. musculus H-chain apoferritin from a compact 200 keV cryo-microscope

Affiliations

2.7 Å cryo-EM structure of vitrified M. musculus H-chain apoferritin from a compact 200 keV cryo-microscope

Farzad Hamdi et al. PLoS One. .

Abstract

Here we present the structure of mouse H-chain apoferritin at 2.7 Å (FSC = 0.143) solved by single particle cryogenic electron microscopy (cryo-EM) using a 200 kV device, the Thermo Fisher Glacios®. This is a compact, two-lens illumination system with a constant power objective lens, without any energy filters or aberration correctors, often thought of as a "screening cryo-microscope". Coulomb potential maps reveal clear densities for main chain carbonyl oxygens, residue side chains (including alternative conformations) and bound solvent molecules. We used a quasi-crystallographic reciprocal space approach to fit model coordinates to the experimental cryo-EM map. We argue that the advantages offered by (a) the high electronic and mechanical stability of the microscope, (b) the high emission stability and low beam energy spread of the high brightness Field Emission Gun (X-FEG), (c) direct electron detection technology and (d) particle-based Contrast Transfer Function (CTF) refinement have contributed to achieving high resolution. Overall, we show that basic electron optical settings for automated cryo-electron microscopy imaging can be used to determine structures approaching atomic resolution.


Conflict of interest statement

The authors have declared that no competing interests exist.

Figures

Fig 1
Fig 1. Analysis of single-particle cryo-EM structures from EMDB.
(A) On the left, box plot shows the distribution of resolution in all single-particle reconstructions after 2014 and on the right, a bar plot shows the type of specimen reaching resolution better than 3.0 Å; (B) Percentage of structures reaching resolution better than 3.0 Å according to the electron microscope accelerating voltage used to acquire micrographs; (C) A pie chart showing the detector types applied for deriving molecular structures better than 3.0 Å; (D) A box plot showing the distribution of resolution for structures better than 3.0 Å; apoferritin reconstructions are highlighted in blue; (E) A box plot showing the distribution of resolution for apoferritin reconstructions. Dark grey rectangles in (D) and (E) show the confidence intervals at 83%; middle black line shows the average. Data points are shown with circles.
Fig 2
Fig 2. Representative densities during quasi-crystallographic refinement against the cryo-EM Coulomb potential map.
(A) Stereo view demonstrating cryo-EM Coulomb potential map density (blue cage) for carbonyl oxygens (red arrows) in accordance with a nominal resolution of 2.7 Å. The final refined model (PDB code 6SHT) is shown as yellow sticks, with octahedrally symmetry related residues colored lime. (B) Positive difference electron density (Fmap-Fcalc), green, contoured at 2.5σ) after first round of quasi-crystallographic refinement of manually fitted apoferritin monomer superimposed with the final model (yellow / lime sticks). As the initial refinement was based on protein residues alone, the difference density clearly demonstrates the presence of two solvent molecules, also present in the cryo-EM map. These water molecules are also present in the crystal structure (PDB code 3WNW). (C) The initial refinement also exhibited negative difference density (red cage, contoured at -3.5σ) for all carboxylate groups (here Asp171). These atoms (Asp: Cγ, Oδ1 and Oδ2: Glu: Cδ, Oε1 and Oε1) were given an occupancy of zero so that they no longer contribute to structure factor calculations (i.e. set dummy, white / pink atoms). For a number of carboxylate groups including Asp171, the next round of refinement revealed positive difference density (D, green cage contoured at 3.5σ), demonstrating an influence of these atoms on the cryo-EM Coulomb potential. This round of refinement also revealed density for a second conformation of the Lys172 side chain (white sticks).
Fig 3
Fig 3. Image processing of single-particle data after 2D classification and final resolution estimation.
(A) Five (5) 3D classes were initially calculated, reaching resolutions from 4.5 Å to 6.1 Å. (B) Subsequent 3D refinement procedures led to reconstructions of the classes in a resolution range of 3.6 Å to 4.1 Å. (C) Overlap of the final atomic model of mouse apoferritin with the refined Coulomb potential density map. (D) Close-up images along the 4-fold axis of apoferritin at different depths of the protein shell. Coulomb potential densities are recapitulated for the corresponding channel, including a bound iron atom. (E) Fourier shell correlation plot for the final 3D reconstruction shown in (C). At an FSC of a reported correlation value of 0.143, resolution reaches 2.7 Å.
Fig 4
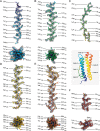
Fig 4. Coulomb potential densities for each secondary structure element of the apoferritin monomer (insert), with individual amino acid residues shown in stick representation.
(A, B, D-F) helices A-E are shown with the fitted model and the corresponding density perpendicular to (top panels) and along (bottom panels) the helix axes. (C) Density and fitted model for loop L.
Fig 5
Fig 5. Comparison of the cryo-EM-derived structure to its crystallographic counterpart.
Note that there are 12 monomers in the crystallographic asymmetric unit, so that comparisons are shown against all. (A) per-residue side-chain root-mean-square deviation (RMSD, Å) for all atoms; backbone atoms show an overall RMSD of 0.395 Å. Residues exhibiting RMSD values > 1.5 Å are highlighted in the plot. (B) Venn diagram showing overlap of solvent molecules derived from the cryo-EM map with those of the crystallographic monomers. (C) overlay of Cα atoms from the cryo-EM model (cyan) and the crystallographic monomers (pink) together with corresponding densities for the solvent. Boxes 1–3 denote positions shown in (D). (D) Comparison of cryo-EM (cyan) and X-ray (pink) models for selected residues with corresponding density/densities.

Similar articles

  • Single-particle cryo-EM at atomic resolution.
    Nakane T, Kotecha A, Sente A, McMullan G, Masiulis S, Brown PMGE, Grigoras IT, Malinauskaite L, Malinauskas T, Miehling J, Uchański T, Yu L, Karia D, Pechnikova EV, de Jong E, Keizer J, Bischoff M, McCormack J, Tiemeijer P, Hardwick SW, Chirgadze DY, Murshudov G, Aricescu AR, Scheres SHW. Nakane T, et al. Nature. 2020 Nov;587(7832):152-156. doi: 10.1038/s41586-020-2829-0. Epub 2020 Oct 21. Nature. 2020. PMID: 33087931 Free PMC article.
  • A new cryo-EM system for single particle analysis.
    Hamaguchi T, Maki-Yonekura S, Naitow H, Matsuura Y, Ishikawa T, Yonekura K. Hamaguchi T, et al. J Struct Biol. 2019 Jul 1;207(1):40-48. doi: 10.1016/j.jsb.2019.04.011. Epub 2019 Apr 13. J Struct Biol. 2019. PMID: 30991102
  • High-resolution single-particle imaging at 100-200 keV with the Gatan Alpine direct electron detector.
    Chan LM, Courteau BJ, Maker A, Wu M, Basanta B, Mehmood H, Bulkley D, Joyce D, Lee BC, Mick S, Czarnik C, Gulati S, Lander GC, Verba KA. Chan LM, et al. J Struct Biol. 2024 Sep;216(3):108108. doi: 10.1016/j.jsb.2024.108108. Epub 2024 Jun 27. J Struct Biol. 2024. PMID: 38944401 Free PMC article.
  • Refinement of Atomic Structures Against cryo-EM Maps.
    Murshudov GN. Murshudov GN. Methods Enzymol. 2016;579:277-305. doi: 10.1016/bs.mie.2016.05.033. Epub 2016 Jun 24. Methods Enzymol. 2016. PMID: 27572731 Review.
  • Frealign: An Exploratory Tool for Single-Particle Cryo-EM.
    Grigorieff N. Grigorieff N. Methods Enzymol. 2016;579:191-226. doi: 10.1016/bs.mie.2016.04.013. Epub 2016 Jun 7. Methods Enzymol. 2016. PMID: 27572728 Free PMC article. Review.

Cited by

References

    1. Kuhlbrandt W. Biochemistry. The resolution revolution. Science. 2014;343(6178):1443–4. Epub 2014/03/29. 10.1126/science.1251652 . - DOI - PubMed
    1. Jiang J, Pentelute BL, Collier RJ, Zhou ZH. Atomic structure of anthrax protective antigen pore elucidates toxin translocation. Nature. 2015;521(7553):545–9. Epub 2015/03/18. 10.1038/nature14247 - DOI - PMC - PubMed
    1. Li X, Mooney P, Zheng S, Booth CR, Braunfeld MB, Gubbens S, et al. Electron counting and beam-induced motion correction enable near-atomic-resolution single-particle cryo-EM. Nat Methods. 2013;10(6):584–90. Epub 2013/05/07. 10.1038/nmeth.2472 - DOI - PMC - PubMed
    1. Bai XC, Yan C, Yang G, Lu P, Ma D, Sun L, et al. An atomic structure of human gamma-secretase. Nature. 2015;525(7568):212–7. Epub 2015/08/19. 10.1038/nature14892 - DOI - PMC - PubMed
    1. de la Rosa-Trevin JM, Quintana A, Del Cano L, Zaldivar A, Foche I, Gutierrez J, et al. Scipion: A software framework toward integration, reproducibility and validation in 3D electron microscopy. J Struct Biol. 2016;195(1):93–9. Epub 2016/04/25. 10.1016/j.jsb.2016.04.010 . - DOI - PubMed

Publication types