. 2020 May 6;15(5):e0232403.
doi: 10.1371/journal.pone.0232403. eCollection 2020.

Novel multi-energy X-ray imaging methods: Experimental results of new image processing techniques to improve material separation in computed tomography and direct radiography

Affiliations

Novel multi-energy X-ray imaging methods: Experimental results of new image processing techniques to improve material separation in computed tomography and direct radiography

Mirko Heckert et al. PLoS One. .

Abstract

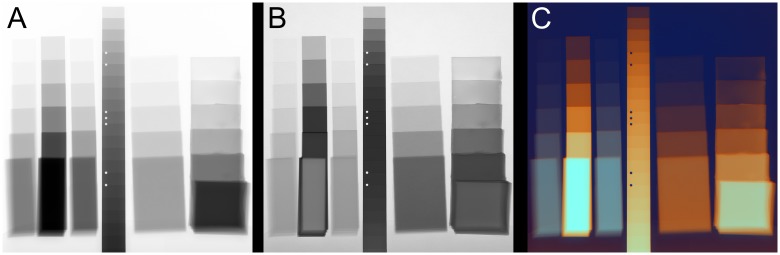
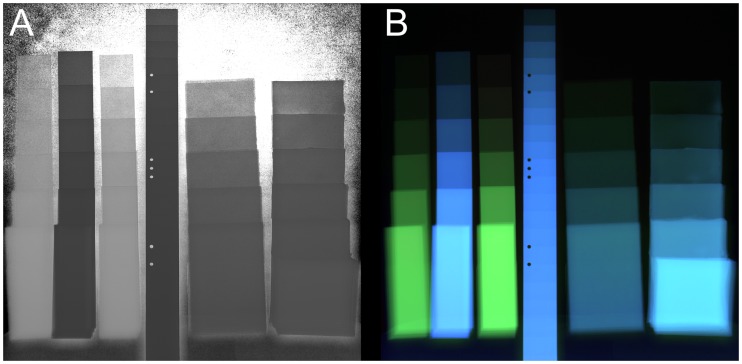
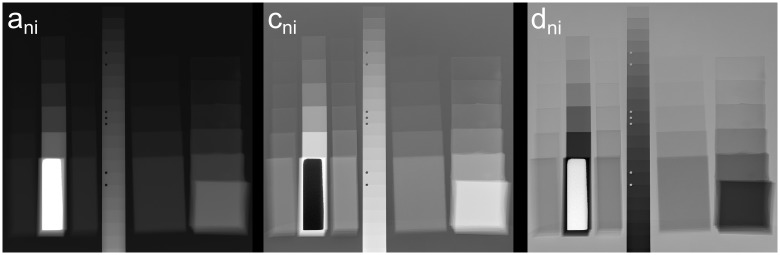
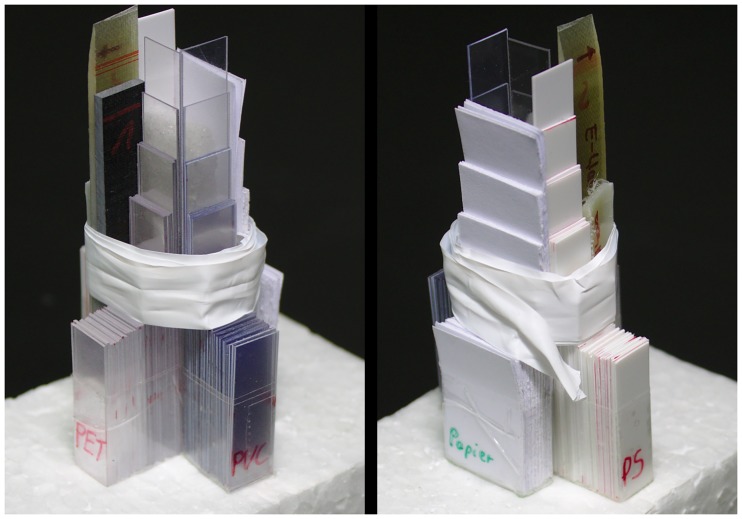
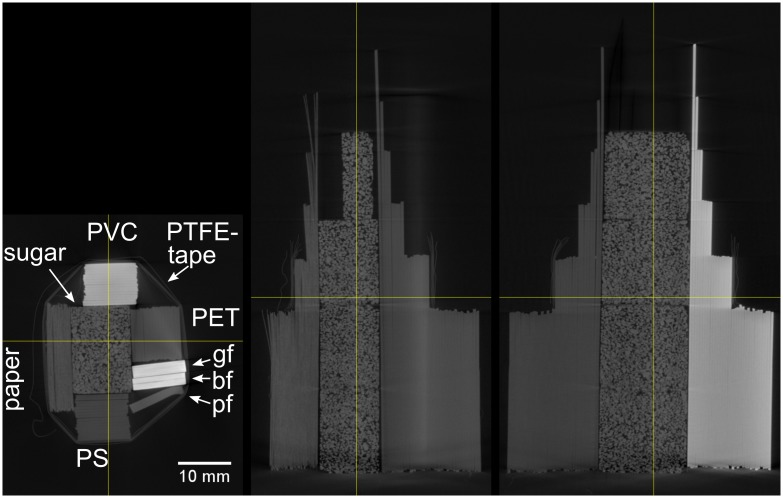
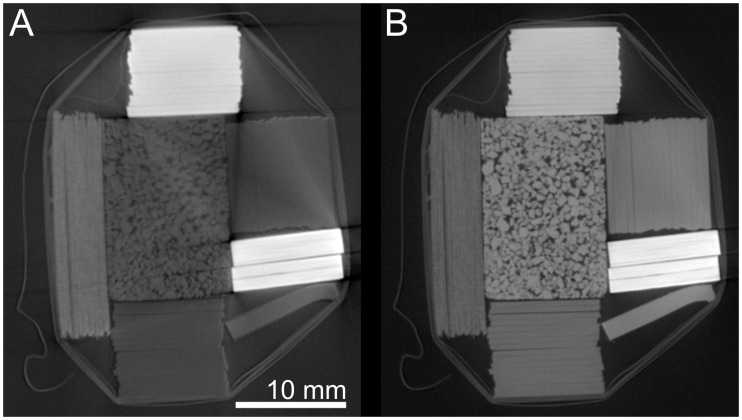
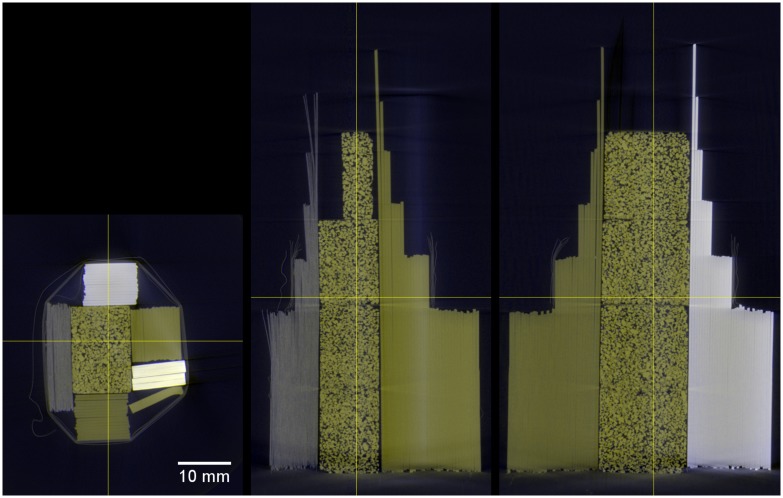
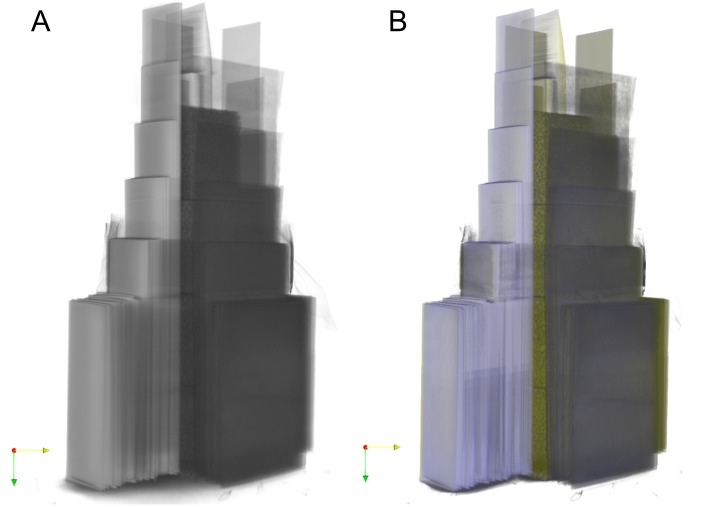
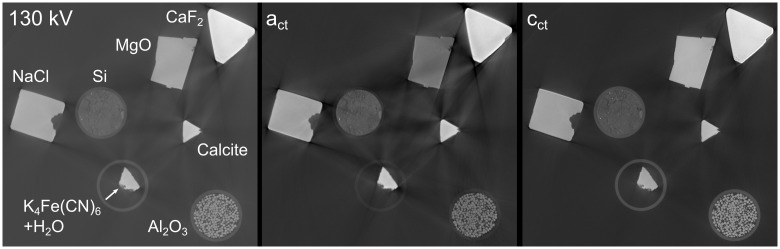
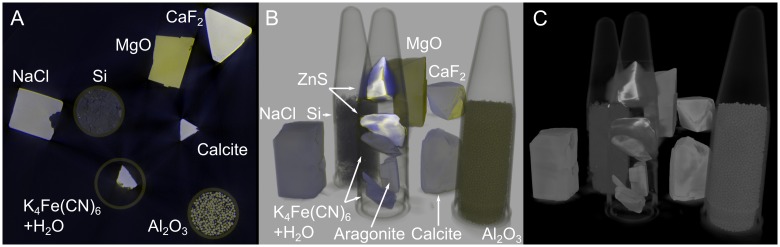
We present novel multi-energy X-ray imaging methods for direct radiography and computed tomography. The goal is to determine the contribution of thickness, mass density and atomic composition to the measured X-ray absorption in the sample. Algorithms have been developed by our own to calculate new X-ray images using data from an unlimited amount of scans/images of different tube voltages by pixelwise fitting of the detected gray levels. The resulting images then show a contrast that is influenced either by the atomic number of the elements in the sample (photoelectric interactions) or by the mass density (Compton scattering). For better visualization, those images can be combined to a color image where different materials can easily be distinguished. In the case of computed tomography no established true multi-energy methodology that does not require an energy sensitive detector is known to the authors. The existing dual-energy methods often yield noisy results that need spatial averaging for clear interpretation. The goal of the method presented here is to qualitatively calculate atomic number and mass density images without loosing resolution while reducing the noise by the use of more than two X-ray energies. The resulting images are generated without the need of calibration stan-dards in an automatic and fast data processing routine. They provide additional information that might be of special interest in cases like archaeology where the destruction of a sample to determine its composition is no option, but a increase in measurement time is of little concern.


Conflict of interest statement

The authors have declared that no competing interests exist.

Figures

Fig 1
Fig 1. Simulated X-ray transmission for different materials.
Open symbols represent a thickness of 5 mm, filled symbols 1 mm. The absorption coefficients are taken from [3] and the tube spectra have been simulated according to [4].
Fig 2
Fig 2. Gray value vs X-ray tube voltage after CT reconstruction.
The gray values have been extracted from reconstructed CT slices at different regions of the sample shown in Fig 8. This corresponds to different materials. The data in the right plot is fitted with: W(U)=eactU2+0.01actU1+cct.
Fig 3
Fig 3. Intensity vs X-ray tube voltage for direct radiography.
Gray levels of PS, paper, PVC and aluminum samples at different thicknesses (in mm) and the background. Data in the left plot is normalized with tube current and detector integration time fitted with Eq 5. In the right plot the data is additionally normalized with the square of the tube voltage and fitted with a cubic function.
Fig 4
Fig 4. Multi-energy fit parameters represented as gray levels.
Four coefficients (adr, bdr, cdr, ddr) of a 3rd degree polynomial fit of a multi-energy image series of PS, PVC, PET, aluminum, paper and silicone from 40-190 kV.
Fig 5
Fig 5. Comparison of single- and multi-energy radiographs.
A: Conventional radiography of PS, PVC, PET, aluminum, paper and silicone samples at 100 kV showing thickness-dominated contrast; B: multi-energy image (coefficients cdr + ddr) showing material contrast; C: color representation of the calculated coefficients showing material and thickness contrast.
Fig 6
Fig 6. Dual-energy calculation (logarithmic transparency quotient) from the 50 kV and 100 kV radiographs.
A: grayscale output of the dual-energy calculation. B: colored representation using the dual-energy data as hue and saturation channel and the 100 kV image as intensity.
Fig 7
Fig 7. Results of the numeric fit of the integral in Eq 1.
Fitting parameters of the term μaniEbni+cnifKN(E)+dni represented as grayscale images. Parameter bni is fixed to −3.
Fig 8
Fig 8. Sample for multi-energy CT.
PET, PS, PVC and paper wedge samples with strips of glass-, basalt- and polyester-fiber in epoxy around sugar cubes wrapped together with PTFE-tape.
Fig 9
Fig 9. Cross sections of a conventional CT reconstruction of the sample shown in Fig 8.
Recorded at 90 kV, abbreviations of sample materials represent gf: glass fiber; bf: basalt fiber; pf: polyester fiber.
Fig 10
Fig 10. Resulting grayscale images from a multi-energy reconstruction.
Parameters from the fit function W(U)=eactU2+0.01actU1+cct represented as gray levels. A: parameter act, B: parameter cct.
Fig 11
Fig 11. Cross sections of a multi-energy CT reconstruction of the sample shown in Fig 8.
Parameter act is mapped as blue and cct as yellow.
Fig 12
Fig 12. 3D representations of the samples shown in Fig 8.
A: single-energy reconstruction at 90 kV. B: colored multi-energy reconstruction.
Fig 13
Fig 13. Slices from a single- and multi-energy reconstruction of mineral samples.
Measured with a 2.5 mm Al filter.
Fig 14
Fig 14
Slice (A) and 3D rendering (B) of a multi-energy reconstruction of the mineral samples with single-energy grayscale rendering (C) for comparison. Measured with a 2.5 mm Al filter, grayscale 3D rendering with scatter renderer of the software VG-Studio [17] (130 kV), colored multi-energy rendering with the software ParaView [15].

References

    1. Alvarez RE, Macovski A. Energy-selective reconstructions in X-ray computerised tomography. Physics in Medicine and Biology. 1976;21(5):733–744. 10.1088/0031-9155/21/5/002 - DOI - PubMed
    1. Rebuffel V, Tartare M, Brambilla A, Moulin V, Verger L. Multi-energy X-ray Techniques for NDT: a New Challenge. 11th European Conference on Non-destructive Testing. 2014.
    1. Hubbell JH, Seltzer SM. Tables of X-Ray Mass Attenuation Coefficients and Mass Energy-Absorption Coefficients from 1 keV to 20 MeV for Elements Z = 1 to 92 and 48 Additional Substances of Dosimetric Interest. NIST Standard Reference Database 126.
    1. Kramers HA. XCIII. On the theory of X-ray absorption and of the continuous X-ray spectrum. The London, Edinburgh, and Dublin Philosophical Magazine and Journal of Science. 1923;46(275).
    1. Maitrejean S, Perion D, Sundermann D. Non destructive chemical identification using an X-ray transmission function with the multi-energy method. Proceedings of SPIE. 1998;3446.

Publication types

MeSH terms