. 2020 May 6;15(5):e0232528.
doi: 10.1371/journal.pone.0232528. eCollection 2020.

Multifaceted analysis of training and testing convolutional neural networks for protein secondary structure prediction

Affiliations

Multifaceted analysis of training and testing convolutional neural networks for protein secondary structure prediction

Maxim Shapovalov et al. PLoS One. .

Abstract

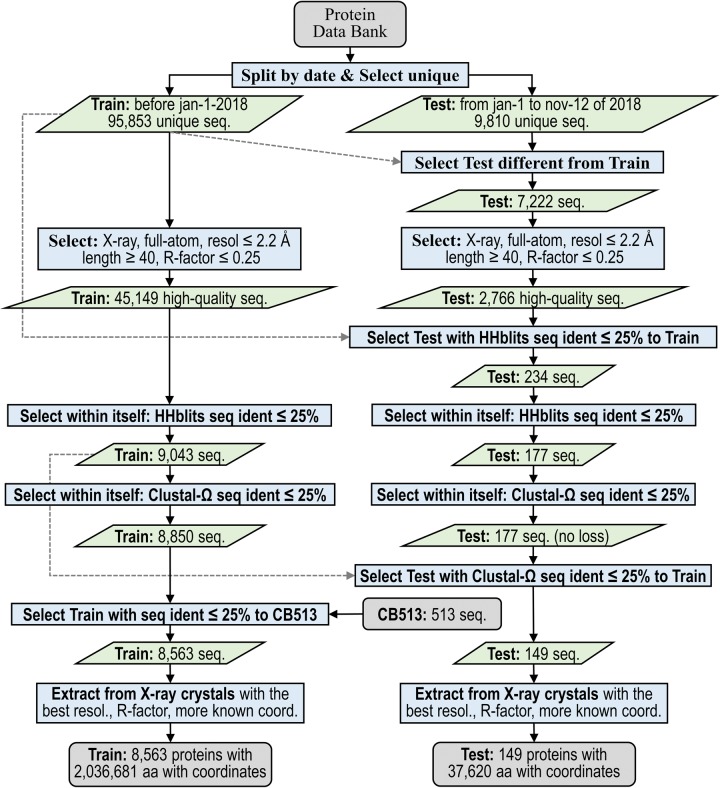
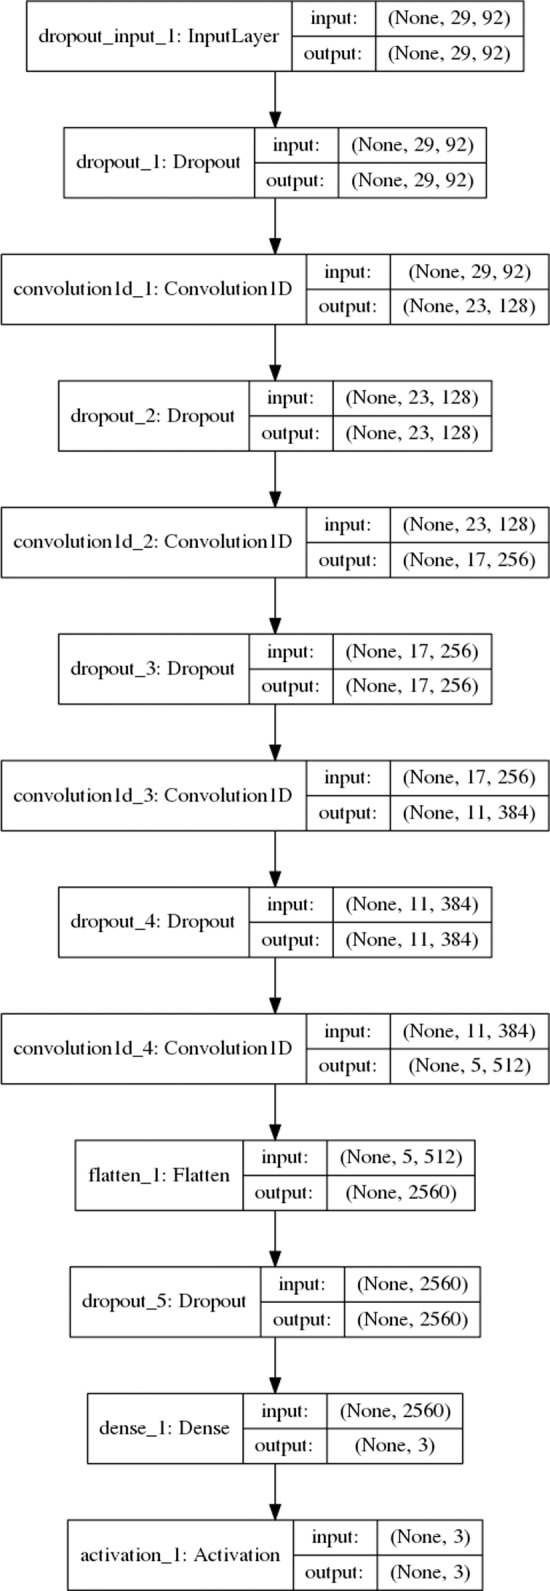
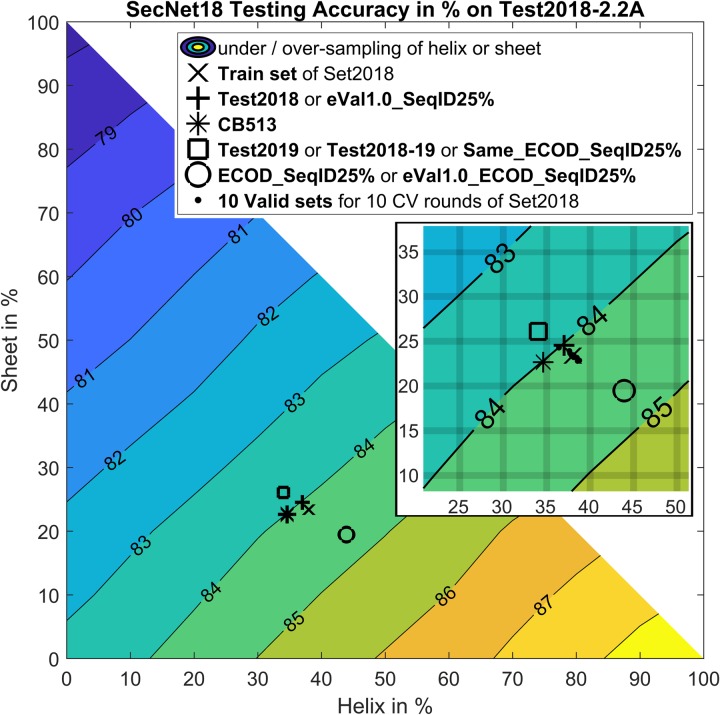
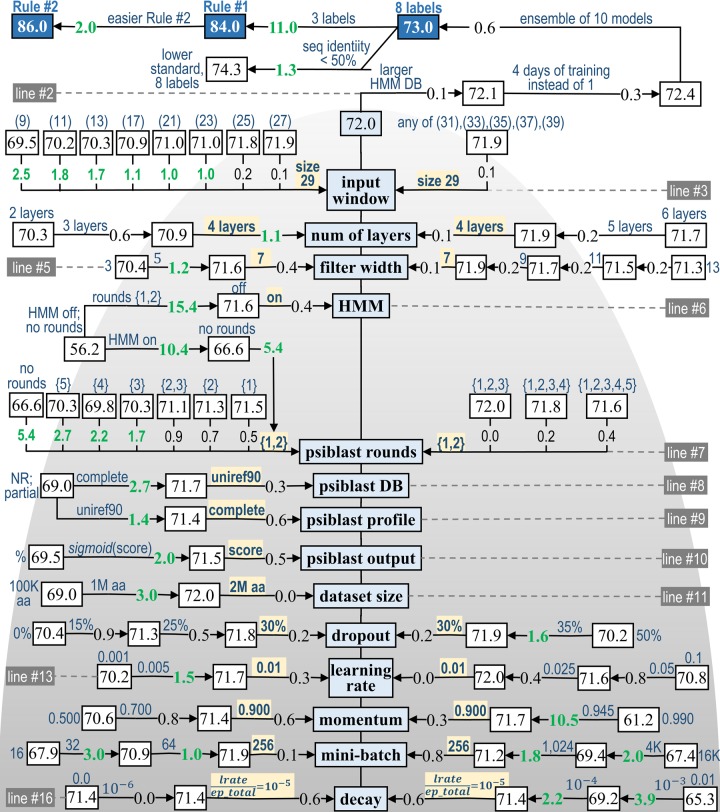
Protein secondary structure prediction remains a vital topic with broad applications. Due to lack of a widely accepted standard in secondary structure predictor evaluation, a fair comparison of predictors is challenging. A detailed examination of factors that contribute to higher accuracy is also lacking. In this paper, we present: (1) new test sets, Test2018, Test2019, and Test2018-2019, consisting of proteins from structures released in 2018 and 2019 with less than 25% identity to any protein published before 2018; (2) a 4-layer convolutional neural network, SecNet, with an input window of ±14 amino acids which was trained on proteins ≤25% identical to proteins in Test2018 and the commonly used CB513 test set; (3) an additional test set that shares no homologous domains with the training set proteins, according to the Evolutionary Classification of Proteins (ECOD) database; (4) a detailed ablation study where we reverse one algorithmic choice at a time in SecNet and evaluate the effect on the prediction accuracy; (5) new 4- and 5-label prediction alphabets that may be more practical for tertiary structure prediction methods. The 3-label accuracy (helix, sheet, coil) of the leading predictors on both Test2018 and CB513 is 81-82%, while SecNet's accuracy is 84% for both sets. Accuracy on the non-homologous ECOD set is only 0.6 points (83.9%) lower than the results on the Test2018-2019 set (84.5%). The ablation study of features, neural network architecture, and training hyper-parameters suggests the best accuracy results are achieved with good choices for each of them while the neural network architecture is not as critical as long as it is not too simple. Protocols for generating and using unbiased test, validation, and training sets are provided. Our data sets, including input features and assigned labels, and SecNet software including third-party dependencies and databases, are downloadable from dunbrack.fccc.edu/ss and github.com/sh-maxim/ss.


Conflict of interest statement

The authors have declared that no competing interests exist.

Figures

Fig 1
Fig 1. Protocol flowchart for preparation of 2018 unbiased test and training sets (Set2018 dataset).
Protocol input and output are shown with gray rounded rectangles. All action processes are in blue rectangles. Green parallelograms represent intermediate input and output data. The split date for Set2018 training and test sets is Jan 1, 2018. By using two sequence alignment programs, the protocol removes from the test set any proteins with more than 25% sequence identity to any previously published PDB structure of any experimental type, resolution, or quality. The test set guarantees unbiased accuracy estimation for our prediction method, SecNet, and any previous software trained and validated on proteins released before Jan 1, 2018.
Fig 2
Fig 2. Architecture of SecNet.
SecNet is a traditional CNN with an input layer, 4 hidden convolutional layers, and a dense layer with dropout regularization layers in between. The input layer reads a 29 x 92 matrix representing a sequence window of 29 amino acids centered on the one subject to prediction and 92 input features for all 29 positions. 92 features = one-hot encoding of 22 amino-acid types + 2 rounds x 20 PSI-BLAST profile values + 30 HMM alignment parameters. Each box encloses a linear dimensionality and number of features (2nd and 3rd values in parentheses) in input and output of each layer. The total number of parameters to train is about 2 million. The activation layer returns 3 probabilities for the 3 labels: H, E, and C of the central amino acid which are calculated with a softmax activation function. The label with the highest estimated probability is the predicted label.
Fig 3
Fig 3. Variation of 3-label Rule #1 accuracy as a function of proportions of helix (H%), sheet (E%) and coil (C% = 100%–H%E%) in Test2018 test set.
The Rule #1 accuracy of SecNet on Test2018 test set is 84.0% and shown with ‘+’. The contour plot demonstrates how SecNet prediction accuracy can be skewed if a test set is enriched or diluted with helix and/or sheet. For example, if the underlying test set has 100% helices, the accuracy rises to 88.7% (bottom right). If it is 100% sheet, the accuracy drops to 77.6% (top left). If it is 100% coil, the accuracy is 83.4% (bottom left). The extrapolated SecNet accuracies are indicated for the label proportions of Set2018 training set with ‘x’, CB513 test set with ‘*’ and ten validation sets for each cross-validation round of Set2018 with ten ‘.’. eVal1.0_SeqID25% has label frequencies almost identical to Test2018 and shares ‘+’. For the same reason Test2019, Test2018-19 and Same_ECOD_SeqID25% share ‘□’ while ECOD_SeqID25% and eVal1.0_ECOD_SeqID25% are shown with ‘o’. The differences in extrapolated accuracies of these sets call for adjustment of the actual accuracies (“Raw values” in Table 9) to the accuracies with the same label proportions (“Adj. to Test2018” in Table 9).
Fig 4
Fig 4. Ablation study of Test2018 accuracy of SecNet.
Accuracy is presented as a function of factors (blue boxes in the middle) from 3 groups: 1) NN architecture and complexity (top); 2) input features and databases (center); and 3) hyper-parameters of the training pipeline (bottom). The test accuracies displayed in black uncover unbiased estimates for publication purposes after all choices of the final model parameters were made; the validation set was used to make these choices of hyper-parameters using our optimization strategy. Lines 1–2: Actions such as “4-day training” or “ensemble of 10 cross-validated models” led to further improvement. Line 1: The accuracy increases with switch of 8→3 labels by replacing a harder Rule #1 to easier Rule #2 and with a weaker 25%→50% maximal sequence identity between the test and training sets. Each arrow indicates a direction of favorable parameter change and embeds associated accuracy gain. Parameter values are in blue. The optimal parameter values are highlighted in yellow and shown in the middle with smaller and larger values on the left and right. The cumulative effect from multiple changes of the same hyper-parameter is a sum of individual accuracy increments (in black). Stronger effects (≥1 point) are shown in green. The accuracy is a non-linear function of hyper-parameters; an effect from a change of multiple hyper-parameters is not the sum of the accuracy increments associated with the different hyper-parameter changes while the remaining parameters are fixed.

Similar articles

Cited by

References

    1. Yang Y, Gao J, Wang J, Heffernan R, Hanson J, Paliwal K, et al. Sixty-five years of the long march in protein secondary structure prediction: the final stretch? Brief Bioinform. 2018;19(3):482–94. Epub 2017/01/04. 10.1093/bib/bbw129 - DOI - PMC - PubMed
    1. Kabsch W, Sander C. Dictionary of protein secondary structure: pattern recognition of hydrogen-bonded and geometrical features. Biopolymers. 1983;22(12):2577–637. Epub 1983/12/01. 10.1002/bip.360221211 . - DOI - PubMed
    1. Fischer D, Eisenberg D. Protein fold recognition using sequence-derived predictions. Protein Sci. 1996;5(5):947–55. Epub 1996/05/01. 10.1002/pro.5560050516 - DOI - PMC - PubMed
    1. Skolnick J, Kihara D, Zhang Y. Development and large scale benchmark testing of the PROSPECTOR_3 threading algorithm. Proteins. 2004;56(3):502–18. Epub 2004/07/02. 10.1002/prot.20106 . - DOI - PubMed
    1. Rohl CA, Strauss CE, Misura KM, Baker D. Protein structure prediction using Rosetta. Methods Enzymol. 2004;383:66–93. Epub 2004/04/06. 10.1016/S0076-6879(04)83004-0 . - DOI - PubMed

Publication types