. 2020 Jul 1;176(1):175-192.
doi: 10.1093/toxsci/kfaa059.

Respirometric Screening and Characterization of Mitochondrial Toxicants Within the ToxCast Phase I and II Chemical Libraries

Affiliations

Respirometric Screening and Characterization of Mitochondrial Toxicants Within the ToxCast Phase I and II Chemical Libraries

Daniel R Hallinger et al. Toxicol Sci. .

Abstract

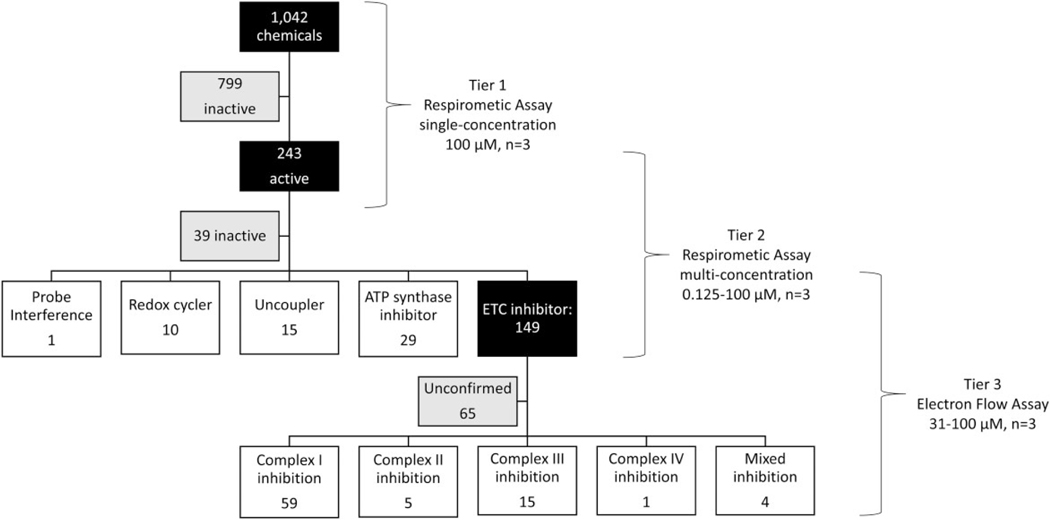
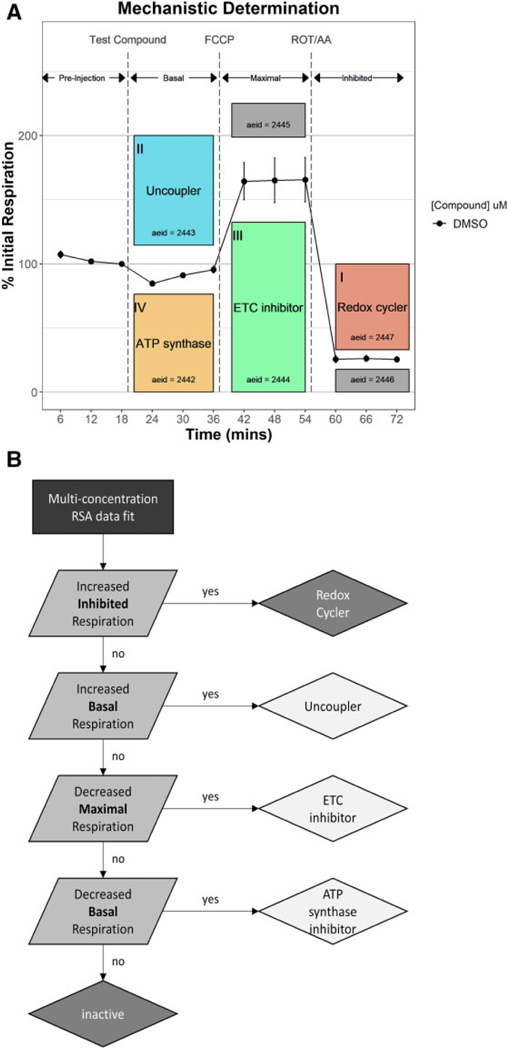
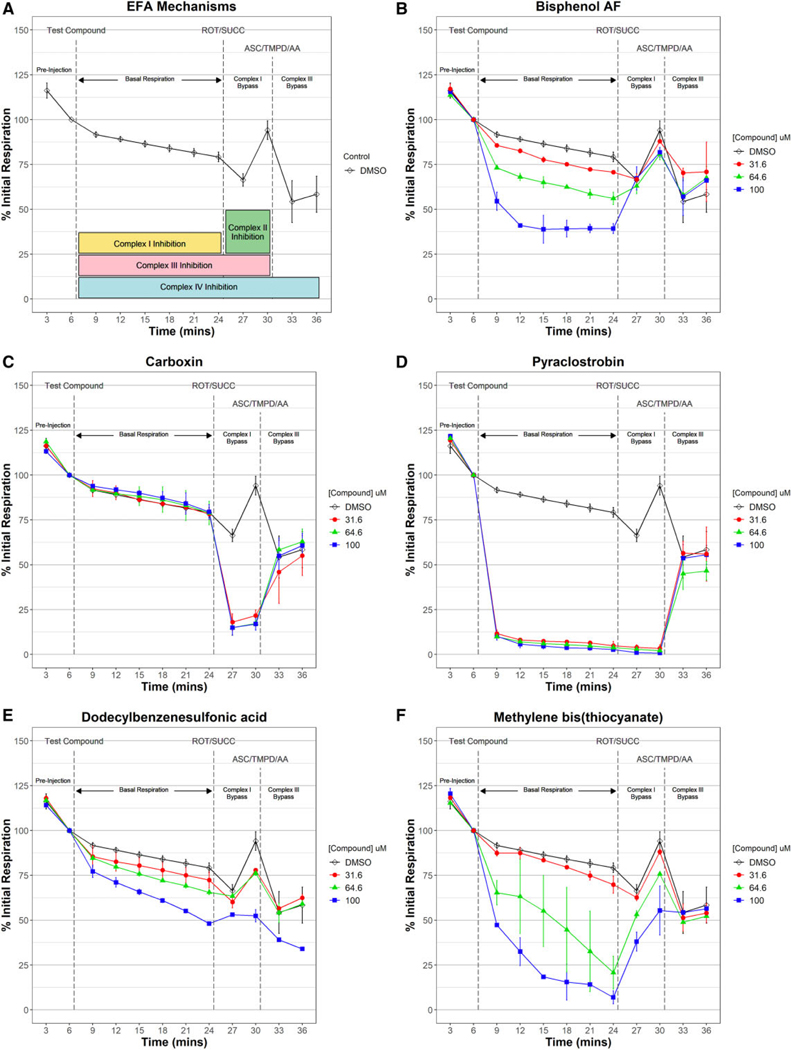
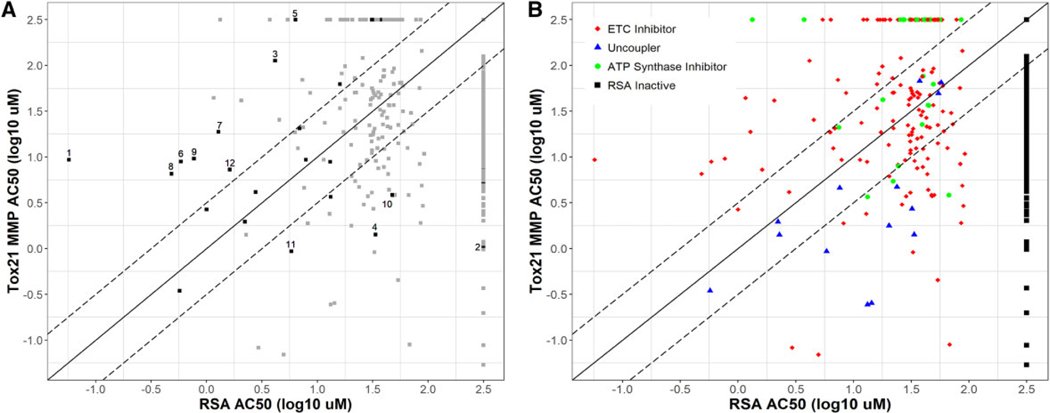
Mitochondrial toxicity drives several adverse health outcomes. Current high-throughput screening assays for chemically induced mitochondrial toxicity typically measure changes to mitochondrial structure and may not detect known mitochondrial toxicants. We adapted a respirometric screening assay (RSA) measuring mitochondrial function to screen ToxCast chemicals in HepG2 cells using a tiered testing strategy. Of 1042 chemicals initially screened at a singlemaximal concentration, 243 actives were identified and rescreened at 7 concentrations. Concentration-response data for 3 respiration phases confirmed activity and indicated a mechanism for 193 mitochondrial toxicants: 149 electron transport chain inhibitors (ETCi), 15 uncouplers and 29 adenosine triphosphate synthase inhibitors. Subsequently, an electron flow assay was used to identify the target complex for 84 of the 149 ETCi. Sixty reference chemicals were used to compare the RSA to existing ToxCast and Tox21 mitochondrial toxicity assays. The RSA was most predictive (accuracy = 90%) of mitochondrial toxicity. The Tox21 mitochondrial membrane potential assay was also highly predictive (accuracy = 87%) of bioactivity but underestimated the potency of well-known ETCi and provided no mechanistic information. The tiered RSA approach accurately identifies and characterizes mitochondrial toxicants acting through diverse mechanisms and at a throughput sufficient to screen large chemical inventories. The electron flow assay provides additional confirmation and detailed mechanistic understanding for ETCi, the most common type of mitochondrial toxicants among ToxCast chemicals. The mitochondrial toxicity screening approach described herein may inform hazard assessment and the in vitro bioactive concentrations used to derive relevant doses for screening level chemical assessment using new approach methodologies.

Keywords: Seahorse; ToxCast; electron transport chain; high-throughput screening; mechanism; mitochondria; new approach methodologies; oxidative phosphorylation; respiration; uncoupling.


Conflict of interest statement

DECLARATION OF CONFLICTING INTERESTS

The authors declared no potential conflicts of interest with respect to the research, authorship, and/or publication of this article.

Figures

Figure 1.
Figure 1.
Tiered testing strategy to identify and characterize mitochondrial toxicants. A respirometric screening assay (RSA) was used to test 1042 ToxCast Phase I/II chemicals at singlemaximal concentration resulting in 249 active and 799 inactive test chemicals (Tier 1). The 249 Tier 1 actives were rescreened in the RSA at 7 titrated concentrations (Tier 2). Tier 2 data was fit using the ToxCast pipeline and actives from specific respiratory phased used to mechanistic classify each chemical. A total of 193 mitochondrial toxicants were identified using Tier 2 data. The 149 electron transport chain (ETC) inhibitors identified in Tier 2 were evaluated in an electron flow assay (EFA) at 3 titrated concentrations. EFA data used to identify the targeted ETC complex(es) for 84 chemicals. Abbreviation: ATP, adenosine triphosphate.
Figure 2.
Figure 2.
Tier 1 respirometric screening assay temporal response examples. Oxygen consumption was measured in HepG2 cells for 3 3-min cycles during a preinjection phase to establish and initial respiration rate used to normalize data across 3 respiration phases: basal respiration following injection of controls or test compound, maximal respiration following the injection of the uncoupler carbonyl cyanide-p-(trifluoromethoxy) phenylhydrazone (FCCP), and inhibited respiration following the injection of electron transport chain inhibitors rotenone (ROT) and antimycin A (AA). Median % initial respiration ± mad for triplicate experiments are plotted. Global dimethyl sulfoxide (DMSO) controls are plotted in black. Test chemicals are plotted in blue. Global 20% (for basal and maximal phases) and 30% (inhibited phase) thresholds are plotted by red lines and approximate the thresholds used, which were calculated independently for each sample plate. Supplementary Table 2 lists all 1042 ToxCast chemicals tested in this study with the maximal test concentration used and respirometric screening assay activity determination. Abbreviation: MEHP, mono(2-ethylhexyl) phthalate.
Figure 3.
Figure 3.
Ranked median Tier 1 respirometric screening assay responses of 1042 test chemicals. Median fold changes for triplicate experiments are ranked from lowest (decreased respiration) to highest (increased respiration) for each of 1042 test chemicals for basal respiration (A), maximal respiration (B), and inhibited respiration (C). Tier 1 responses were normalized and zero-centered to DMSO control (blue line). Red dotted lined mark the thresholds used to define active chemicals (black dots) in each respiration phase.
Figure 4.
Figure 4.
Tier 2 respirometric screening assay temporal dose-response patterns. Two hundred and forty-nine Tier 1 active chemicals were retested in the respirometric screening assay at 7 titrated concentrations to derive potency estimates and assign a putative mechanism of action. Rotenone (A) and fenamiphos (B) are examples of potent and weak electron transport chain inhibitors decreasing maximal phase respiration. mono(2-ethylhexyl) phthalate (MEHP) (C) exemplifies the response pattern of an adenosine triphosphate synthase inhibitor where basal phase respiration is inhibited but not maximal respiration. Dinoseb (D) and 2,4,6-trichlorophenol (E) are examples of potent and weak uncouplers which increase basal phase respiration. Redox-cycling chemicals like 9-phenanthrol (F) increase inhibited phase respiration indicating nonmitochondrial oxygen consumption. Gentian violet (G) elicited a decrease in signal below that of blank (no cell) controls, indicating probe interference. Mechanisms of mitochondrial toxicity (H) were assigned from Tier 2 data using a step-wise classification scheme involving only 4 of the 6 Tier 2 assay endpoints (colored boxes). The temporal dose-response patterns for the 243 Tier 2 test chemicals are provided in Supplementary Figure 2. Abbreviations: AA, antimycin A; DMSO, dimethyl sulfoxide; ETC, electron transport chain; FCCP, carbonyl cyanide-p-(trifluoromethoxy) phenylhydrazone; ROT, rotenone.
Figure 5.
Figure 5.
Mechanistic assignment using Tier 2 data. Mechanisms of mitochondrial toxicity were assigned using 4 of the 6 Tier 2 assay endpoints (A; colored boxes). A rule set (B) was established that sequentially classified active chemicals as redox cyclers (false positives), uncouplers, electron transport chain inhibitors, or adenosine triphosphate (ATP) synthase inhibitors based a Tier 2 bioactivity response patterns. Abbreviations: AA, antimycin A; DMSO, dimethyl sulfoxide; FCCP, carbonyl cyanide-p-(trifluoromethoxy) phenylhydrazone; ROT, rotenone.
Figure 6.
Figure 6.
Electron flow assay to determine complex(es) targeted by electron transport chain (ETC) inhibitors. Oxygen consumption was measured in permeabilized and fully uncoupled HepG2 cells supplied with pyruvate and malate during a preinjection phase used to normalize data across 3 respiration phases: basal respiration following injection of controls or test ETC inhibitor, complex I bypass respiration following the injection of the complex I inhibitor rotenone (ROT) and complex II substrate succinate (SUCC), and complex III bypass respiration following the injection of complex III inhibitor antimycin A (AA) and complex IV substrates ascorbate (ASC) and N,N,N′,N′-tetramethyl-p-phenylenediamine (TMPD). Median % initial respiration ± mad for triplicate experiments are plotted. Global dimethyl sulfoxide (DMSO) controls are plotted in black. All ETCi were tested at 3 titrated concentrations. The temporal dose-response patterns for all 149 ETC inhibitors tested in the electron flow assay (EFA) are provided in Supplementary Figure 3. Chemicals that inhibited respiration during the basal phase only but recovered with succinate (A, yellow) like bisphenol B (B) were classified as complex I inhibitors. Those that inhibited respiration during the complex I bypass phase only but recovered with ASC/TPMD (A, green) like carboxin (C) were classified as complex II inhibitors. Chemicals that inhibited respiration during both basal and complex I bypass phases but recovered with ASC/ TPMD (A, pink) like pyraclostrobin (D) were classified as complex III inhibitors. Inhibition of respiration during all 3 phases (A, blue) as observed with dodecylbenzene-sulfonic acid (E) was classified as complex IV inhibitors. Chemicals that inhibited respiration during the basal phase and only partially recovered with succinate and fully with ASC/TPMD like methylene bis(thiocyanate) (F) were classified as mixed complex I/III inhibitors.
Figure 7.
Figure 7.
Comparison of potency estimates from respirometric screening assay (RSA) and Tox21 MMP assays. Comparison of potency (log AC50 values) estimates derived from the RSA (x-axis) and Tox21 MMP assay (y-axis). Chemicals tested as inactive in the RSA are plotted along the right and those tested as inactive in the Tox21 MMP assay are plotted along the top. The solid black diagonal line denoted equal potency across the 2 assays and the dashed black diagonal lines half-log potency differences between the 2 assays. A, The 60 reference chemicals used to evaluate assay performance are represented as black dots. Gray dots represent the 984 other chemicals tested in this study. Examples are highlighted and ordered by absolute difference in log AC50 values: (1) rotenone, (2) quercetin, (3) fluoxastrobin, (4) 2,4-dintirophenol (5) azoxystrobin, (6) pyridaben, (7) picoxystrobin, (8) tebufenpyrad, (9) fenpyroximate, (10) mercuric chloride, (11) 2-methyl-4,6,-dinitrophenol, and (12) pyraclostrobin. B, Test chemicals (1042) plotted by RSA-assigned mechanisms. Chemicals tested as inactive in the RSA (black dots) are plotted along the right.

Similar articles

Cited by

References

    1. Alonso JR, Cardellach F, López S, Casademont J, and Miró O. (2003). Carbon monoxide specifically inhibits cytochrome c oxidase of human mitochondrial respiratory chain. Pharmacol. Toxicol 93, 142–146. - PubMed
    1. Attene-Ramos MS, Huang R, Michael S, Witt KL, Richard A, Tice RR, Simeonov A, Austin CP, and Xia M. (2015). Profiling of the Tox21 chemical collection for mitochondrial function to identify compounds that acutely decrease mitochondrial membrane potential. Environ. Health Perspect 123, 49–56. - PMC - PubMed
    1. Attene-Ramos MS, Huang R, Sakamuru S, Witt KL, Beeson GC, Shou L, Schnellmann RG, Beeson CC, Tice RR, Austin CP, et al. (2013). Systematic study of mitochondrial toxicity of environmental chemicals using quantitative high throughput screening. Chem. Res. Toxicol 26, 1323–1332. - PMC - PubMed
    1. Baker N, Knudsen T, and Williams A. (2017). Abstract Sifter: A comprehensive front-end system to PubMed. F1000Research 6, 2164. - PMC - PubMed
    1. Balba H. (2007). Review of strobilurin fungicide chemicals. J. Environ. Sci. Health B 42, 441–451. - PubMed

Publication types

Substances