. 2020 Jun 1;12(6):842-859.
doi: 10.1093/gbe/evaa088.

Ampliconic Genes on the Great Ape Y Chromosomes: Rapid Evolution of Copy Number but Conservation of Expression Levels

Affiliations

Ampliconic Genes on the Great Ape Y Chromosomes: Rapid Evolution of Copy Number but Conservation of Expression Levels

Rahulsimham Vegesna et al. Genome Biol Evol. .

Abstract

Multicopy ampliconic gene families on the Y chromosome play an important role in spermatogenesis. Thus, studying their genetic variation in endangered great ape species is critical. We estimated the sizes (copy number) of nine Y ampliconic gene families in population samples of chimpanzee, bonobo, and orangutan with droplet digital polymerase chain reaction, combined these estimates with published data for human and gorilla, and produced genome-wide testis gene expression data for great apes. Analyzing this comprehensive data set within an evolutionary framework, we, first, found high inter- and intraspecific variation in gene family size, with larger families exhibiting higher variation as compared with smaller families, a pattern consistent with random genetic drift. Second, for four gene families, we observed significant interspecific size differences, sometimes even between sister species-chimpanzee and bonobo. Third, despite substantial variation in copy number, Y ampliconic gene families' expression levels did not differ significantly among species, suggesting dosage regulation. Fourth, for three gene families, size was positively correlated with gene expression levels across species, suggesting that, given sufficient evolutionary time, copy number influences gene expression. Our results indicate high variability in size but conservation in gene expression levels in Y ampliconic gene families, significantly advancing our understanding of Y-chromosome evolution in great apes.

Keywords: Y chromosome; ampliconic genes; bonobo; gene copy number; gene expression; great apes; orangutan.


Figures

Fig. 1.
Fig. 1.
—Y ampliconic genes in great apes. (A) Venn diagram showing gene content comparison among great ape species. (B) Plot of the first two principal components (PCs) of Y ampliconic gene copy numbers across great ape species (the first and second PCs explained 68.7% and 22.8% of the variation, respectively; supplementary figure S5, Supplementary Material online, shows variation explained by the other components).
Fig. 2.
Fig. 2.
—Variation in copy number of Y ampliconic gene families in great apes. Box plots summarizing the distribution of copy numbers of the six great ape species across nine Y ampliconic gene families. The gene families are separated into individual plots with the gene family name at the top. Within each plot, the x axis represents six species (bonobo, chimpanzee, human, gorilla, Bornean orangutan, and Sumatran orangutan) and the y axis represents copy number. The black dot within each boxplot is the median value per species.
Fig. 3.
Fig. 3.
—Larger Y ampliconic gene families are more variable across great apes. The six scatter plots represent the relationship between median copy number and variance for each of the species, and the species name is present at the top of each plot. The x axis represents natural logarithm of median copy number and the y axis is a natural logarithm of variance in copy number. The Spearman correlations were calculated using the cor.test() function in R and the P values are in parentheses. The black line represents the linear function fitted to the given data points. The dots are color coded to represent the nine gene families, with missing dots indicating gene family absence in that species.
Fig. 4.
Fig. 4.
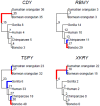
—Results of CAFE analysis identifying Y ampliconic gene families with significant shifts in gene copy number when compared with their ancestors. For each gene family with a significant difference in copy number, the phylogenetic tree representing the estimated copy number at internal nodes is shown. Significant shifts are highlighted in blue (contraction) and red (expansion). The copy numbers at the internal nodes were predicted by CAFE.
Fig. 5.
Fig. 5.
—Summary of gene expression levels across great apes. In the dot plot below, the x axis represents nine ampliconic gene families and the y axis represents their expression levels. The plot represents testis-specific expression of 12 great ape samples. Each dot within a gene family represents expression levels of an individual and the color of the dot denotes the species it belongs to. Missing dots represent gene families that are considered missing or pseudogenized, and their expression levels are excluded from the gene expression analysis (supplementary table S8, Supplementary Material online).
Fig. 6.
Fig. 6.
—Relationship between copy number and gene expression of Y ampliconic gene families in great ape species. The five scatter plots represent the relationship between expression and copy number for each of the five species, and the name of the species is present at the top of each plot. In each of the scatter plots, the x axis represents natural logarithm of median copy number and the y axis represents natural logarithm of median gene expression. The Spearman correlations were calculated using the cor.test() function in R and the P values are in parentheses. The black line is the linear function fitted to the given data points. The dots are color coded to represent the nine gene families, with missing dots corresponding to the gene families that are pseudogenized, deleted, or not expressed, in that species.
Fig. 7.
Fig. 7.
—Relationship between copy number and gene expression across species. In each of the scatter plots, the x axis represents natural logarithm of median copy number and the y axis represents natural logarithm of median gene expression. The Spearman correlations were calculated using the cor.test() function in R and the P values are in parentheses. The black line represents the linear function fitted to the given data points. The dots are color coded to represent the five species. The five scatter plots represent the relationship between expression and copy number for each of the five gene families, with the name of the gene family present at the top of each plot. Only the gene families that are present in all species are shown here.

Similar articles

  • Transcript Isoform Diversity of Ampliconic Genes on the Y Chromosome of Great Apes.
    Tomaszkiewicz M, Sahlin K, Medvedev P, Makova KD. Tomaszkiewicz M, et al. Genome Biol Evol. 2023 Nov 1;15(11):evad205. doi: 10.1093/gbe/evad205. Genome Biol Evol. 2023. PMID: 37967251 Free PMC article.
  • Dosage regulation, and variation in gene expression and copy number of human Y chromosome ampliconic genes.
    Vegesna R, Tomaszkiewicz M, Medvedev P, Makova KD. Vegesna R, et al. PLoS Genet. 2019 Sep 16;15(9):e1008369. doi: 10.1371/journal.pgen.1008369. eCollection 2019 Sep. PLoS Genet. 2019. PMID: 31525193 Free PMC article.
  • The complete sequence and comparative analysis of ape sex chromosomes.
    Makova KD, Pickett BD, Harris RS, Hartley GA, Cechova M, Pal K, Nurk S, Yoo D, Li Q, Hebbar P, McGrath BC, Antonacci F, Aubel M, Biddanda A, Borchers M, Bornberg-Bauer E, Bouffard GG, Brooks SY, Carbone L, Carrel L, Carroll A, Chang PC, Chin CS, Cook DE, Craig SJC, de Gennaro L, Diekhans M, Dutra A, Garcia GH, Grady PGS, Green RE, Haddad D, Hallast P, Harvey WT, Hickey G, Hillis DA, Hoyt SJ, Jeong H, Kamali K, Pond SLK, LaPolice TM, Lee C, Lewis AP, Loh YE, Masterson P, McGarvey KM, McCoy RC, Medvedev P, Miga KH, Munson KM, Pak E, Paten B, Pinto BJ, Potapova T, Rhie A, Rocha JL, Ryabov F, Ryder OA, Sacco S, Shafin K, Shepelev VA, Slon V, Solar SJ, Storer JM, Sudmant PH, Sweetalana, Sweeten A, Tassia MG, Thibaud-Nissen F, Ventura M, Wilson MA, Young AC, Zeng H, Zhang X, Szpiech ZA, Huber CD, Gerton JL, Yi SV, Schatz MC, Alexandrov IA, Koren S, O'Neill RJ, Eichler EE, Phillippy AM. Makova KD, et al. Nature. 2024 Jun;630(8016):401-411. doi: 10.1038/s41586-024-07473-2. Epub 2024 May 29. Nature. 2024. PMID: 38811727 Free PMC article.
  • The Y chromosomes of the great apes.
    Hallast P, Jobling MA. Hallast P, et al. Hum Genet. 2017 May;136(5):511-528. doi: 10.1007/s00439-017-1769-8. Epub 2017 Mar 6. Hum Genet. 2017. PMID: 28265767 Review.
  • Great ape genomics.
    Wall JD. Wall JD. ILAR J. 2013;54(2):82-90. doi: 10.1093/ilar/ilt048. ILAR J. 2013. PMID: 24174434 Free PMC article. Review.

Cited by

  • The first complete T2T Assemblies of Cattle and Sheep Y-Chromosomes uncover remarkable divergence in structure and gene content.
    Smith T, Olagunju T, Rosen B, Neibergs H, Becker G, Davenport K, Elsik C, Hadfield T, Koren S, Kuhn K, Rhie A, Shira K, Skibiel A, Stegemiller M, Thorne J, Villamediana P, Cockett N, Murdoch B. Smith T, et al. Res Sq [Preprint]. 2024 Apr 3:rs.3.rs-4033388. doi: 10.21203/rs.3.rs-4033388/v1. Res Sq. 2024. Update in: Nat Commun. 2024 Sep 27;15(1):8277. doi: 10.1038/s41467-024-52384-5. PMID: 38712074 Free PMC article. Updated. Preprint.
  • Fourth Report on Chicken Genes and Chromosomes 2022.
    Smith J, Alfieri JM, Anthony N, Arensburger P, Athrey GN, Balacco J, Balic A, Bardou P, Barela P, Bigot Y, Blackmon H, Borodin PM, Carroll R, Casono MC, Charles M, Cheng H, Chiodi M, Cigan L, Coghill LM, Crooijmans R, Das N, Davey S, Davidian A, Degalez F, Dekkers JM, Derks M, Diack AB, Djikeng A, Drechsler Y, Dyomin A, Fedrigo O, Fiddaman SR, Formenti G, Frantz LAF, Fulton JE, Gaginskaya E, Galkina S, Gallardo RA, Geibel J, Gheyas AA, Godinez CJP, Goodell A, Graves JAM, Griffin DK, Haase B, Han JL, Hanotte O, Henderson LJ, Hou ZC, Howe K, Huynh L, Ilatsia E, Jarvis ED, Johnson SM, Kaufman J, Kelly T, Kemp S, Kern C, Keroack JH, Klopp C, Lagarrigue S, Lamont SJ, Lange M, Lanke A, Larkin DM, Larson G, Layos JKN, Lebrasseur O, Malinovskaya LP, Martin RJ, Martin Cerezo ML, Mason AS, McCarthy FM, McGrew MJ, Mountcastle J, Muhonja CK, Muir W, Muret K, Murphy TD, Ng'ang'a I, Nishibori M, O'Connor RE, Ogugo M, Okimoto R, Ouko O, Patel HR, Perini F, Pigozzi MI, Potter KC, Price PD, Reimer C, Rice ES, Rocos N, Rogers TF, Saelao P, Schauer J, Schnabel RD, Schneider VA, Simianer H, Smith A, Stevens MP, Stiers K, Tiambo CK, Tixier-Boichard M, Torgasheva AA, Tracey A, Tregaskes CA, Vervelde L,… See abstract for full author list ➔ Smith J, et al. Cytogenet Genome Res. 2022;162(8-9):405-528. doi: 10.1159/000529376. Epub 2023 Jan 30. Cytogenet Genome Res. 2022. PMID: 36716736 Free PMC article. Review. No abstract available.
  • Repetitive DNAs and differentiation of the ZZ/ZW sex chromosome system in the combtail fish Belontia hasselti (Perciformes: Osphronemidae).
    Oliveira AM, Deon GA, Sember A, Goes CAG, Supiwong W, Tanomtong A, Porto-Foresti F, Utsunomia R, Liehr T, Cioffi MB. Oliveira AM, et al. BMC Ecol Evol. 2025 Mar 18;25(1):25. doi: 10.1186/s12862-025-02358-y. BMC Ecol Evol. 2025. PMID: 40098070 Free PMC article.
  • The contribution of sex chromosome conflict to disrupted spermatogenesis in hybrid house mice.
    Kopania EEK, Watson EM, Rathje CC, Skinner BM, Ellis PJI, Larson EL, Good JM. Kopania EEK, et al. Genetics. 2022 Nov 30;222(4):iyac151. doi: 10.1093/genetics/iyac151. Genetics. 2022. PMID: 36194004 Free PMC article.
  • Detecting signatures of selection on gene expression.
    Price PD, Palmer Droguett DH, Taylor JA, Kim DW, Place ES, Rogers TF, Mank JE, Cooney CR, Wright AE. Price PD, et al. Nat Ecol Evol. 2022 Jul;6(7):1035-1045. doi: 10.1038/s41559-022-01761-8. Epub 2022 May 12. Nat Ecol Evol. 2022. PMID: 35551249

References

    1. Altschul SF, Gish W, Miller W, Myers EW, Lipman DJ.. 1990. Basic local alignment search tool. J Mol Biol. 215(3):403–410. - PubMed
    1. Ancrenaz M, et al.2016. Pongo pygmaeus. The IUCN Red List of Threatened Species 2016: e.T17975A123809220. Available from: https://dx.doi.org/10.2305/IUCN.UK.2016-1.RLTS.T17975A17966347.en. Accesed May 7, 2020.
    1. Ardlie KG, et al.2015. The Genotype-Tissue Expression (GTEx) pilot analysis: multitissue gene regulation in humans. Science 348:648–660. - PMC - PubMed
    1. Betrán E, Demuth JP, Williford A.. 2012. Why chromosome palindromes? Int J Evol Biol. 2012:207958. - PMC - PubMed
    1. Boetzer M, Henkel CV, Jansen HJ, Butler D, Pirovano W.. 2011. Scaffolding pre-assembled contigs using SSPACE. Bioinformatics 27(4):578–579. - PubMed

Publication types