. 2020 May 5;31(5):107608.
doi: 10.1016/j.celrep.2020.107608.

Antagonistic Center-Surround Mechanisms for Direction Selectivity in the Retina

Affiliations

Antagonistic Center-Surround Mechanisms for Direction Selectivity in the Retina

Lea Ankri et al. Cell Rep. .

Abstract

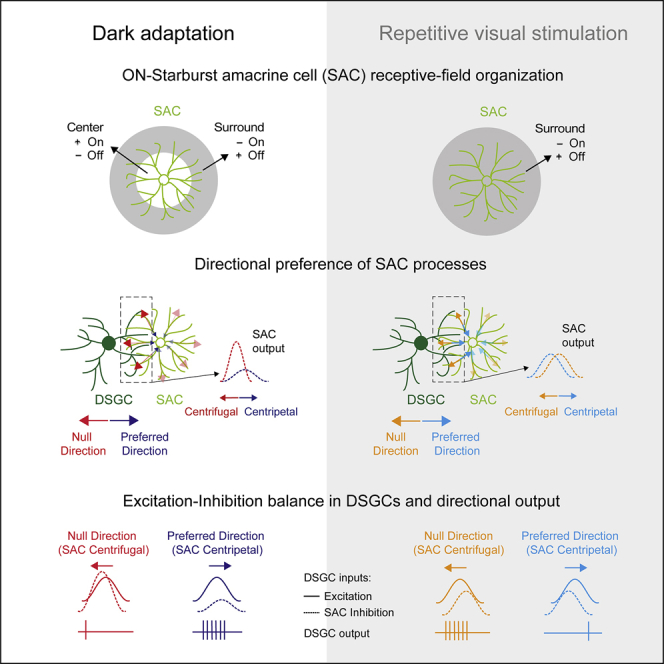
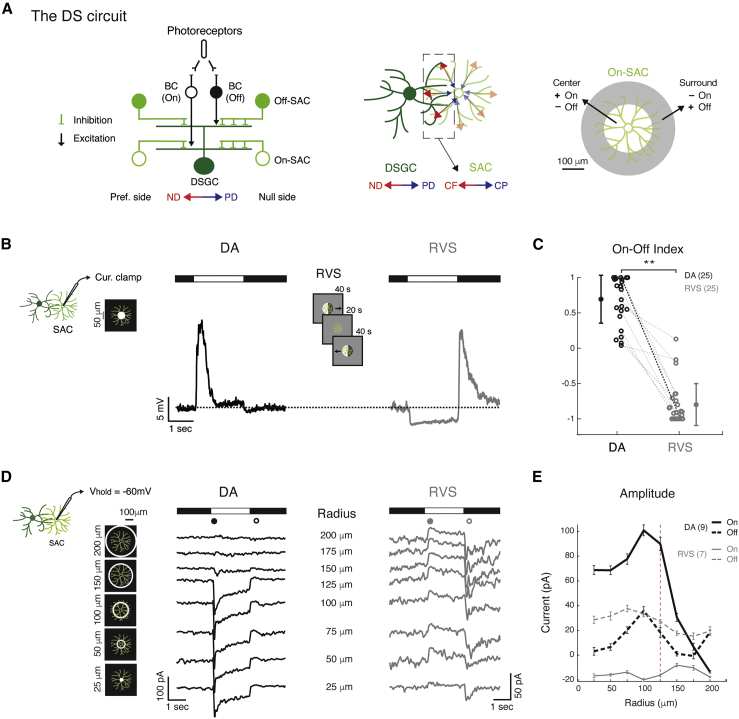
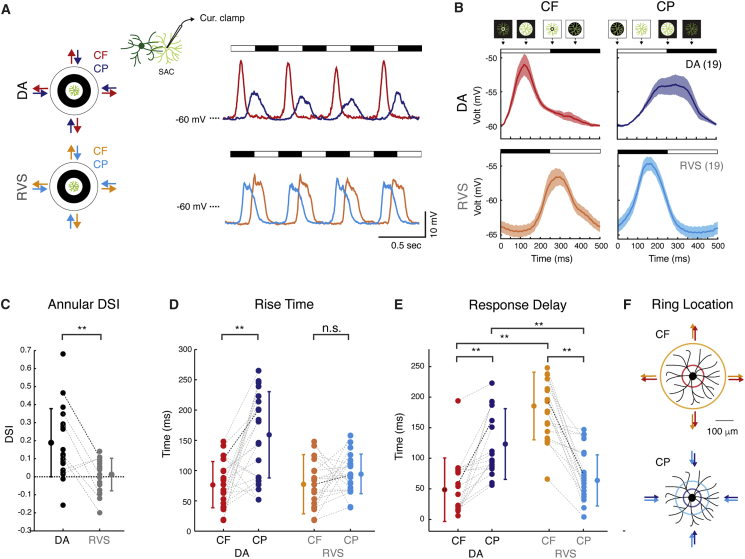
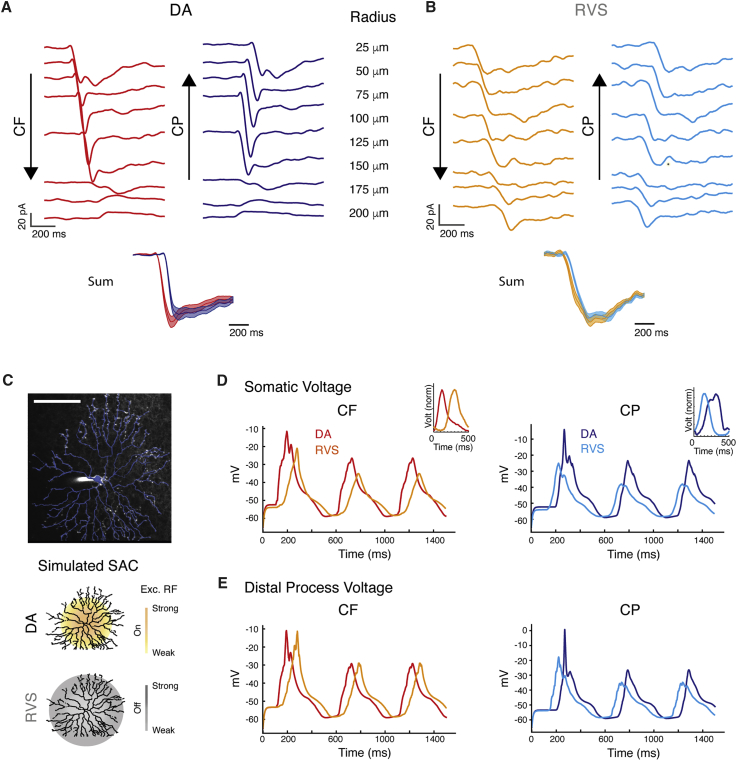
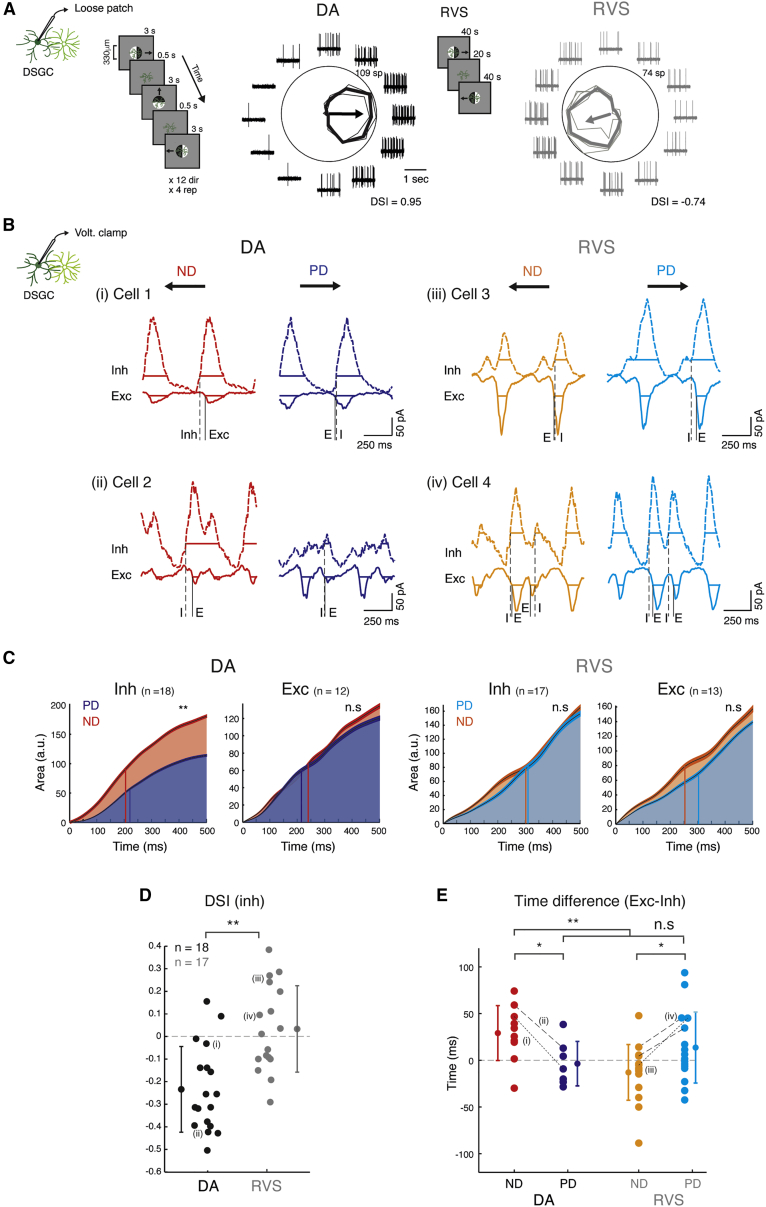
An antagonistic center-surround receptive field is a key feature in sensory processing, but how it contributes to specific computations such as direction selectivity is often unknown. Retinal On-starburst amacrine cells (SACs), which mediate direction selectivity in direction-selective ganglion cells (DSGCs), exhibit antagonistic receptive field organization: depolarizing to light increments and decrements in their center and surround, respectively. We find that a repetitive stimulation exhausts SAC center and enhances its surround and use it to study how center-surround responses contribute to direction selectivity. Center, but not surround, activation induces direction-selective responses in SACs. Nevertheless, both SAC center and surround elicited direction-selective responses in DSGCs, but to opposite directions. Physiological and modeling data suggest that the opposing direction selectivity can result from inverted temporal balance between excitation and inhibition in DSGCs, implying that SAC's response timing dictates direction selectivity. Our findings reveal antagonistic center-surround mechanisms for direction selectivity and demonstrate how context-dependent receptive field reorganization enables flexible computations.

Keywords: antagonistic center-surround; direction selective ganglion cells; direction selectivity; excitatory-inhibitory balance; neural circuits; neural computation; receptive field; retina; starburst amacrine cells; visual processing.


Conflict of interest statement

Declaration of Interests The authors declare no competing interests.

Figures

None
Graphical abstract
Figure 1
Figure 1
RVS Reorganizes SAC Center-Surround Receptive Field (A) Left: schematics of the direction-selective (DS) circuit, side view. Middle: a DSGC with one innervating SAC, top view. Dashed box denotes SAC processes that are oriented in the DSGC’s ND, providing it with GABAergic inhibition. Right: On-SAC antagonistic center-surround organization. (B) Average current-clamp recordings of an example On-SAC in response to a 2-s bright spot (50-μm radius) in dark-adapted (DA; black) conditions and following RVS (gray). RVS is illustrated in the center. Dashed line denotes the baseline voltage. (C) On-Off index of On-SACs in DA conditions and following RVS. Dashed lines connect values of the same cell; bold line represents the cell in (B). Group means and SD are indicated on the side by circles and error bars. (D) Average voltage-clamp recordings (Vhold = −60 mV) from an example On-SAC in response to 2-s static rings of eight different radii (specified in the center; five are illustrated on the left), in DA conditions and following RVS. Black and gray dots denote the periods used for the population analysis in (E). (E) Maximal amplitude (mean ± SEM) of the excitatory currents as a function of ring radius in DA conditions and following RVS for light onset and offset (continuous and dashed lines, respectively). Dashed vertical line denotes the distal boundary of SAC excitatory receptive field. For all panels, asterisks indicate statistical significance (p < 0.05; ∗∗p < 0.005). Numbers of cells in each group are in brackets. BC, bipolar cell; CF, centrifugal; CP, centripetal; ND, null direction; PD, preferred direction.
Figure 2
Figure 2
RVS Abolishes SAC CF Preference and Shifts Its Response Time (A) Left: illustration of the stimulus. Right: average current-clamp recordings from an example On-SAC in response to CF and CP motion in DA conditions (top) and following RVS (bottom). (B) One-cycle waveforms of On-SAC population responses to CF and CP rings (mean ± SEM) in DA conditions (top) and following RVS (bottom). Black and white bars denote the ring’s location with respect to the SAC processes (proximal and distal processes for CF and CP motion, respectively). (C) A-DSI of On-SAC population in DA conditions and following RVS. (D and E) Rise time (D) and response delay (E) of CF and CP motion responses in DA conditions and following RVS. (F) Colored rings depict the location of the ring’s leading edge relative to SAC (white ring for DA, black for RVS) at the time of average response onset depicted in (E). For (C)–(E), group means and SD are indicated on the side by circles and error bars. Bold lines represent the cell in (A). Asterisks indicate statistical significance (**p < 0.005).
Figure 3
Figure 3
Models for the Role of Excitatory Receptive Field Organization in SAC Directional Responses (A) Population average EPSCs evoked in DA SAC in response to rings of different radii. The traces are shifted in time to simulate proximal-to-distal CF motion (left) and distal-to-proximal CP motion (right). Bottom: linear summation of the shifted responses ± SEM (see Figure S2). (B) As in (A), but for SAC recorded following RVS. (C) Top: projection of an On-SAC filled with fluorescent dye (white) and its reconstruction (blue). Scale bar: 100 μm. Bottom: schematics of excitatory receptive field, in DA conditions (top, yellow area) and following RVS (bottom, gray area). (D) Example somatic voltage of a simulated SAC response to CF and CP motion under the two excitatory receptive fields shown in (C). DA traces (red, blue) are plotted on top of RVS traces (orange, cyan). Insets depict the superimposed normalized average responses to CF and CP motion recorded from On-SAC. (E) As in (D), but for SAC distal processes (d = 135 μm from soma).
Figure 4
Figure 4
Temporal Shift of Inhibition Supports Reversal of DSGC’s Directional Preference (A) An example DSGC directional tuning to drifting gratings (shown on the left) in DA conditions (left) and following RVS (right). RVS is illustrated in the center. Traces are examples of 1-s recordings. Polar plots represent the mean response (spike count during 3 s), and thin lines show the responses in each repetition. Arrows represent the normalized vectorial summation (with outer ring equal to 1). (B) Mean voltage clamp recordings of four example DSGCs in response to gratings moving in the PD (blue, cyan) and ND (red, orange) in DA conditions (left) and following RVS (right). Horizontal lines represent the detected response phases, which determine time of response onset (vertical continuous and dashed lines for excitation [E] and inhibition [I], respectively). (C) Cumulative current during PD and ND motion of inhibitory and excitatory average normalized waveforms (mean ± SEM). Vertical lines denote the time of 50% maximal value (PD: blue and cyan, and ND: red and orange, for DA conditions and following RVS, respectively). (D) DSI of inhibition in DA conditions and following RVS. (E) Time difference between excitatory and inhibitory response onset during PD and ND motion in DA conditions and following RVS. For (D) and (E), group means and SD are indicated on the side by circles and error bars; dashed lines connect values of the cells depicted in (B). Asterisks indicate statistical significance (*p<0.05; **p < 0.005).

References

    1. Ackert J.M., Farajian R., Völgyi B., Bloomfield S.A. GABA blockade unmasks an OFF response in ON direction selective ganglion cells in the mammalian retina. J. Physiol. 2009;587:4481–4495. - PMC - PubMed
    1. Allman J., Miezin F., McGuinness E. Stimulus specific responses from beyond the classical receptive field: neurophysiological mechanisms for local-global comparisons in visual neurons. Annu. Rev. Neurosci. 1985;8:407–430. - PubMed
    1. Barlow H.B. Summation and inhibition in the frog’s retina. J. Physiol. 1953;119:69–88. - PMC - PubMed
    1. Briggman K.L., Helmstaedter M., Denk W. Wiring specificity in the direction-selectivity circuit of the retina. Nature. 2011;471:183–188. - PubMed
    1. Chen Q., Pei Z., Koren D., Wei W. Stimulus-dependent recruitment of lateral inhibition underlies retinal direction selectivity. eLife. 2016;5:e21053. - PMC - PubMed

Publication types

LinkOut - more resources