Review
. 2020 Aug;45(9):1411-1422.
doi: 10.1038/s41386-020-0697-9. Epub 2020 May 6.

A roadmap for development of neuro-oscillations as translational biomarkers for treatment development in neuropsychopharmacology

Affiliations
Review

A roadmap for development of neuro-oscillations as translational biomarkers for treatment development in neuropsychopharmacology

Daniel C Javitt et al. Neuropsychopharmacology. 2020 Aug.

Abstract

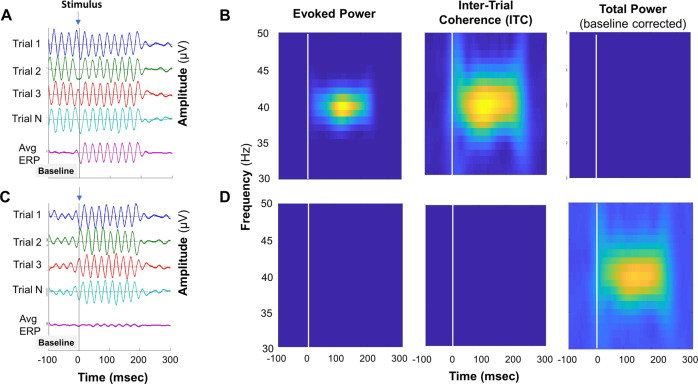
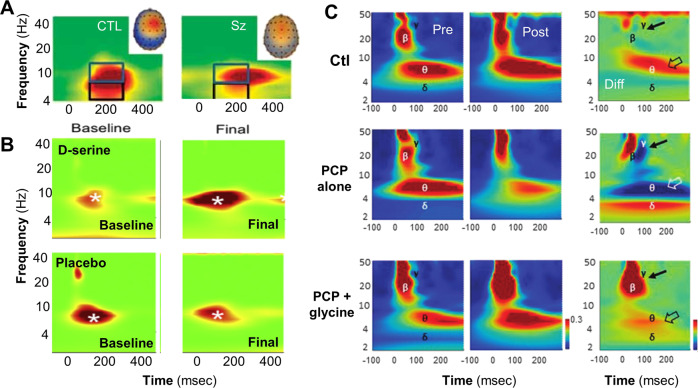
New treatment development for psychiatric disorders depends critically upon the development of physiological measures that can accurately translate between preclinical animal models and clinical human studies. Such measures can be used both as stratification biomarkers to define pathophysiologically homogeneous patient populations and as target engagement biomarkers to verify similarity of effects across preclinical and clinical intervention. Traditional "time-domain" event-related potentials (ERP) have been used translationally to date but are limited by the significant differences in timing and distribution across rodent, monkey and human studies. By contrast, neuro-oscillatory responses, analyzed within the "time-frequency" domain, are relatively preserved across species permitting more precise translational comparisons. Moreover, neuro-oscillatory responses are increasingly being mapped to local circuit mechanisms and may be useful for investigating effects of both pharmacological and neuromodulatory interventions on excitatory/inhibitory balance. The present paper provides a roadmap for development of neuro-oscillatory responses as translational biomarkers in neuropsychiatric treatment development.


Figures

Fig. 1
Fig. 1. Illustration of differential information obtained from evoked and single-trial analyses.
a Schematic diagram of processing scheme. Unshaded boxes represent time-domain measures. Shaded boxes represent time-frequency (TF) domain or “spectral” measures. For time-domain measures, random EEG activity and waves that are not time or phase-locked to event onsets do not survive signal averaging across epochs and are not captured in the ERP (see also Fig. 2). TF decomposition can be applied either to averaged time-domain files, yielding evoked-power analyses, or to the single-trials prior to averaging, yielding separate assessments of intertrial coherence (ITC) and total power (evoked + induced). Estimation of power from the single trial epochs preserves and quantifies all of the neuro-oscillatory activity present, irrespective of whether the oscillations elicited by the event are “evoked” or “induced”. Total ongoing power in humans tends to be dominated by ongoing alpha activity. Therefore, total power is typically baseline corrected to permit better visualization of stimulus-induced changes. b Cartoon of the recently developed interleaved visual presentation paradigm (“JH-Flkr”) showing initial stimulus onset at 0 msec, followed by motion onset at 600 msec and steady-state stimulation onset at 1400 msec. c Time-frequency plots for Evoked-Power, Intertrial coherence (ITC, “phase locking”), Ongoing (i.e. non-baseline corrected) single-trial Total Power and Baseline corrected total power. Note that the response evoked by stimulus onset occurs primarily in the theta frequency range (solid box) and is accompanied by alterations in both ITC and total power. By contrast, the response evoked by motion onset occurs primarily in the delta frequency range (dashed box) and is associated with alterations only in ITC but not total power, suggesting differential underlying local circuit mechanisms. Finally, the stimulus-induced alpha event-related desynchronization (ERD) (asterisk) is not associated with alterations in either evoked-power or ITC but appears only in single-trial power analyses. Adapted from ref. [61] .
Fig. 2
Fig. 2. Illustration of single trial event-related oscillations and corresponding time-frequency measures.
a Stimulus evoked phase-resetting of ongoing gamma oscillations. Pure phase-resetting occurs when a stimulus evokes a change in the phase of the ongoing oscillations without evoking a change in the magnitude of the oscillations. Because the phase of the stimulus evoked-oscillation is reset in a consistent manner across trials, the single trial oscillations survive averaging and are evident in the ERP. Note that these oscillations are not evident in the pre-stimulus ERP baseline because their random phase leads to their being cancelled out when epochs are averaged to generate the ERP. In contrast, the oscillations show strong phase synchrony across trials for the first 200 msec post-stimulus and are therefore evident after averaging trials to derive the ERP. b In pure phase-resetting by a stimulus, the phase of ongoing oscillations is reset by the stimulus in a consistent manner across trials, resulting in high intertrial coherence (ITC). In this scenario, the TF analysis shows prominent gamma band evoked-power and ITC. However, because the stimulus does not evoke a change in the magnitude of the ongoing oscillations, there is no appreciable total gamma power response to the stimulus once baseline correction is performed. c Stimulus induced increase in the power of ongoing gamma oscillations with no phase resetting. As with a, oscillations during the prestimulus baseline period do not survive averaging during the generation of the ERP. In contrast to A, the stimulus induces an increase in the magnitude of oscillations, but because the post-stimulus oscillations are not phase synchronized across trials, very little of this activity survives averaging across epochs when generating the ERP. d With a stimulus-induced increase in power, but oscillations with random phase across trials, there is a clear increase in total power, but no appreciable evoked power or intertrial coherence. Adapted from ref. [17].
Fig. 3
Fig. 3. Cross-species homology.
a Mismatch negativity (MMN) in schizophrenia vs. control patients, showing deficits in evoked-power within the theta frequency range. From ref. [200]. b MMN prior to and following treatment with the NMDAR glycine-site agonist D-serine in schizophrenia (Sz) vs. placebo. From ref. [138], *p < 0.05. c MMN in rodents pre/post treatment with placebo (Ctl), PCP alone, or PCP + glycine in rodents. Note decrease in MMN-related theta activity pre/post PCP alone treatment, and prevention of the difference by simultaneous glycine treatment. From ref. [55].
Fig. 4
Fig. 4. Local circuit mechanisms underlying neuro-oscillatory measures.
Frequency-bands and example circuit motifs whose activation is associated with frequency specific rhythmic activity in the neocortex. The frequency axis illustrates that oscillatory bands are partly overlapping (varying e.g. with excitatory and inhibitory drive). The circuit diagrams illustrate that activation of specific cells (e.g. fast spiking parvalbumim (PV+) expressing interneurons in superficial layers; somatostain (SOM+) interneurons) and their cortical connectivity are associated with rhythmic activity at bandlimited frequency-bands.

References

    1. Javitt DC, Freedman R. Sensory processing dysfunction in the personal experience and neuronal machinery of schizophrenia. Am J Psychiatry. 2015;172:17–31. - PMC - PubMed
    1. Javitt DC, Schoepp D, Kalivas PW, Volkow ND, Zarate C, Merchant K, et al. Translating glutamate: from pathophysiology to treatment. Sci Transl Med. 2011;3:102mr2. - PMC - PubMed
    1. Javitt DC, Spencer KM, Thaker GK, Winterer G, Hajos M. Neurophysiological biomarkers for drug development in schizophrenia. Nat Rev. 2008;7:68–83. - PMC - PubMed
    1. Luck SJ, Mathalon DH, O’Donnell BF, Hamalainen MS, Spencer KM, Javitt DC, et al. A roadmap for the development and validation of event-related potential biomarkers in schizophrenia research. Biol Psychiatry. 2011;70:28–34. - PMC - PubMed
    1. Cohen MX. Analyzing neural time series data: theory and practice. Cambridge: MIT press; 2014 .

Publication types