. 2020 May 4;12(5):290.
doi: 10.3390/toxins12050290.

AFB1 Induced Transcriptional Regulation Related to Apoptosis and Lipid Metabolism in Liver of Chicken

Affiliations

AFB1 Induced Transcriptional Regulation Related to Apoptosis and Lipid Metabolism in Liver of Chicken

Xueqin Liu et al. Toxins (Basel). .

Abstract

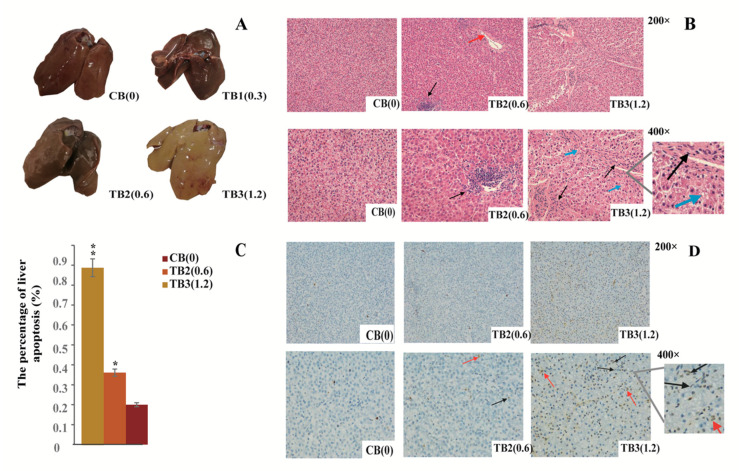
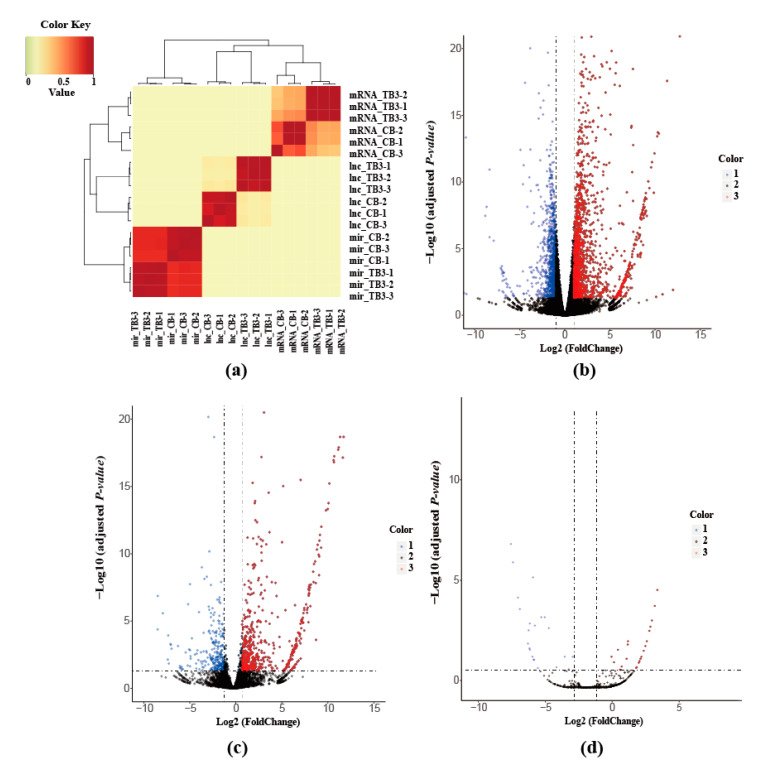
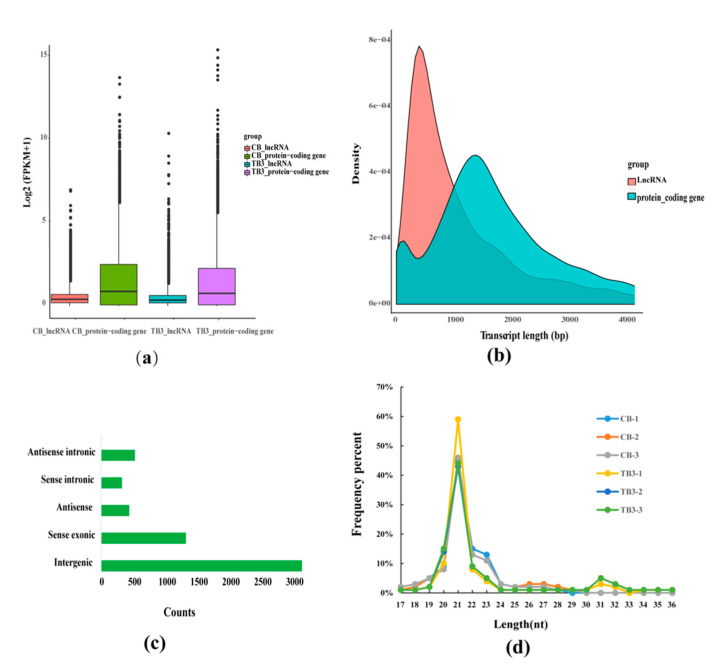
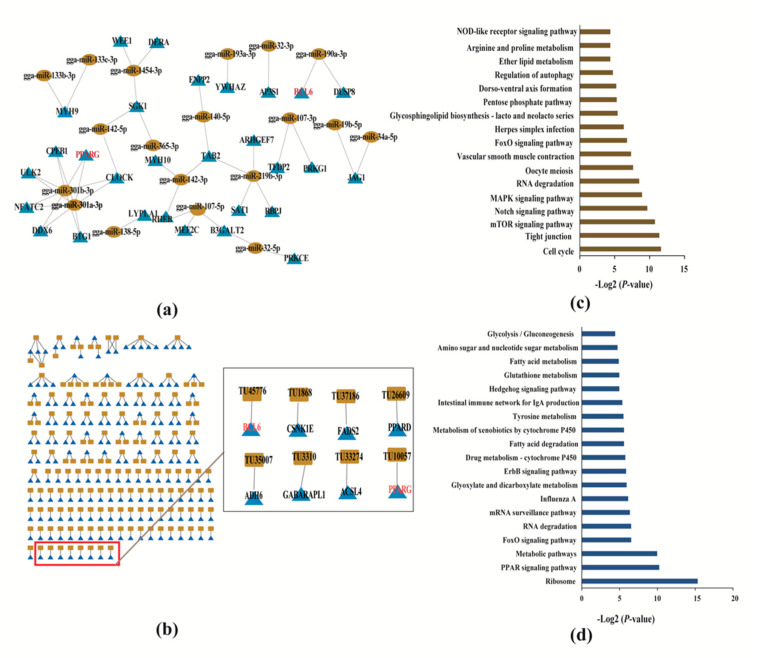
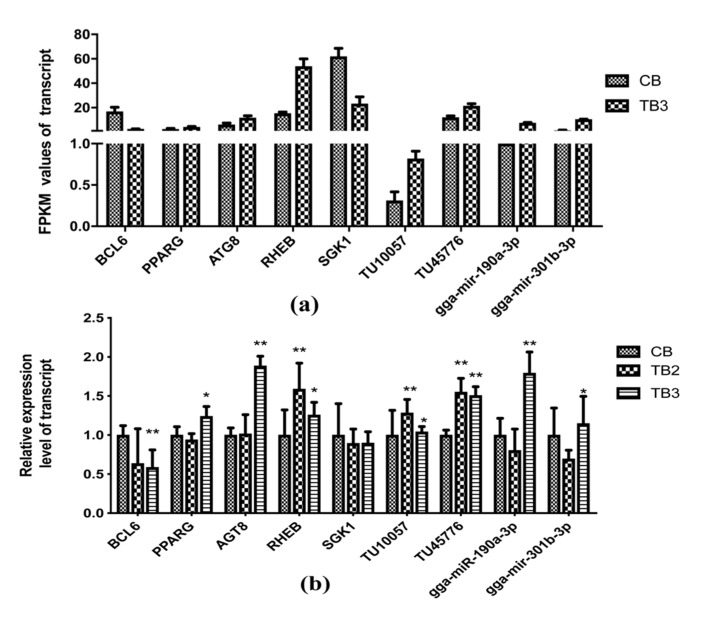
Aflatoxin B1 (AFB1) leads to a major risk to poultry and its residues in meat products can also pose serious threat to human health. In this study, after feeding 165-day-old Roman laying hens for 35 days, the toxic effects of aflatoxin B1 at different concentrations were evaluated. The purpose of this study was to explore the mechanism of liver toxicosis responses to AFB1. We found that highly toxic group exposure resulted in liver fat deposition, increased interstitial space, and hepatocyte apoptosis in laying hens. Furthermore, a total of 164 differentially expressed lnRNAs and 186 differentially expressed genes were found to be highly correlated (Pearson Correlation Coefficient > 0.80, p-value < 0.05) by sequencing the transcriptome of control (CB) and highly toxic group (TB3) chickens. We also identify 29 differentially expressed genes and 19 miRNAs that have targeted regulatory relationships. Based on the liver cell apoptosis and fatty liver syndrome that this research focused on, we found that the highly toxic AFB1 led to dysregulation of the expression of PPARG and BCL6. They are cis-regulated by TU10057 and TU45776, respectively. PPARG was the target gene of gga-miR-301a-3p, gga-miR-301b-3p, and BCL6 was the target gene of gga-miR-190a-3p. In summary, highly toxic AFB1 affects the expression levels of protein-coding genes and miRNAs in the liver of Roman layer hens, as well as the expression level of long non-coding RNA in the liver, which upregulates the expression of PPARG and downregulates the expression of Bcl-6. Our study provides information on possible genetic regulatory networks in AFB1-induced hepatic fat deposition and hepatocyte apoptosis.

Keywords: Roman layer; aflatoxin B1; differential expression; fat deposition; high-throughput sequencing; liver.


Conflict of interest statement

The authors declare no conflict of interest.

Figures

Figure 1
Figure 1
Liver tissue lesion observation and hepatocyte apoptosis detected by TUNEL assay. (a) liver lesions at different concentrations of AFB1 (mg/kg). (b) observation of liver histopathological changes. The red arrow refers to a small amount of liver cells visible in the vein, the black arrow points to the inflammatory cells, and the blue arrow points to the lipid droplets. (c) The percentages of apoptosis cells detected by TUNEL (%). Bars represent the standard error. A single asterisk (p < 0.05) or two asterisks (p < 0.01) above a bar represents a statistically significant difference between the CB and TB2 or TB3. The statistical analyses use one-way ANOVA. (d) TUNEL-positive hepatocytes are shown (200×, 400×). The black arrows indicate round, crescent-shaped or irregularly shaped apoptosis cells; the red arrows indicate apoptosis cells with the nucleus condensed in brown.
Figure 2
Figure 2
(a) Correlation analysis of the expression profile of liver lncRNA miRNA mRNA. (b) Differentially expressed mRNAs between CB and TB3. (c) Differentially expressed lncRNAs between CB and TB3. (d) Differentially expressed miRNAs between CB and TB3. Note: 1 (blue) represents down-regulated genes, 2 (black) represents non-differentiated genes, and 3 (red) represents up-regulated genes.
Figure 3
Figure 3
(a) Comparison of the expression levels of lncRNAs and mRNAs. (b) Distribution of transcript length for lncRNAs and protein-coding genes. (c) Classification of lncRNAs. (d) Length distribution of miRNA sequences.
Figure 4
Figure 4
(a) Interaction of 47 miRNA–mRNA pairs. Ellipse represent lncRNA, and triangle represent gene. (b) Interaction of 216 lncRNA–mRNA pairs. The relationship between lncRNAs-mRNAs interactions is shown in the left, the rectangle represents lncRNA, and triangle represents the gene. (c) Functional enrichment pathway of 29 mRNAs regulated by miRNA. (d) Functional enrichment pathway of 186 mRNAs regulated by lncRNA.
Figure 5
Figure 5
qRT-PCR validated high-throughput sequencing of apoptosis and fat deposition genes. Note: A single asterisk (p < 0.05) or two asterisks (p < 0.01) represents a statistically significant difference of Reads Per Kilobase per Million mapped reads (FPKM) values between the CB and the TB2 or TB3 chickens. The statistical analyses use one-way ANOVA.

References

    1. Sakamoto M.I., Murakami A.E., Fernandes A.M., Ospina-Rojas I.C., Hirata A.K. Performance and serum biochemical profile of Japanese quail supplemented with silymarin and contaminated with aflatoxin B1. Poult. Sci. 2017;97:159–166. doi: 10.3382/ps/pex277. - DOI - PubMed
    1. Monson M.S., Coulombe R.A., Reed K.M. Aflatoxicosis: Lessons from toxicity and responses to aflatoxin B1 in poultry. Agriculture. 2015;5:742–777. doi: 10.3390/agriculture5030742. - DOI
    1. Zhao J., Shirley R.B., Dibner J.D., Uraizee F., Officer M., Kitchell M., Vazquez-Anon M., Knight C.D. Comparison of hydrated sodium calcium aluminosilicate and yeast cell wall on counteracting aflatoxicosis in broiler chicks. Poult. Sci. 2010;89:2147–2156. doi: 10.3382/ps.2009-00608. - DOI - PubMed
    1. Diaz G.J., Cortes A., Botero L. Evaluation of the ability of a feed additive to ameliorate the adverse effects of aflatoxins in turkey poults. Br. Poult. Sci. 2009;50:240–250. doi: 10.1080/00071660902774566. - DOI - PubMed
    1. Ankrah N.A., Addo P.G., Abrahams C.A., Ekuban F.A., Addae M.M. Comparative effects of aflatoxins G1 and B1 at levels within human exposure limits on mouse liver and kidney. West Afr. J. Med. 1993;12:105–109. - PubMed

Publication types

MeSH terms

LinkOut - more resources