. 2020 May 6;20(1):136.
doi: 10.1186/s12906-020-02933-4.

Administration of mulberry leaves maintains pancreatic β-cell mass in obese/type 2 diabetes mellitus mouse model

Affiliations

Administration of mulberry leaves maintains pancreatic β-cell mass in obese/type 2 diabetes mellitus mouse model

Patlada Suthamwong et al. BMC Complement Med Ther. .

Abstract

Background: Type 2 diabetes mellitus is characterized by insulin resistance and pancreatic β-cell dysfunction. A decrease in β-cell mass, which occurs during the progression of Type 2 diabetes mellitus, contributes to impaired insulin secretion. Mulberry leaves contain various nutritional components that exert anti-diabetic and anti-atherogenic effects. The present study analyzed the effects of mulberry leaf intake on pancreatic β-cells to clarify the mechanisms underlying its anti-diabetic function.

Methods: Mulberry leaves (Morus alba L.) were dried at 180 °C for 8 s in a hot-air mill and fed to obesity/Type 2 diabetes mellitus db/db mouse models at 5% (w/w) as part of a normal diet from 7 to 10, 15, or 20 weeks of age. An intraperitoneal glucose tolerance test was then performed on the mice. To evaluate the β-cell mass, the pancreas was subjected to immunohistological analysis with an anti-insulin antibody. A TUNEL assay and immunohistological analysis with a proliferation marker was also performed. Expression levels of endoplasmic reticulum stress-responsible genes and proliferation markers were assessed by quantitative RT-PCR.

Results: Intake of mulberry leaves maintained the β-cell function of db/db mice. Moreover, oral administration of mulberry leaves significantly decreased cell death by reducing endoplasmic reticulum stress in the pancreas. Mulberry leaves significantly increased proliferation of β-cells and the expression of pancreatic duodenal homeobox1 mRNA in the pancreas.

Conclusion: Considered together, these results indicate that dietary mulberry leaf administration can maintain insulin levels and pancreatic β-cell mass, at least in part, by suppressing endoplasmic reticulum stress in Type 2 diabetes mellitus mouse models.

Keywords: Endoplasmic reticulum stress; Mulberry leaves; Obesity; Type 2 diabetes; β-Cell.


Conflict of interest statement

The authors declare that they have no completing of interest.

Figures

Fig. 1
Fig. 1
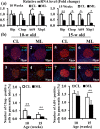
Effect of an ML-diet on the pancreases of db/db mice. a After being fed with an ML-diet or a control-diet from 7-w of age, the pancreases of db/db mice were collected at 10-w, 15-w, and 20-w of age, and stained with anti-insulin antibody. Scale bar, 300 μm. β-cell area (%) was calculated by dividing the insulin-positive area by the total pancreas area in randomly acquired micrographs. b Expression of proinsulin mRNA in pancreases of 10-w old mice and 15-w old mice was analyzed via RT-qPCR. The results are shown as relative mRNA levels of the ML-diet group to control-diet group. CL, control-diet group; ML, ML-diet group, n = 6. All values are mean ± SEM. *, P < 0.05; **, P < 0.01 based on a two-tailed Student’s ‘t’ test
Fig. 2
Fig. 2
Effect of an ML-diet on glucose tolerance. Glucose tolerance was evaluated via ipGTT. After intraperitoneally injecting mice with glucose (1.5 g/kg of D-glucose), blood was drawn every 30 min, and plasma glucose and plasma insulin levels were measured. (a), 10-w old mouse; (b), 15-w old mouse; (a-1) and (b-1), Plasma glucose level (mg/dL); (a-2) and (b-2), net AUC (mg/dL.min) calculated from the data shown in (a-1) and (b-1), respectively; (a-3) and (b-3), Plasma insulin level (ng/ml); (a-4) and (b-4), net AUC (ng/mL.min) calculated from the data shown in (a-3) and (b-3), respectively. CL and white rhombus, control-diet group; ML and black square, ML-diet group; n = 6. Data are expressed as mean ± SEM. **, P < 0.01 versus control
Fig. 3
Fig. 3
The effect of an ML-diet on cell death in the pancreases of db/db mice. Pancreatic sections from 15-old db/db mice were stained using the TUNEL method (green), anti-insulin antibodies (red) and DAPI (blue). White triangles indicate TUNEL-positive cells. CL, control-diet group; ML, ML-diet group. Scale bar: 50 μm. The ratio of the number of TUNEL-positive β-cells to total β-cell numbers is shown in the right panel. **, P < 0.01 versus control
Fig. 4
Fig. 4
The effect of an ML-diet on ER stress in β-cells of db/db mice. a mRNA expression of ER stress markers in pancreases of 10-w old mice and 15-w old mice were analyzed via RT-qPCR. The results are shown as relative mRNA levels of the ML-diet group to the control-diet group. b Immunohistological analyses of CHOP and ATF4. Pancreases of 10-w old and 15-w old mice were stained with anti-CHOP or anti-ATF4 antibodies (green), anti-insulin antibodies (red), and DAPI (blue), observed under a confocal fluorescence microscope. 1–4, pancreas from a 10-w old mouse; 5–8, pancreas from a 15-w old mouse; 1, 2, 5, 6; stained with anti-CHOP antibodies; 3, 4, 7, 8; stained with anti-ATF4 antibodies. The ratio of the number of CHOP or ATF4-positive β-cells to total β-cells are shown in the lower panel; n = 6. CL and white bar, control group; ML and black bar, ML-diet group. All data are expressed as mean ± SEM. *, P < 0.05; **, P < 0.01
Fig. 5
Fig. 5
The effect of an ML-diet on the proliferation of β-cells in db/db mice. a Representative fluorescence image of a pancreas from a 10-w old db/db mouse stained with anti-PCNA antibodies (green), anti-insulin antibodies (red), and DAPI (blue). White triangles indicate PCNA-positive cells. Scale bar: 50 μm. The ratio of the number of PCNA-positive β-cells to total β-cell number is shown in the graph (right panel). b A representative fluorescence image of a pancreas from a 15-w old db/db mouse stained with anti-PDX1 antibodies (red), anti-insulin antibodies (green) and DAPI (blue). The ratio of the number of PDX1-positive cells to the total β-cell number is shown in the graph (right panel). c Expression levels of Pdx1 mRNA in the pancreas of a 15-w old db/db mouse were analyzed via RT-qPCR. The relative Pdx1 mRNA level of the ML group to the control group is shown. CL, control-diet group; ML, ML-diet group, n = 6. All data are expressed as mean ± SEM. **, P < 0.01 versus control
Fig. 6
Fig. 6
Hypothetical scheme representing the protective effect of an ML-diet on β-cells from dysfunction induced by ER stress

References

    1. Lingohr MK, Buettner R, Rhodes CJ. Pancreatic β-cell growth and survival-a role in obesity-linked type 2 diabetes? Trends Mol Med. 2002;8:375–384. doi: 10.1016/S1471-4914(02)02377-8. - DOI - PubMed
    1. World Health Organization . Global Report on Diabetes. World Health Organization. 2016. p. 88.
    1. Rhodes CJ. Type 2 diabetes - a matter of β-cell life and death? Science. 2005;307:380–384. doi: 10.1126/science.1104345. - DOI - PubMed
    1. Horvth B, Mukhopadhyay P, Hask G, Pacher P. The endocannabinoid system and plant-derived cannabinoids in diabetes and diabetic complications. Am J Pathol. 2012;180:432–442. doi: 10.1016/j.ajpath.2011.11.003. - DOI - PMC - PubMed
    1. Prentki M, Nolan C. Review series islet β cell failure in type 2 diabetes. J Clin Investig. 2006;116:1802–1812. doi: 10.1172/JCI29103. - DOI - PMC - PubMed