Review
. 2020 May 6;17(1):34.
doi: 10.1186/s12987-020-00195-3.

Measuring intracranial pressure by invasive, less invasive or non-invasive means: limitations and avenues for improvement

Affiliations
Review

Measuring intracranial pressure by invasive, less invasive or non-invasive means: limitations and avenues for improvement

Karen Brastad Evensen et al. Fluids Barriers CNS. .

Abstract

Sixty years have passed since neurosurgeon Nils Lundberg presented his thesis about intracranial pressure (ICP) monitoring, which represents a milestone for its clinical introduction. Monitoring of ICP has since become a clinical routine worldwide, and today represents a cornerstone in surveillance of patients with acute brain injury or disease, and a diagnostic of individuals with chronic neurological disease. There is, however, controversy regarding indications, clinical usefulness and the clinical role of the various ICP scores. In this paper, we critically review limitations and weaknesses with the current ICP measurement approaches for invasive, less invasive and non-invasive ICP monitoring. While risk related to the invasiveness of ICP monitoring is extensively covered in the literature, we highlight other limitations in current ICP measurement technologies, including limited ICP source signal quality control, shifts and drifts in zero pressure reference level, affecting mean ICP scores and mean ICP-derived indices. Control of the quality of the ICP source signal is particularly important for non-invasive and less invasive ICP measurements. We conclude that we need more focus on mitigation of the current limitations of today's ICP modalities if we are to improve the clinical utility of ICP monitoring.

Keywords: Intracranial pressure; Miniature pressure sensors; Non-invasive ICP; Pulsatile ICP; Static ICP.


Conflict of interest statement

Both the authors declares that they have no competing of interests.

Figures

Fig. 1
Fig. 1
The intracranial pressure–volume curve. There is a non-linear relationship between change in intracranial pressure (ICP) and intracranial volume (Volume). At the flat portion of the curve, the pressure–volume reserve or buffering capacity is good (i.e. the intracranial compartment accepts a rather large change in intracranial volume without resulting in increased ICP). This implies that intracranial elastance is low (intracranial compliance is high). At the vertical portion of the curve, a small change in intracranial volume causes a marked rise in ICP; pressure–volume reserve capacity is low (high intracranial elastance or low intracranial compliance). The pressure–volume curve was established from measuring mean ICP. In the context of pulsatile ICP, at the flat portion of the curve the net intracranial blood volume change during the cardiac beat (about 1 ml) causes a small single wave amplitude (< 3–4 mmHg). At the vertical portion of the curve, the same net intracranial blood volume change during the cardiac beat (about 1 ml) results in a much larger ICP wave amplitude (> 4–5 mmHg). From Wagshul et al. [32]
Fig. 2
Fig. 2
Overview of wire-based and wireless methods for ICP monitoring. The image on the right shows that ICP is measured via a ventricular (V) catheter placed within the cerebral ventricles, and dedicated ICP sensors implanted within the brain parenchyma (P), or via the ICP sensor placed within the epidural (E) location. The invasive ICP source signals are transferred to a monitor that may reveal the ICP scores. For example, the ICP scores may be shown as numerical values, trend plots, or as the single ICP waves. The image on the left illustrates implantable sensors to the ventricles or parenchyma wherein the communication between sensor and external receiver is wireless. Illustration: Øystein Horgmo, University of Oslo
Fig. 3
Fig. 3
Measurements of static versus pulsatile ICP. The static ICP (mean ICP) is an absolute pressure value measured against a reference pressure (here illustrated by the green line), not considering the pressure changes occurring during the cardiac cycle. The pulsatile ICP is the pulse pressure or the pressure changes occurring during the cardiac cycle (here illustrated by the blue line). A single ICP wave is characterized by an increase in pressure from diastolic minimum pressure to systolic maximum pressure (the peaks are illustrated by the red dots). The single ICP wave amplitude is the peak-to-peak pressure difference. Illustration: Øystein Horgmo, University of Oslo
Fig. 4
Fig. 4
Continuous ICP measurement from an individual with subarachnoid hemorrhage. Intracranial pressure was measured from two separate ICP sensors placed nearby in the right frontal lobe of an individual suffering from a subarachnoid hemorrhage 3 days before. The left upper window (a) presents the trend plots of mean ICP (MeanP, light green) and mean ICP wave amplitude (MeanWave AMP, darker green) measured from a Camino ICP sensor, and the lower left window the trend plots of mean ICP (MeanP, light green) and mean ICP wave amplitude (MeanWave AMP, darker green) measured from a Codman ICP sensor. Average values from the Camino ICP sensor (upper window) are Mean ICP 20.6 mmHg, Mean Wave AMP (amplitude) 4.3 mmHg, Mean wave RT (Rise time) 0.24 s, Mean Wave RT Coeff (Rise time coefficient) 20.9 mmHg/seconds. Average values of the Codman ICP sensor (lower window) are Mean ICP 14.1 mmHg, Mean Wave AMP (amplitude) 4.5 mmHg, Mean wave RT (Rise time) 0.23 s, Mean Wave RT Coeff (Rise time coefficient) 23 mmHg/seconds. In (b) the ICP waveform of the Camino (left upper window) and Codman (left lower window) ICP sensors are shown. The ICP scores are presented in the right windows. Despite close to identical ICP waveform from the Camino and Codman ICP sensors, the mean ICP differed substantially (mean ICP of Camino ICP 35.2 mmHg and mean ICP of Codman 16 mmHg). Subfigure (c) presents the ICP waveforms at a later time point. The Camino recording is shown in the left upper window and the Codman recording in the left lower window. At this time point, the mean ICP was lower in the Camino (6.0 mmHg) than Codman ICP sensors (mean ICP 13.9 mmHg); the ICP waveforms were close to identical. The pressure recording was retrieved from a pressure quality registry at Oslo university hospital (Approval 2014/4720)
Fig. 5
Fig. 5
Impact of electrostatic discharges (ESDs) on mean ICP. Results from bench testing of commercial ICP sensors exposed to ESDs. The continuous pressure signal from a Codman MicroSensor is presented before and after ESD in three individuals showing (a) a sudden decline in ICP, (b) a sudden rise in ICP, and (c) a gradual reduction in ICP. Bench testing of a Raumedic Neurovent P sensor exposed to ESDs caused (d) a gradual increase in ICP, or (e) a gradual decline in ICP. Repeated ESDs causing a stepwise increase in ICP are shown in (f). The baseline pressure level (mmHg) is shown on the y-axis and time (minutes) on the x-axis. The ESD is indicated by an arrow. Notably, the ESDs were of small magnitude. When the test person was charged to 0.5 kV, the ESD delivered to the ICP sensor was typically 0.5 kV pulse peak. Charging to 5 kV gave a potential charge of 2.5 kV (2–5 kV). ESDs < 3 kV provoked few unpleasant sensations for the test person, while ESDs of about 5 kV gave unpleasant sensations. Adapted from Eide and Bakken [88]
Fig. 6
Fig. 6
The different types of baseline pressure errors (BPEs). Graphical illustration of the different types of BPEs. a BPE Type 1 is characterized by a constant offset of reference pressure (e.g. due to incorrect zeroing or calibration failure). b BPE Type 2 is related to a sudden shift in baseline pressure. One cause may be ESDs, as illustrated in Fig. 7 a–b. c BPE Type 3 is related to a gradual and large magnitude change in baseline pressure. This type is typical for drift of ICP sensor reference pressure or may be caused by ESDs (see Fig. 7 c–f). Notably, these different types may occur together during ongoing ICP monitoring. From Eide et al. [92]
Fig. 7
Fig. 7
Occurrence of BPEs during ICP monitoring. In a prospective study, we examined the frequency and magnitude of BPEs in patients undergoing surveillance for SAH. Two Raumedic Neuro P sensors were placed nearby via the same burr hole in the skull. The different types of BPEs are illustrated. The trend plots in blue reveal differences in mean ICP computed for consecutive 6-second time windows (Mean ICPSignal 2 – Mean ICPSignal 1), and the green plots show differences in MWA (MWASignal 2 – MWASignal 1) of Signals 1 and 2, for the same 6-second time windows. The presence of PBEs is indicated by the differences in mean ICP, but with close to identical MWAs (differences in MWA < 0.5 mmHg). The red arrows indicate occurrence of BPEs. These plots are from different individuals. Type 2 BPE is shown in (a) and (b), while various examples of Type 3 BPEs are presented in (c), (d), (e) and (f). Adapted from Eide et al. [92]
Fig. 8
Fig. 8
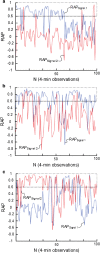
Impact of BPEs on determination of the mean ICP-derived score RAP. From different individuals undergoing ICP monitoring as part of surveillance of SAH, RAP was measured from two nearby Raumedic Neurovent P sensors placed via the same burr hole. Thereby the sensors measure ICP from the same compartment without pressure gradients. Trend plots of RAP [correlation coefficient (R) between the intracranial pressure (ICP) wave amplitude (A) and the mean ICP level (P)] of signals 1 and 2 are presented for three individuals. RAP was determined during 100 consecutive 4-minute periods for signals 1 (blue line) and 2 (red line). The horizontal lines at RAP 0.6 illustrate a commonly used upper normal threshold for RAP. a In this individual, the average of RAPSignal 1 was 0.50 (blue line) and the average of RAPSignal 2 − 0.04 (red line). b In this individual, the average of RAPSignal 1 was 0.64 (blue line) while average of RAPSignal 2 was 0.16 (red line). c In this individual, the average of RAPSignal 1 was 0.17 (blue line), and the average of RAPSignal 2 0.59 (red line). Adapted from Eide et al. [61]
Fig. 9
Fig. 9
Differences between the time- and frequency-domain methods for estimating ICP scores. The pressure waveforms are usually presented in the time domain (upper panel). The single ICP waves are shown as the blue waveform and the arterial BP as the red waveform (PPG, photoplethysmograph, in this case). The lower plots present the pressure data analyzed in the frequency domain, represented as a function of frequency. The signal and the defined cardiac components separated from low frequency components such as respiration can be analyzed independently. Additional information available with frequency domain analysis is the phase, the frequency domain analog of timing in the time domain (not shown). The phase plot allows analysis of timing differences between the ICP and the reference waveform for each identified frequency component. From Wagshul et al. [32]
Fig. 10
Fig. 10
B waves are elevations of mean ICP that may have different patterns. Column A illustrates the trend of mean ICP and column B the computer-generated examples. (1) B waves with symmetrical shape and amplitude < 10 mmHg. (2) B waves with symmetrical shape and amplitude > 10 mmHg. (3) Symmetrical B waves with plateau. (4) Asymmetrical B waves. The timescale is in the order of minutes. It should be noted that amplitudes of B waves and single ICP waves are fundamentally different. From Martinez-Tejada et al. [112]
Fig. 11
Fig. 11
Tympanic membrane pressure (TMP) as a surrogate marker of intracranial pressure. (a) Schematic illustration of the anatomical structures involved in measurements of TMP waveforms. The non-invasive TMP waveforms were measured in the outer ear and used as input for the estimation of non-invasive ICP. ICP ICP input signal, CA cochlear aqueduct, OW oval window, RW round window, T tympanic membrane, and S sensor. (b) An example showing 6 seconds of the input signals and the corresponding transfer function estimate based on a total 10 minutes are shown in b1 and b2, respectively. The resulting output from the combination of b1 and the inverse of b2 is presented in b3. (c) The non-invasive ICP waveform estimate (nICP, interrupted red line) is shown together with the invasive ICP waveform (continuous red line) for four different 6-second time windows after the beginning of the measurement. The time delay between the nICP and ICP signals, as seen in b1, has been removed for visual comparison. Adapted from Evensen et al. [177]

References

    1. Mokri B. The Monro-Kellie hypothesis: applications in CSF volume depletion. Neurology. 2001;56:1746–1748. doi: 10.1212/WNL.56.12.1746. - DOI - PubMed
    1. Sahuquillo J, Poca MA, Arribas M, Garnacho A, Rubio E. Interhemispheric supratentorial intracranial pressure gradients in head-injured patients: are they clinically important? J Neurosurg. 1999;90:16–26. doi: 10.3171/jns.1999.90.1.0016. - DOI - PubMed
    1. Miller JD, Stanek A, Langfitt TW. Concepts of cerebral perfusion pressure and vascular compression during intracranial hypertension. Prog Brain Res. 1972;35:411–432. doi: 10.1016/S0079-6123(08)60102-8. - DOI - PubMed
    1. Le Roux P, Menon DK, Citerio G, Vespa P, Bader MK, Brophy GM, Diringer MN, Stocchetti N, Videtta W, Armonda R. Consensus summary statement of the international multidisciplinary consensus conference on multimodality monitoring in neurocritical care. Neurocrit Care. 2014;21:1–26. doi: 10.1007/s12028-014-0041-5. - DOI - PMC - PubMed
    1. Rosner MJ, Rosner SD, Johnson AH. Cerebral perfusion pressure: management protocol and clinical results. J Neurosurg. 1995;83:949–962. doi: 10.3171/jns.1995.83.6.0949. - DOI - PubMed

MeSH terms