

doi: 10.1053/j.gastro.2020.04.071.
Epub 2020 May 4.
Changes in Gastroenterology and Endoscopy Practices in Response to the Coronavirus Disease 2019 Pandemic: Results From a North American Survey
Collaborators,
Affiliations
- PMID: 32376410
- PMCID: PMC7196540
- DOI: 10.1053/j.gastro.2020.04.071
Item in Clipboard
Changes in Gastroenterology and Endoscopy Practices in Response to the Coronavirus Disease 2019 Pandemic: Results From a North American Survey
Gastroenterology.
2020 Aug.
No abstract available
Keywords: COVID-19; Clinical Practice; Endoscopy; Gastroenterology.
Figures
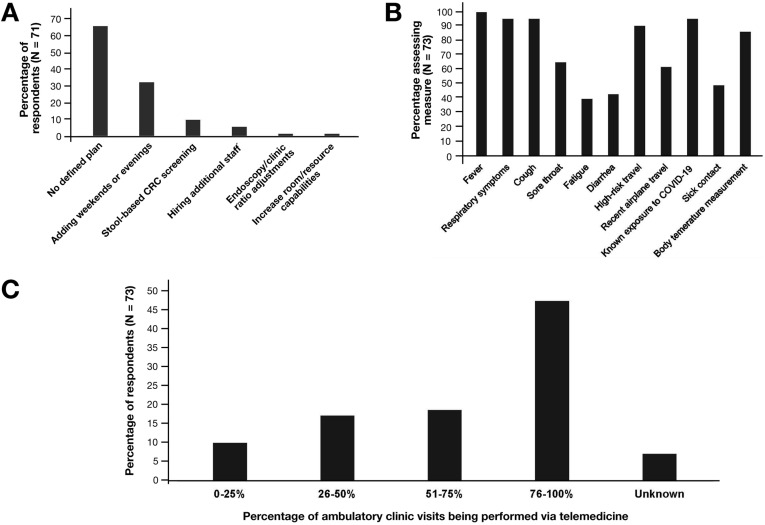
(A) Institutions’ plan(s) to manage the backlog of endoscopic procedures postponed during the COVID-19 pandemic once current restrictions on elective endoscopy are lifted. (B) Proportions of institutions screening for COVID-19 symptoms, exposure history, or performing body temperature measurements. (C) Proportions of institutions’ ambulatory clinic visits currently performed via telemedicine.
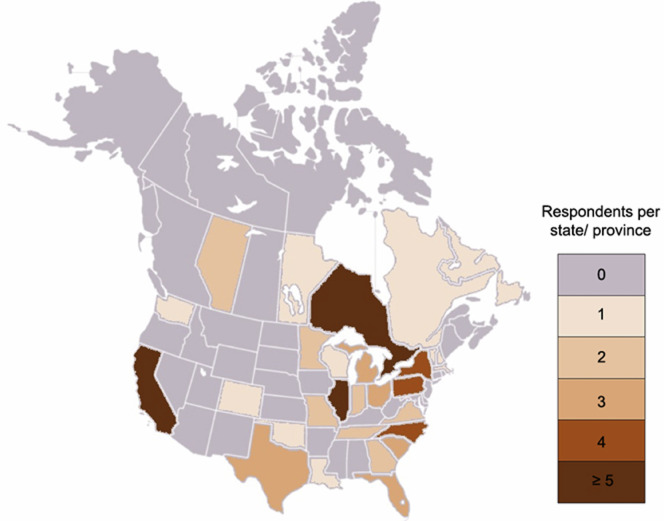
Choropleth map demonstrating numbers of survey respondents by state and province.
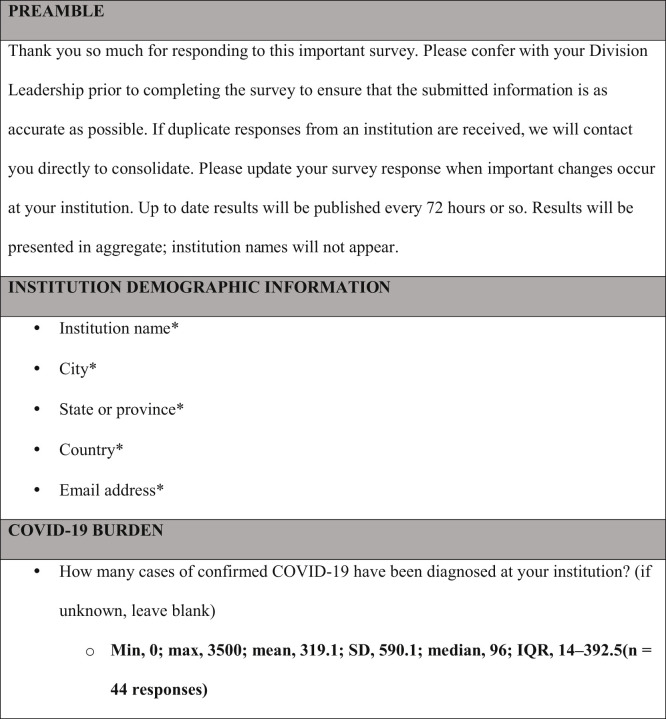
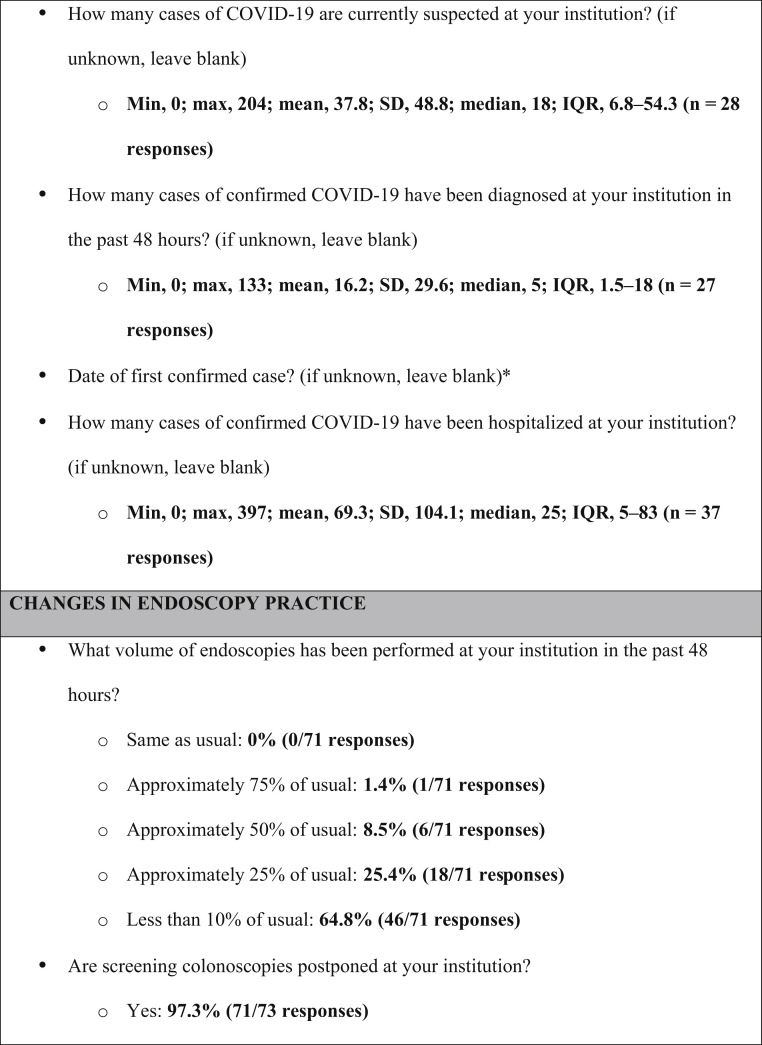
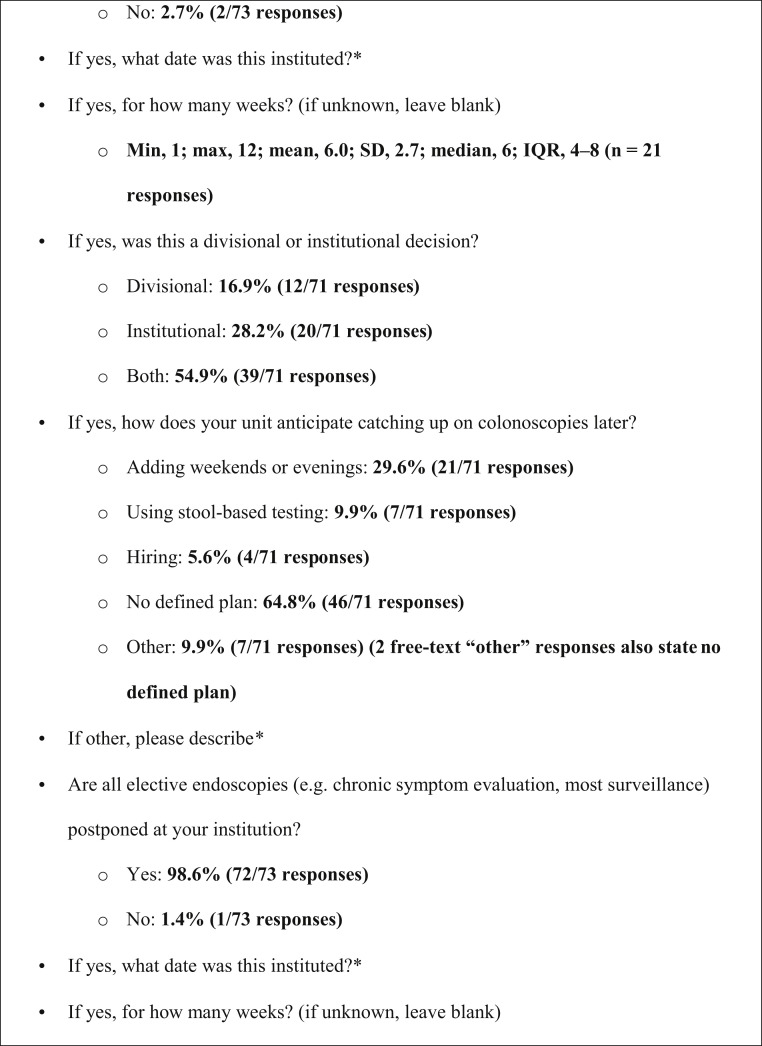
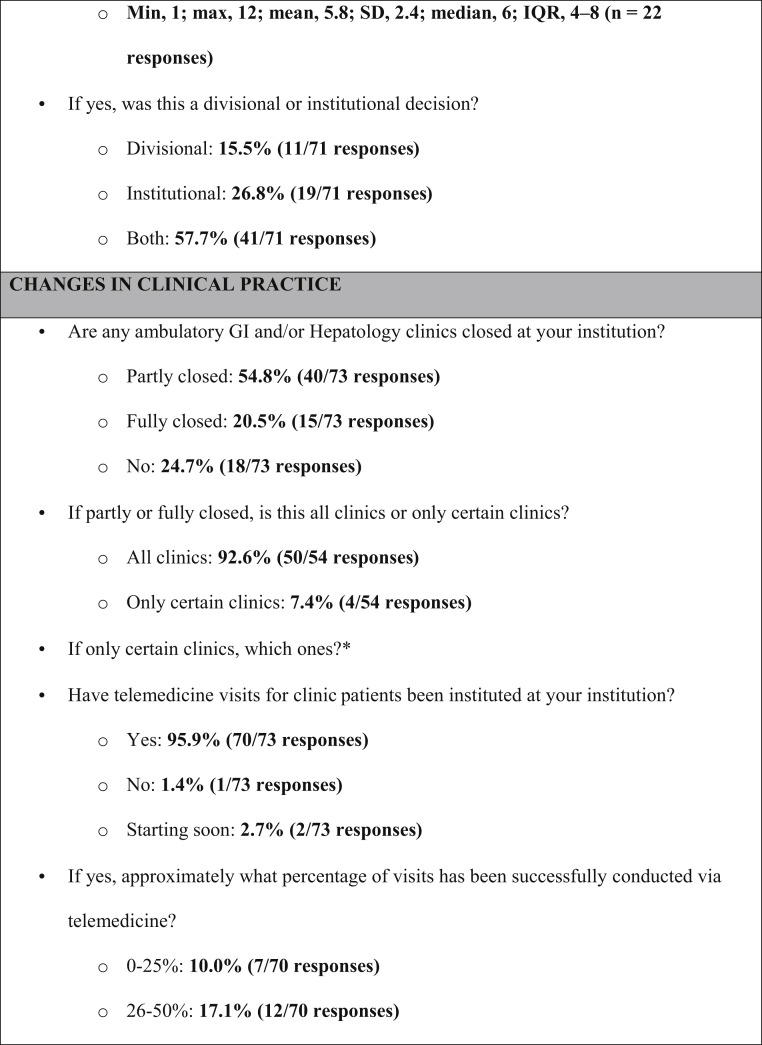
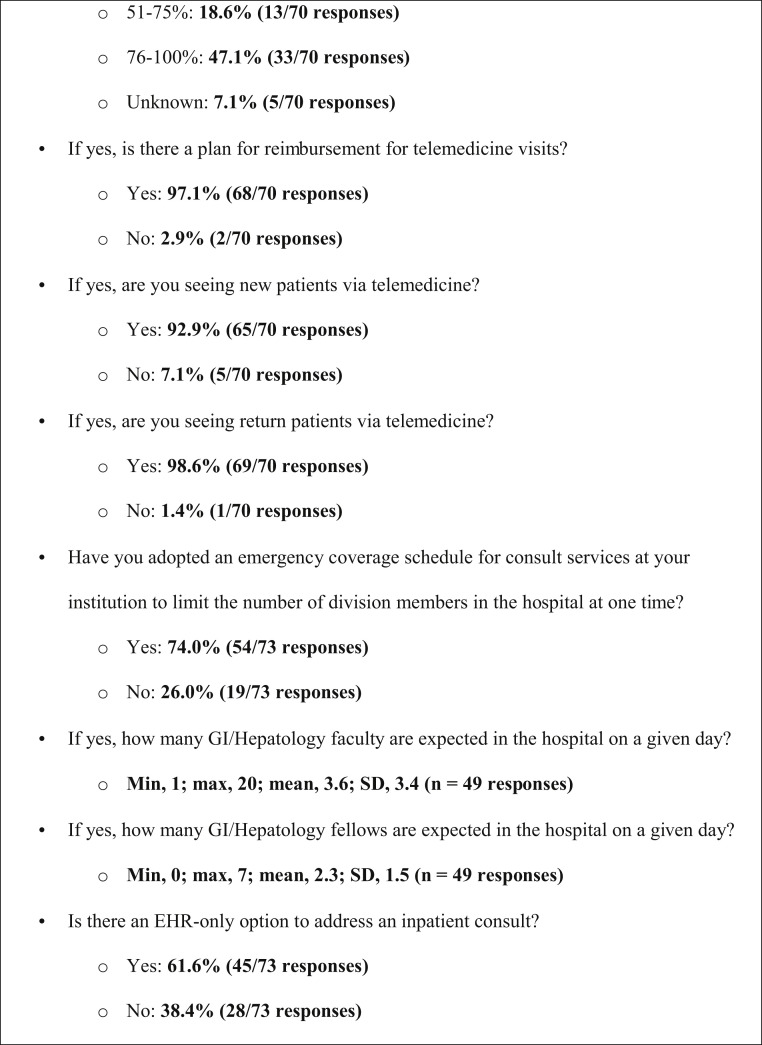
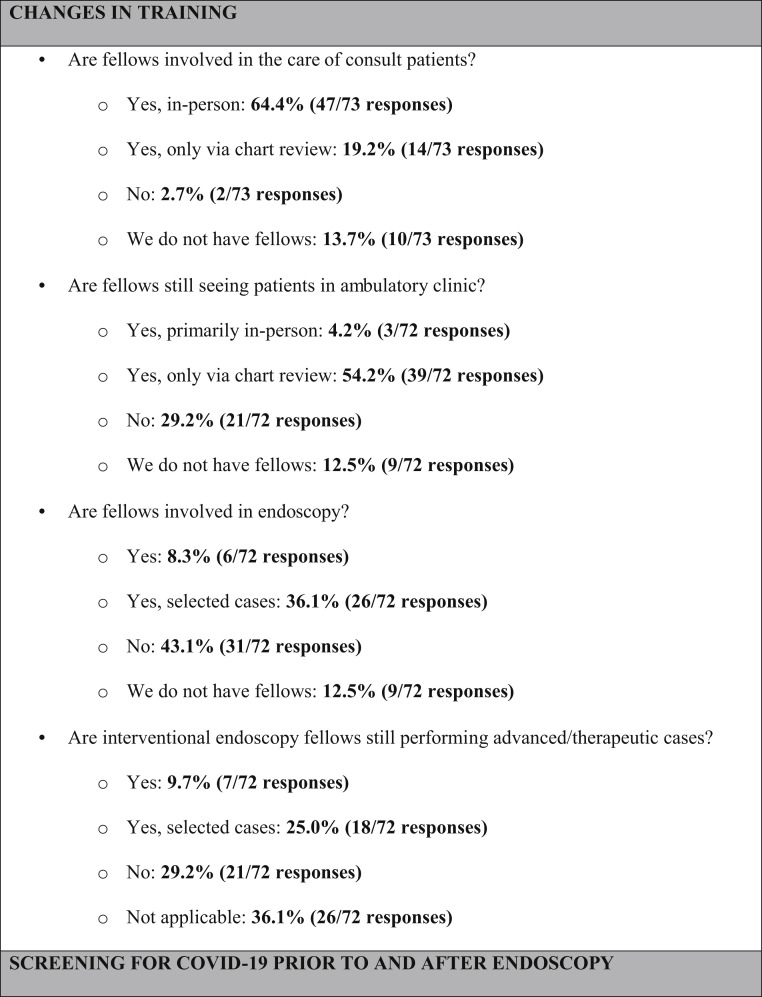
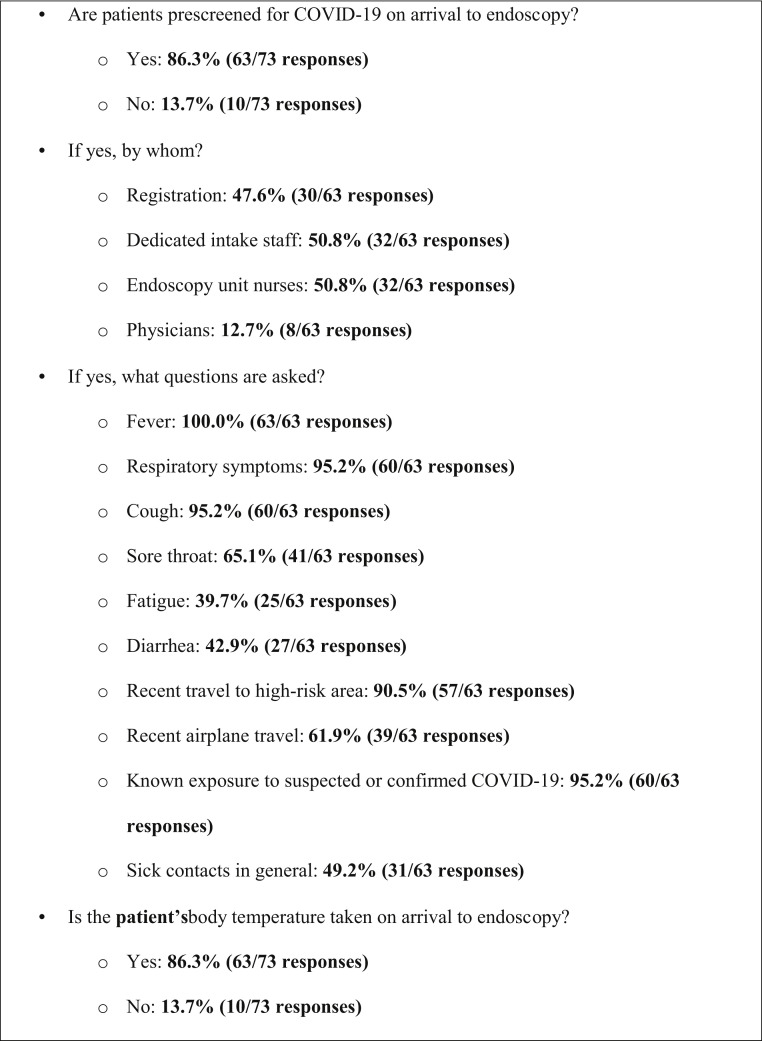
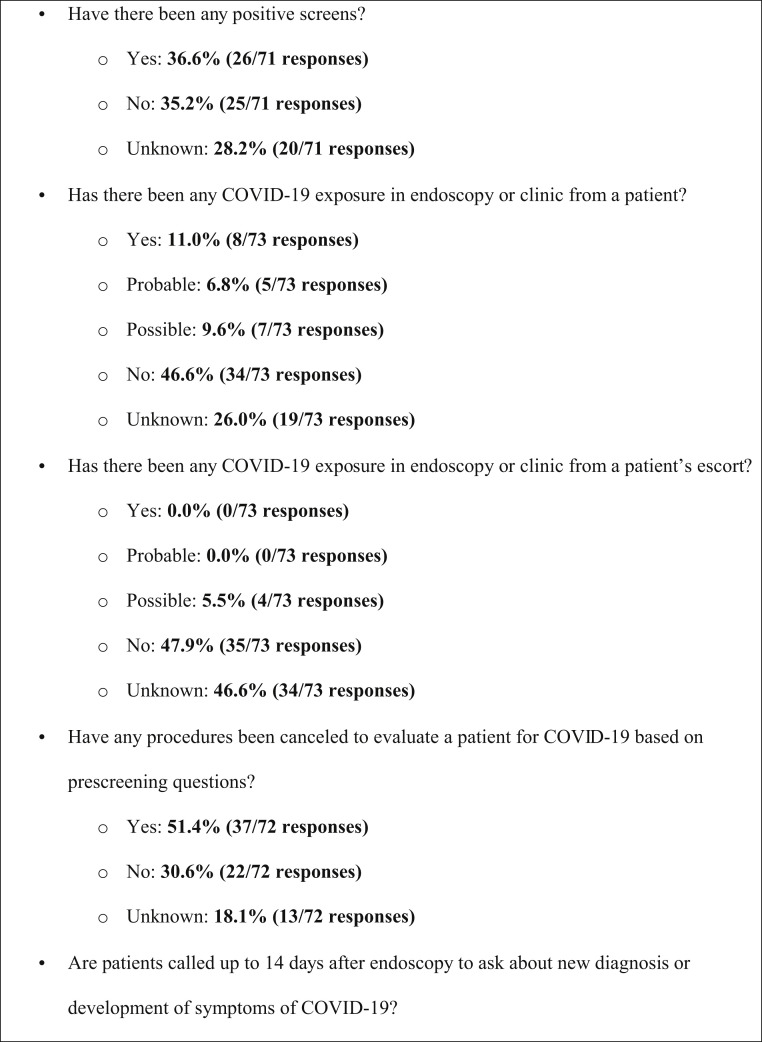
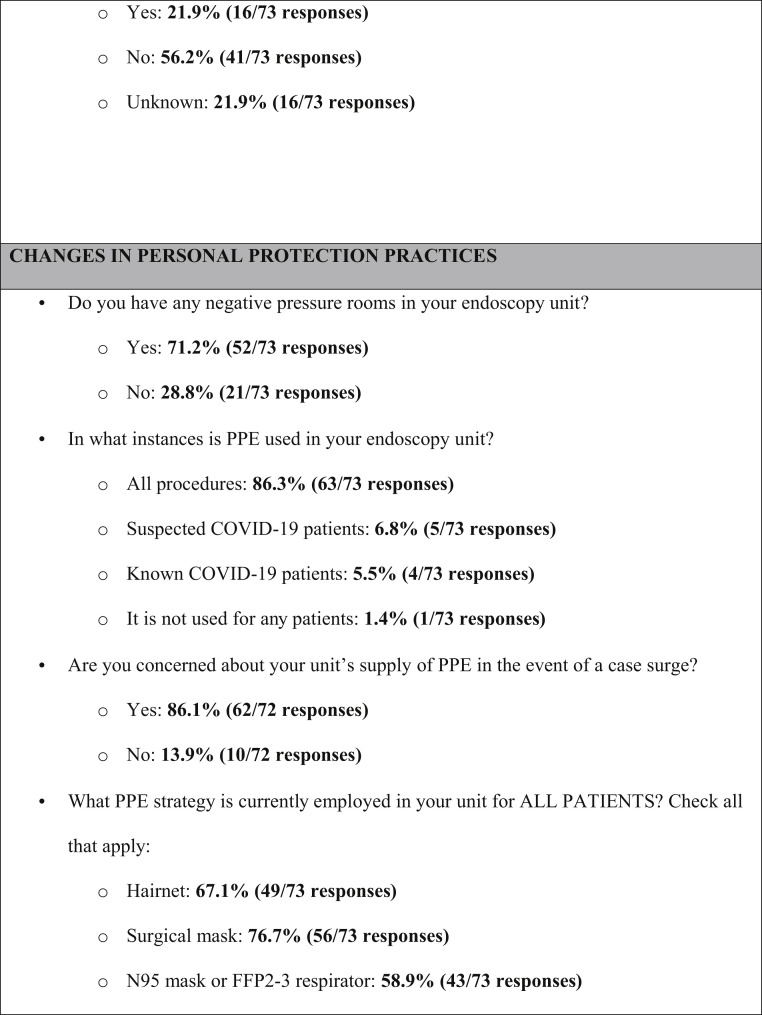
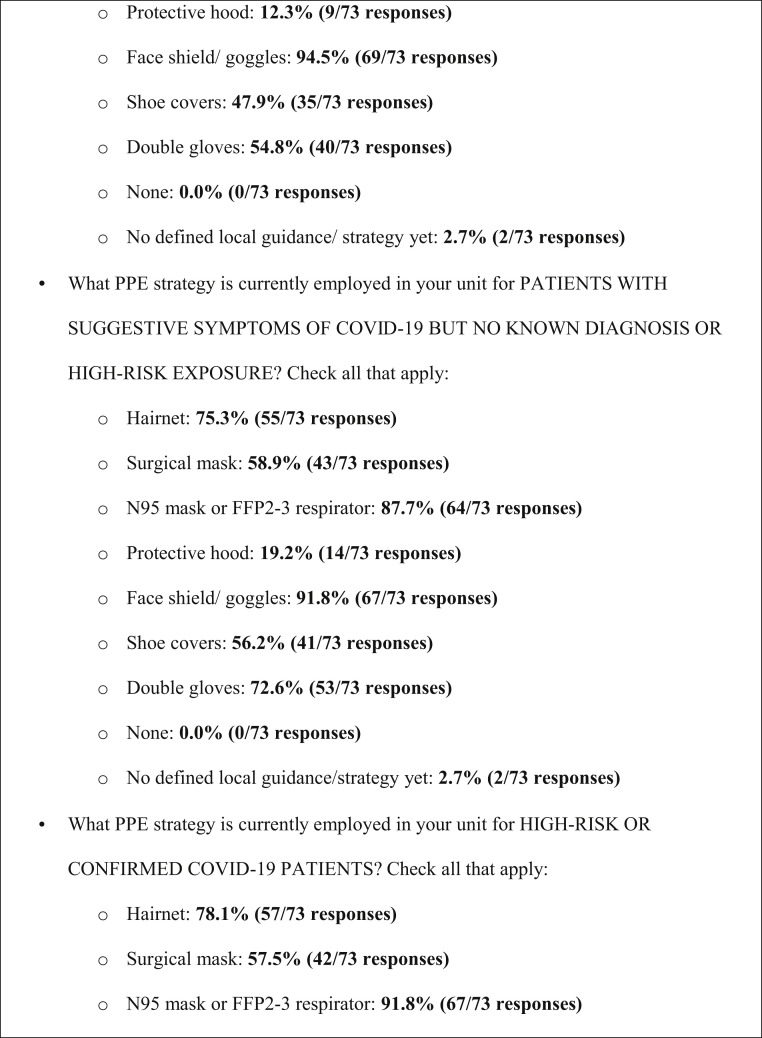
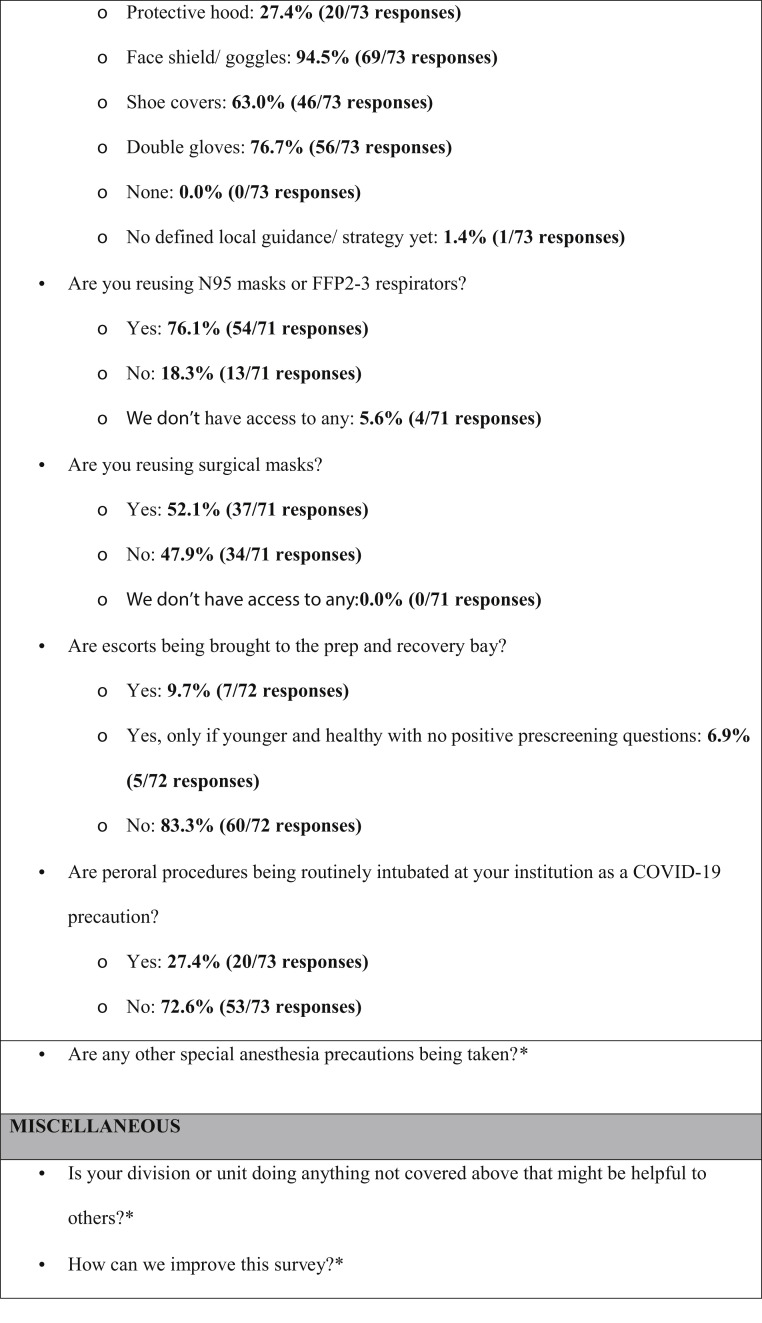
Survey instrument and aggregate responses (in bold). ∗Qualitative responses by free text—no aggregate answers reported. IQR, interquartile range; max, maximum; min, minimum; SD, standard deviation.
Survey instrument and aggregate responses (in bold). ∗Qualitative responses by free text—no aggregate answers reported. IQR, interquartile range; max, maximum; min, minimum; SD, standard deviation.
Survey instrument and aggregate responses (in bold). ∗Qualitative responses by free text—no aggregate answers reported. IQR, interquartile range; max, maximum; min, minimum; SD, standard deviation.
Survey instrument and aggregate responses (in bold). ∗Qualitative responses by free text—no aggregate answers reported. IQR, interquartile range; max, maximum; min, minimum; SD, standard deviation.
Survey instrument and aggregate responses (in bold). ∗Qualitative responses by free text—no aggregate answers reported. IQR, interquartile range; max, maximum; min, minimum; SD, standard deviation.
Survey instrument and aggregate responses (in bold). ∗Qualitative responses by free text—no aggregate answers reported. IQR, interquartile range; max, maximum; min, minimum; SD, standard deviation.
Survey instrument and aggregate responses (in bold). ∗Qualitative responses by free text—no aggregate answers reported. IQR, interquartile range; max, maximum; min, minimum; SD, standard deviation.
Survey instrument and aggregate responses (in bold). ∗Qualitative responses by free text—no aggregate answers reported. IQR, interquartile range; max, maximum; min, minimum; SD, standard deviation.
Survey instrument and aggregate responses (in bold). ∗Qualitative responses by free text—no aggregate answers reported. IQR, interquartile range; max, maximum; min, minimum; SD, standard deviation.
Survey instrument and aggregate responses (in bold). ∗Qualitative responses by free text—no aggregate answers reported. IQR, interquartile range; max, maximum; min, minimum; SD, standard deviation.
Survey instrument and aggregate responses (in bold). ∗Qualitative responses by free text—no aggregate answers reported. IQR, interquartile range; max, maximum; min, minimum; SD, standard deviation.
References
-
- Johnston E.R. Gastrointest Endosc. 2019;89:818–824. - PubMed
-
- American Society for Gastrointestinal Endoscopy. https://www.asge.org/home/advanced-education-training/covid-19-asge-upda... Available at:
MeSH terms
Grants and funding
LinkOut - more resources
Full Text Sources
Medical
