. 2020 Jun:195:108043.
doi: 10.1016/j.exer.2020.108043. Epub 2020 May 4.

Transcriptomics analysis of pericytes from retinas of diabetic animals reveals novel genes and molecular pathways relevant to blood-retinal barrier alterations in diabetic retinopathy

Affiliations

Transcriptomics analysis of pericytes from retinas of diabetic animals reveals novel genes and molecular pathways relevant to blood-retinal barrier alterations in diabetic retinopathy

Sampathkumar Rangasamy et al. Exp Eye Res. 2020 Jun.

Abstract

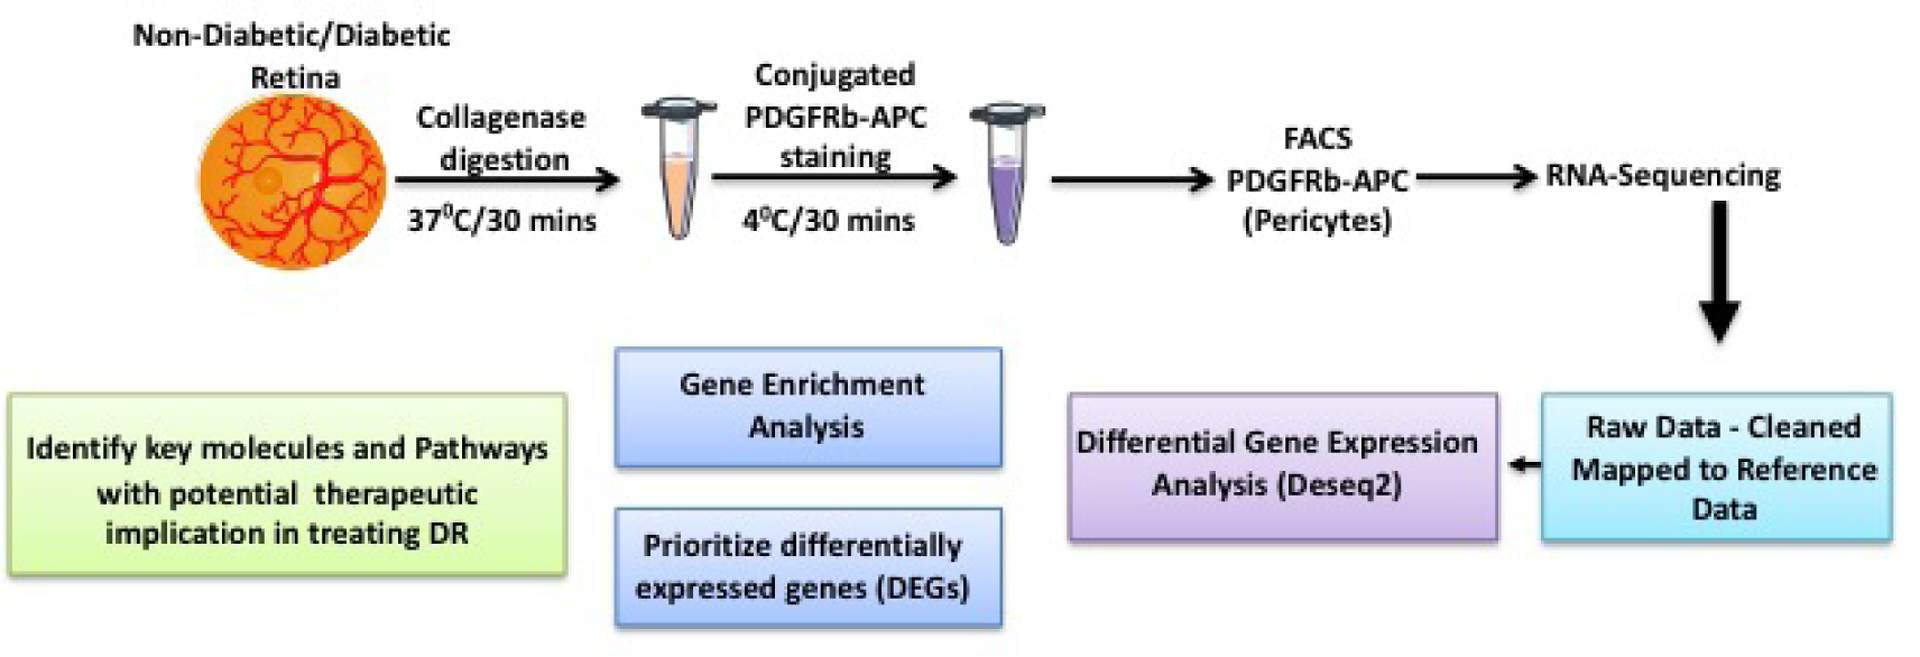
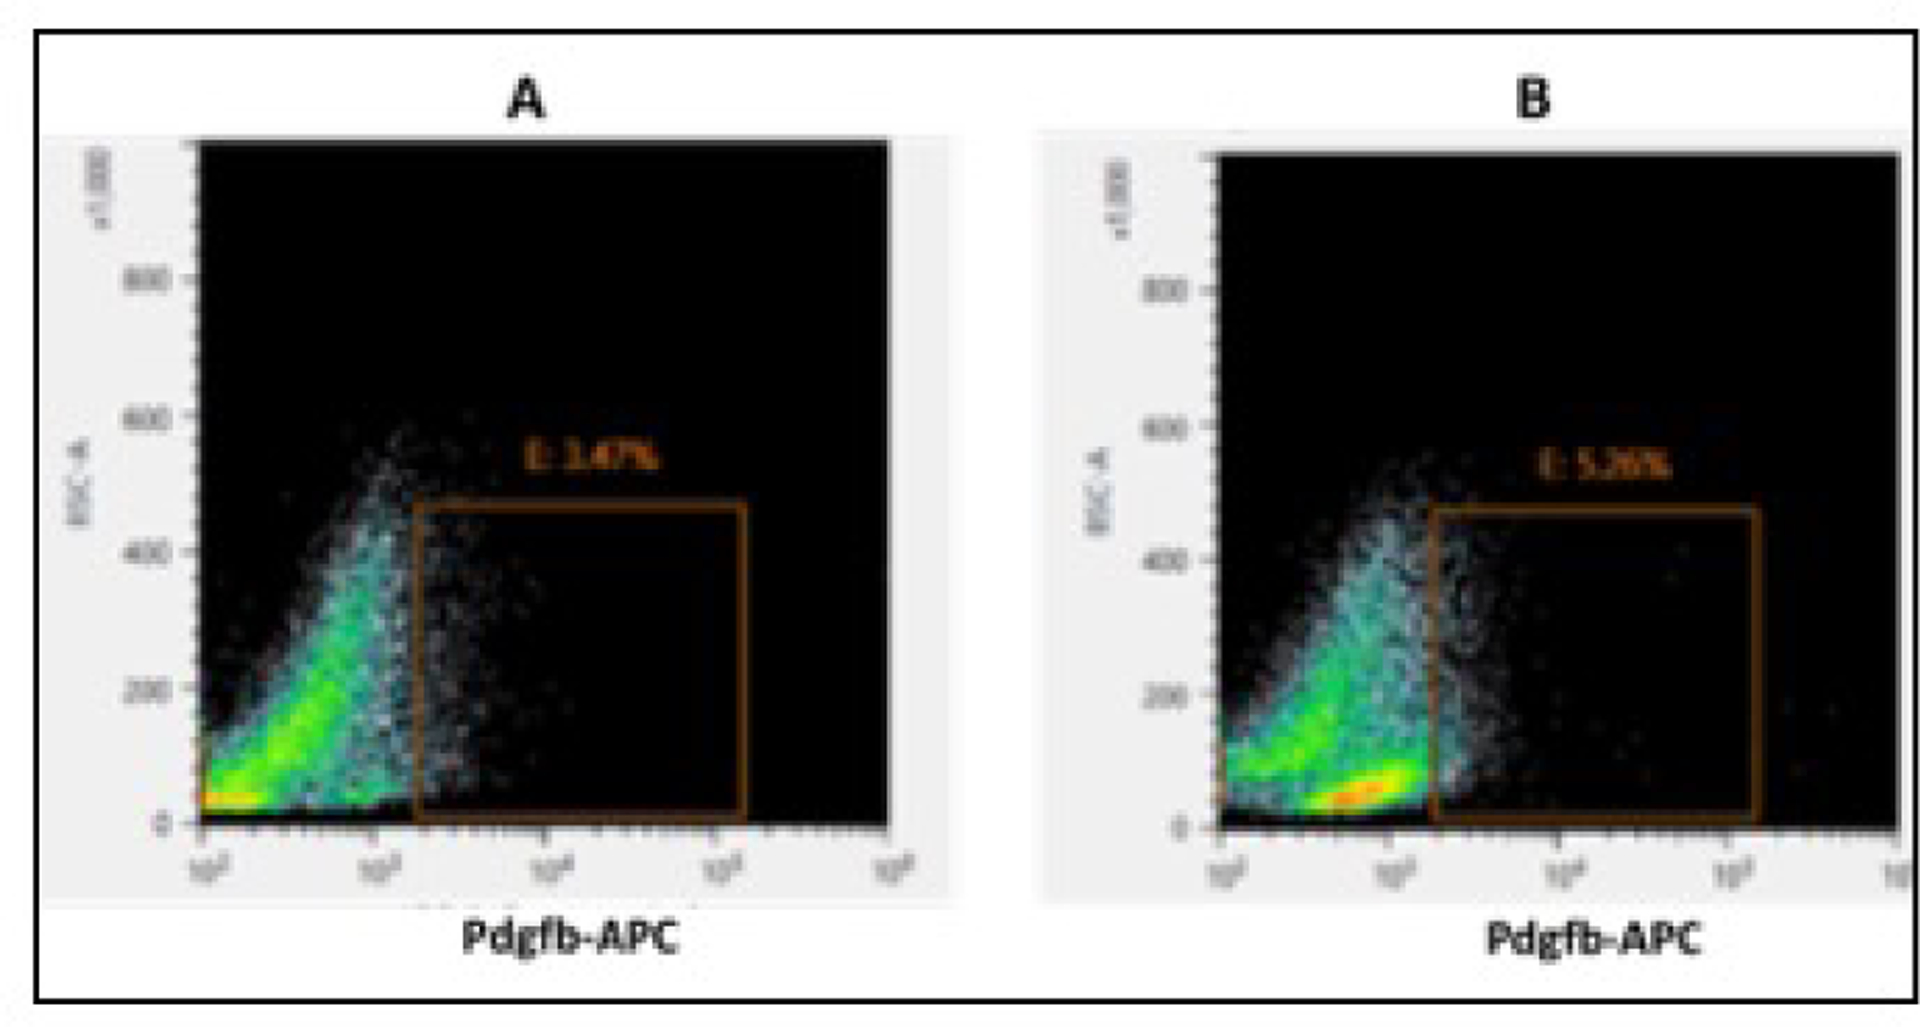
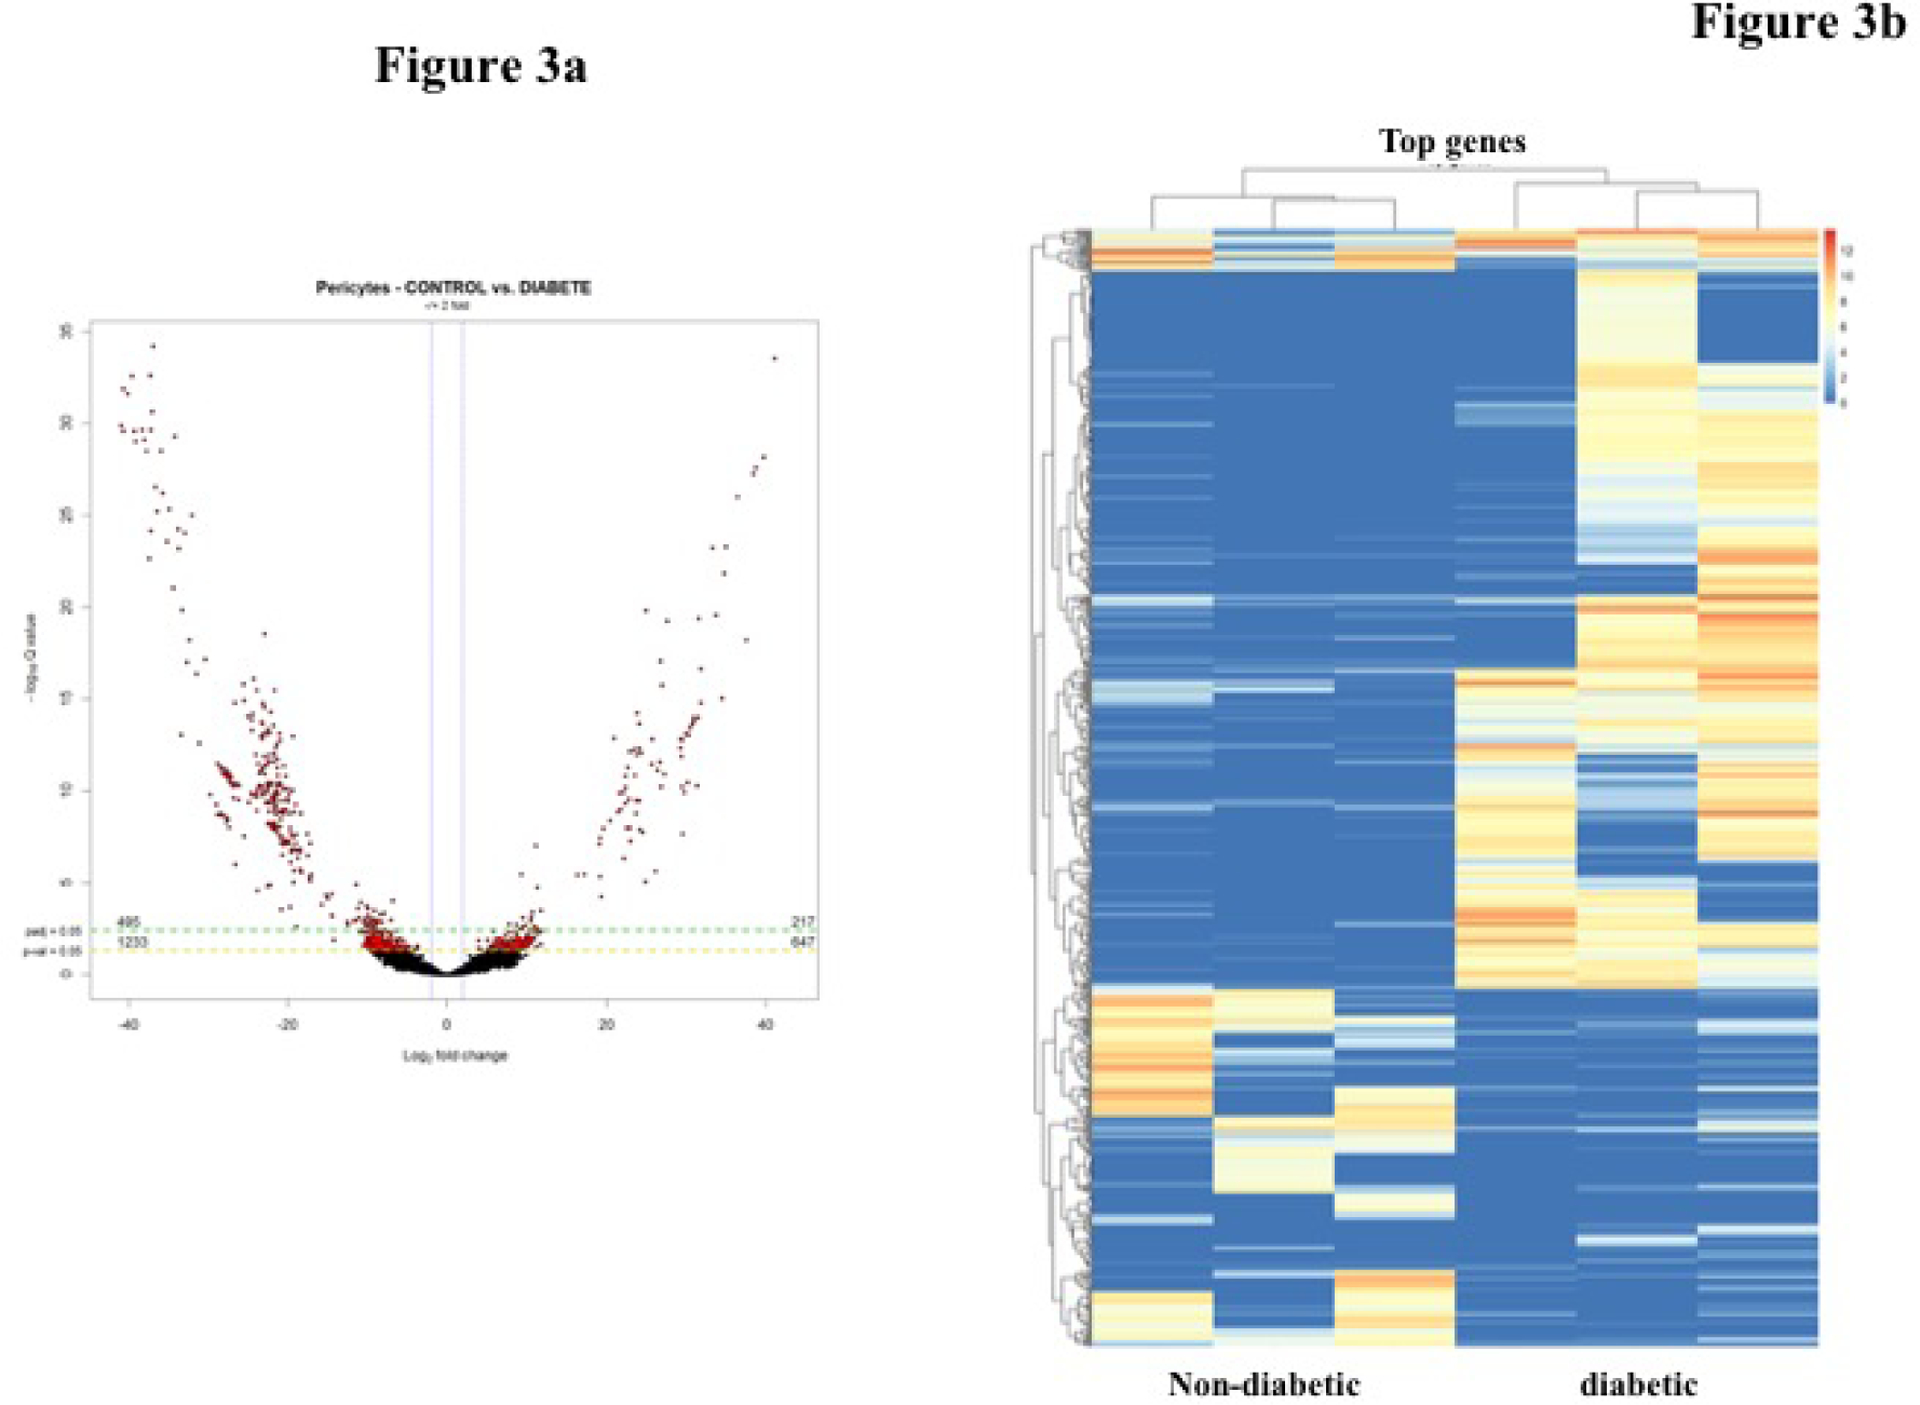
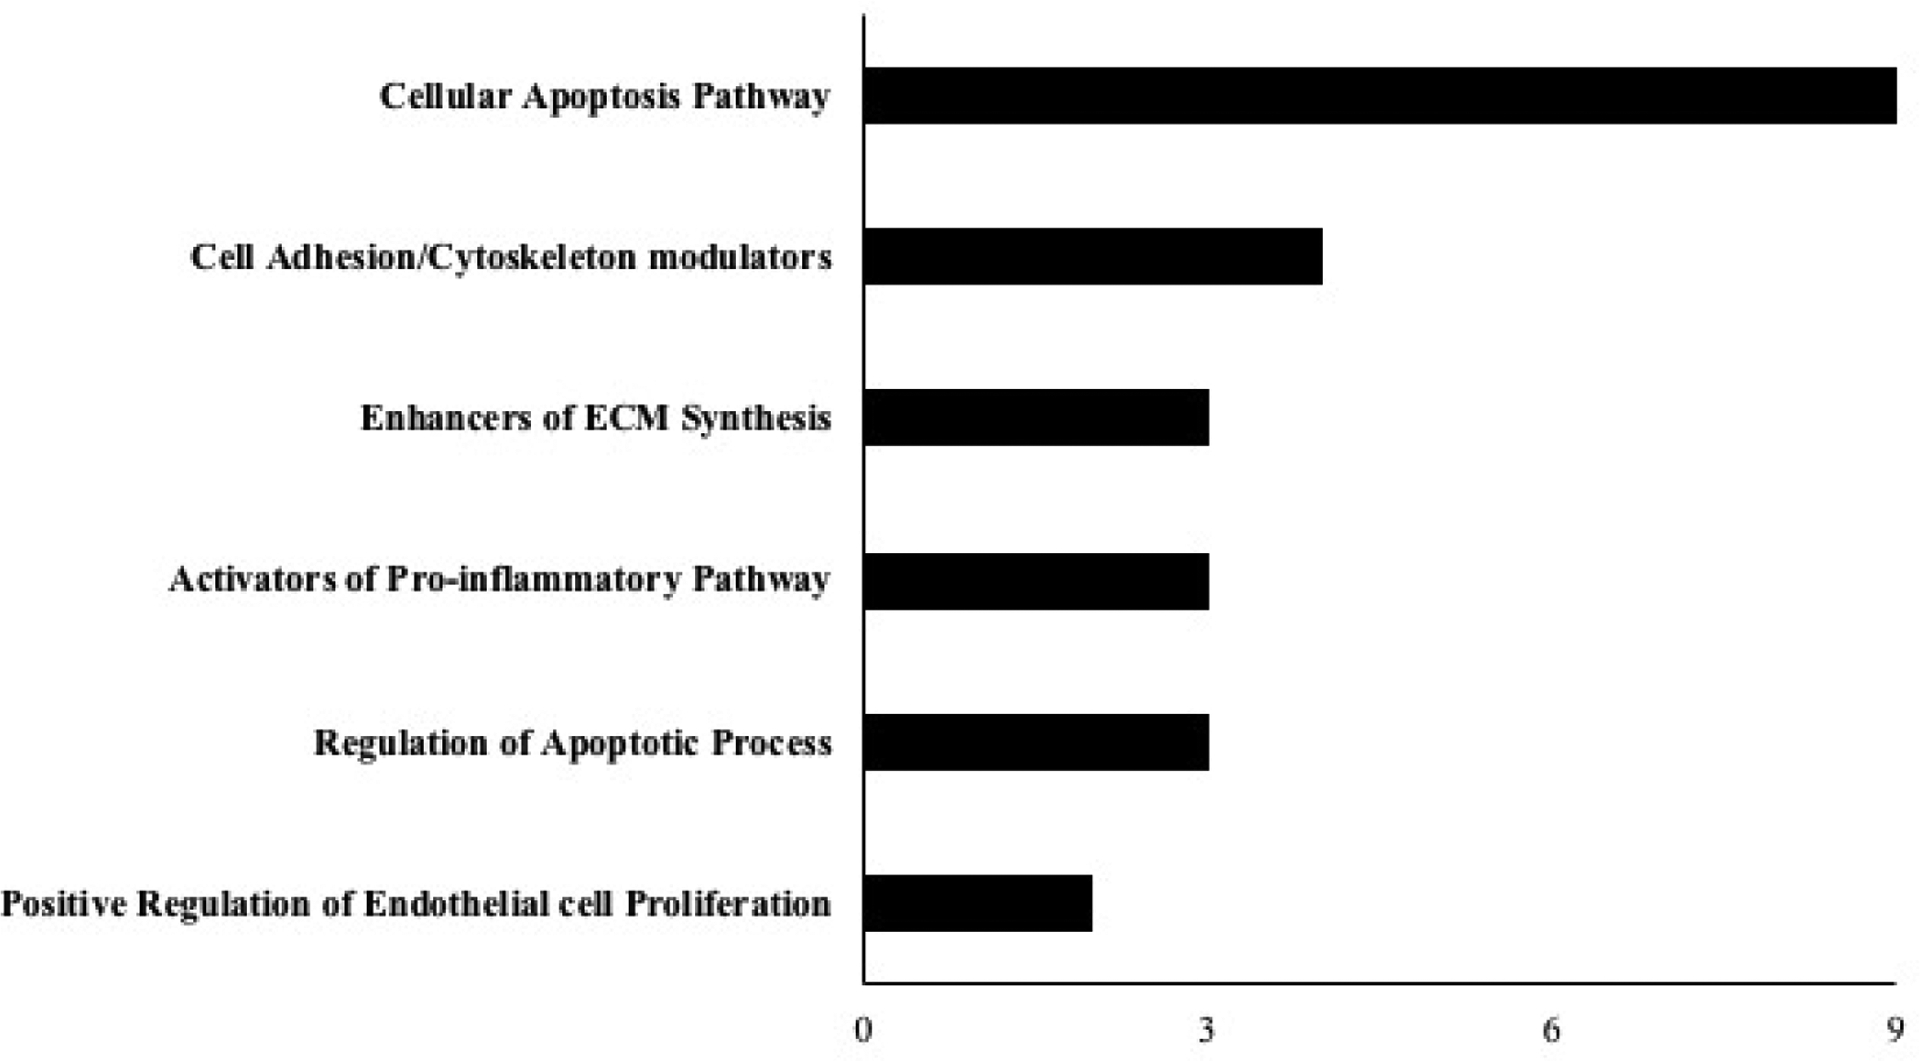
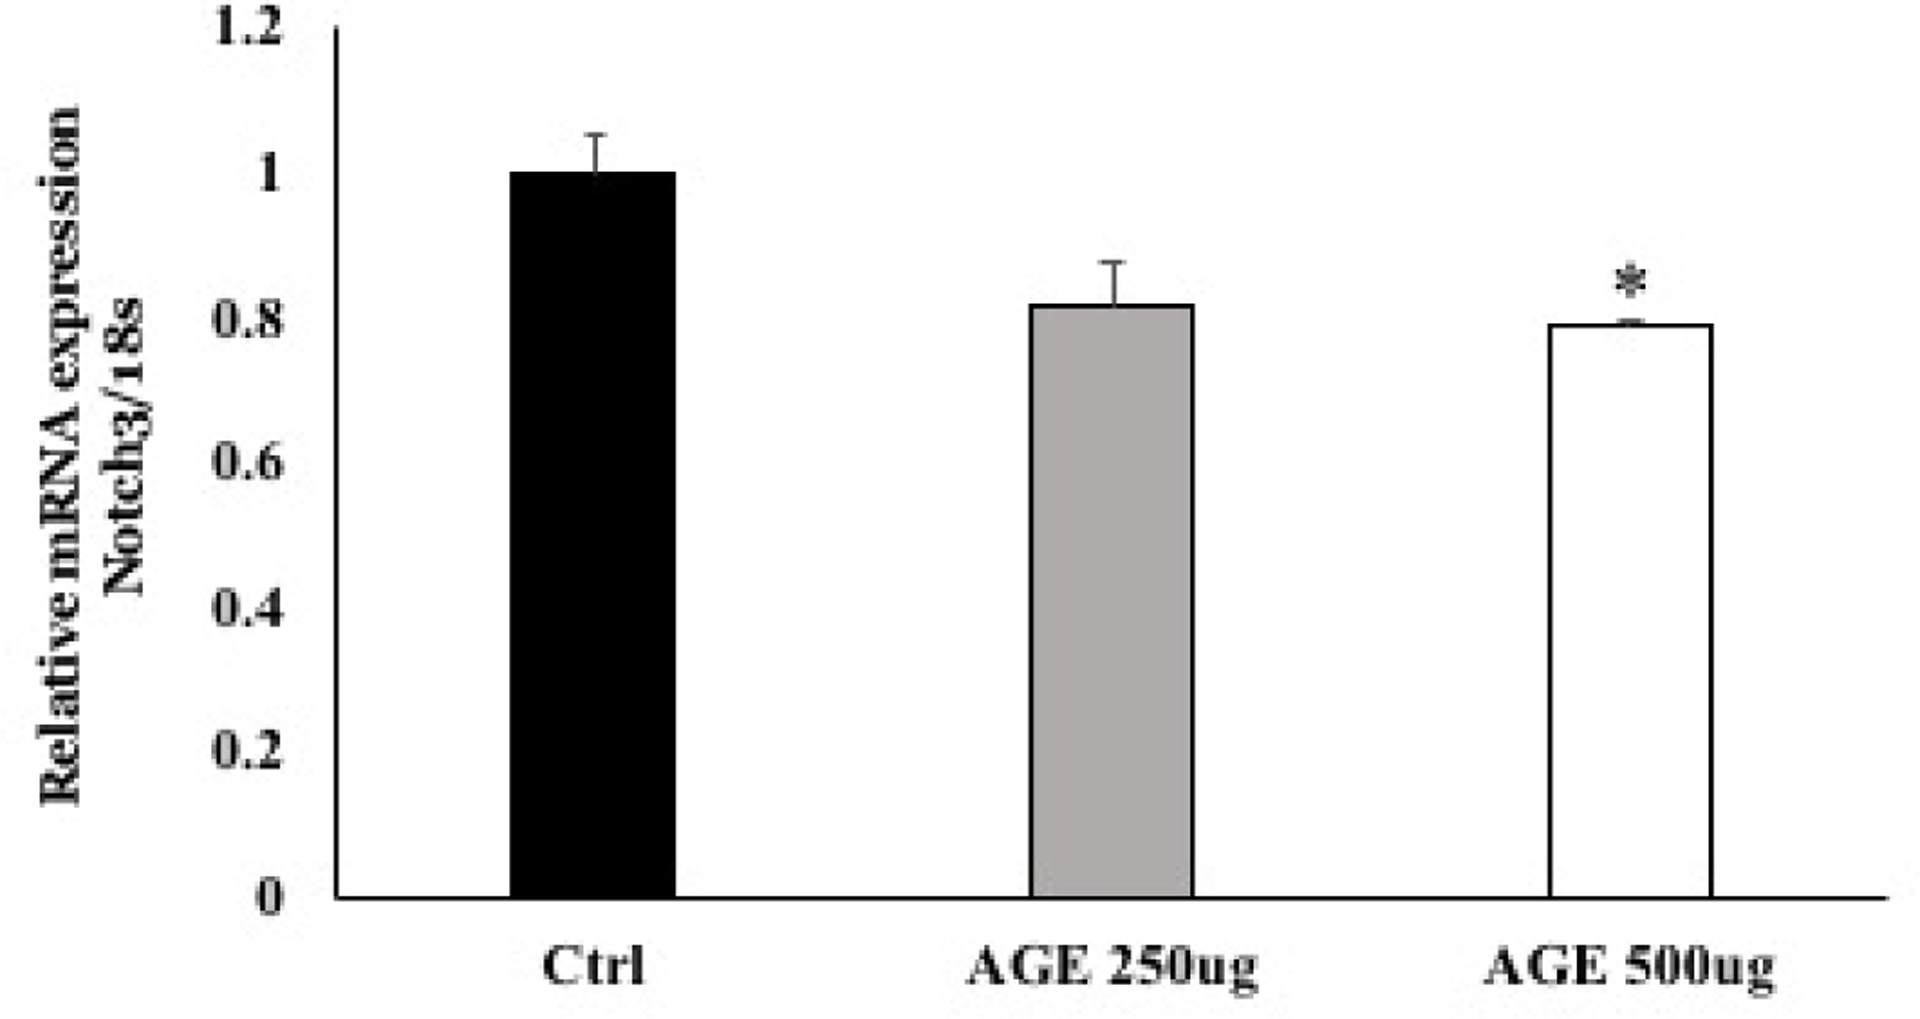
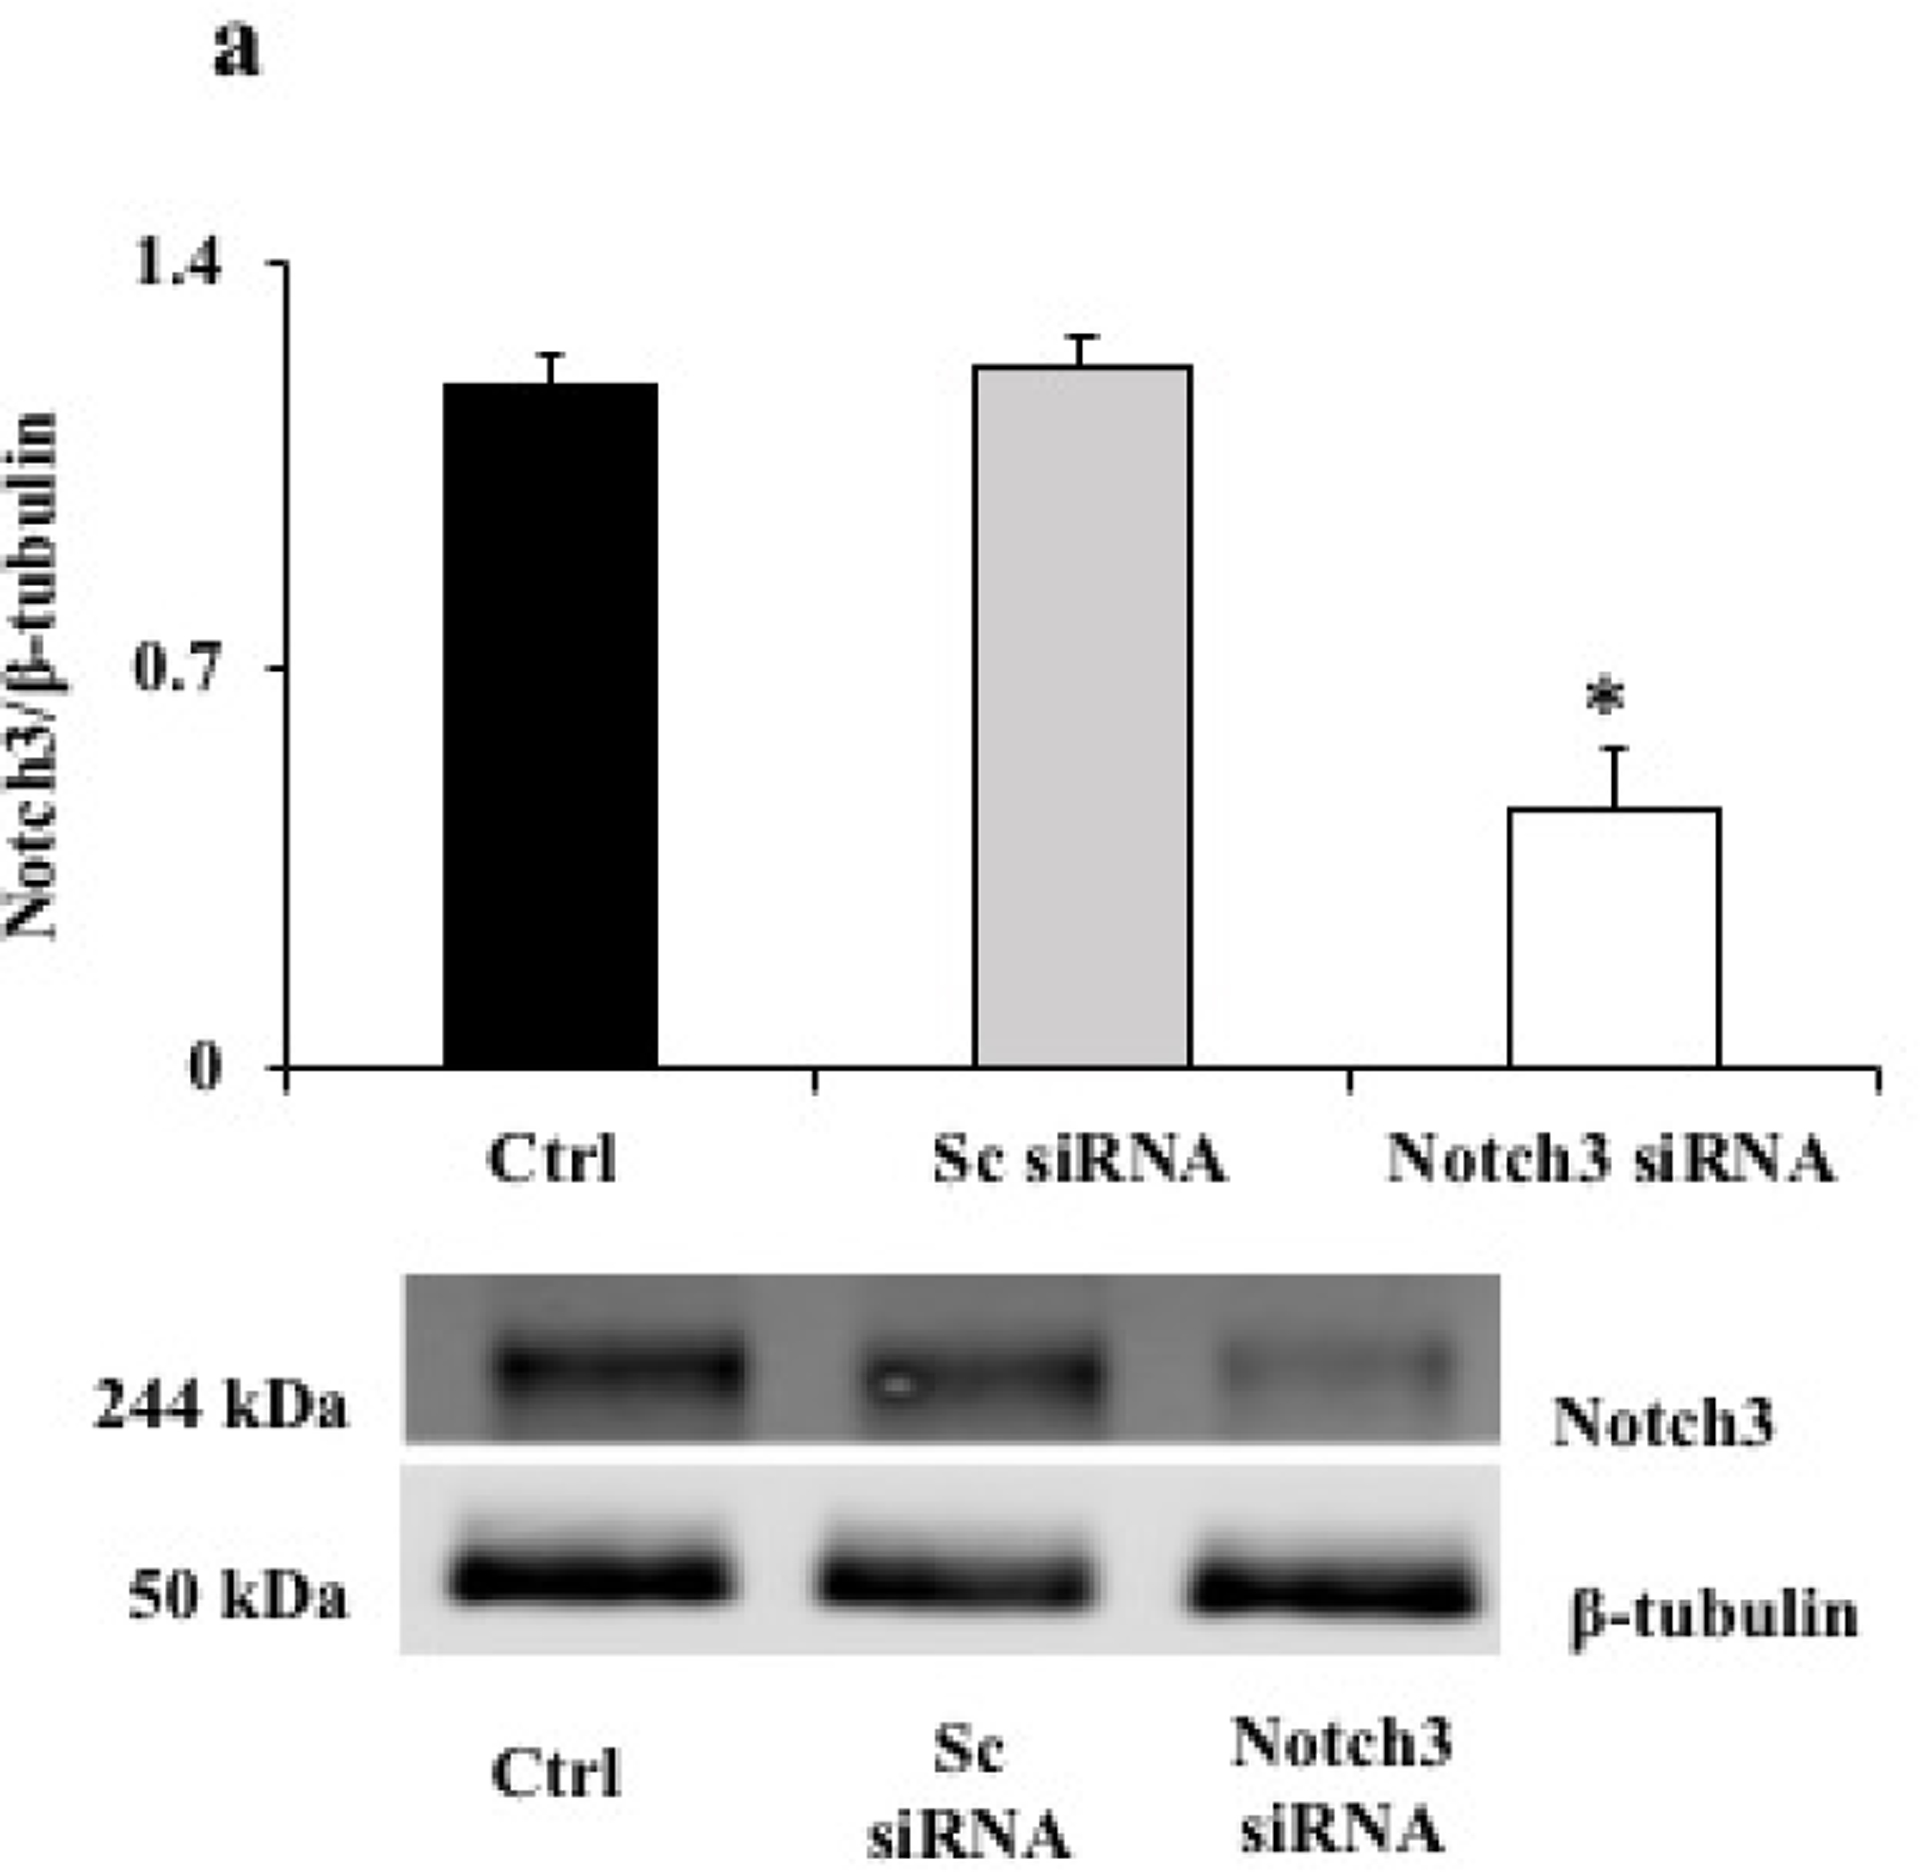
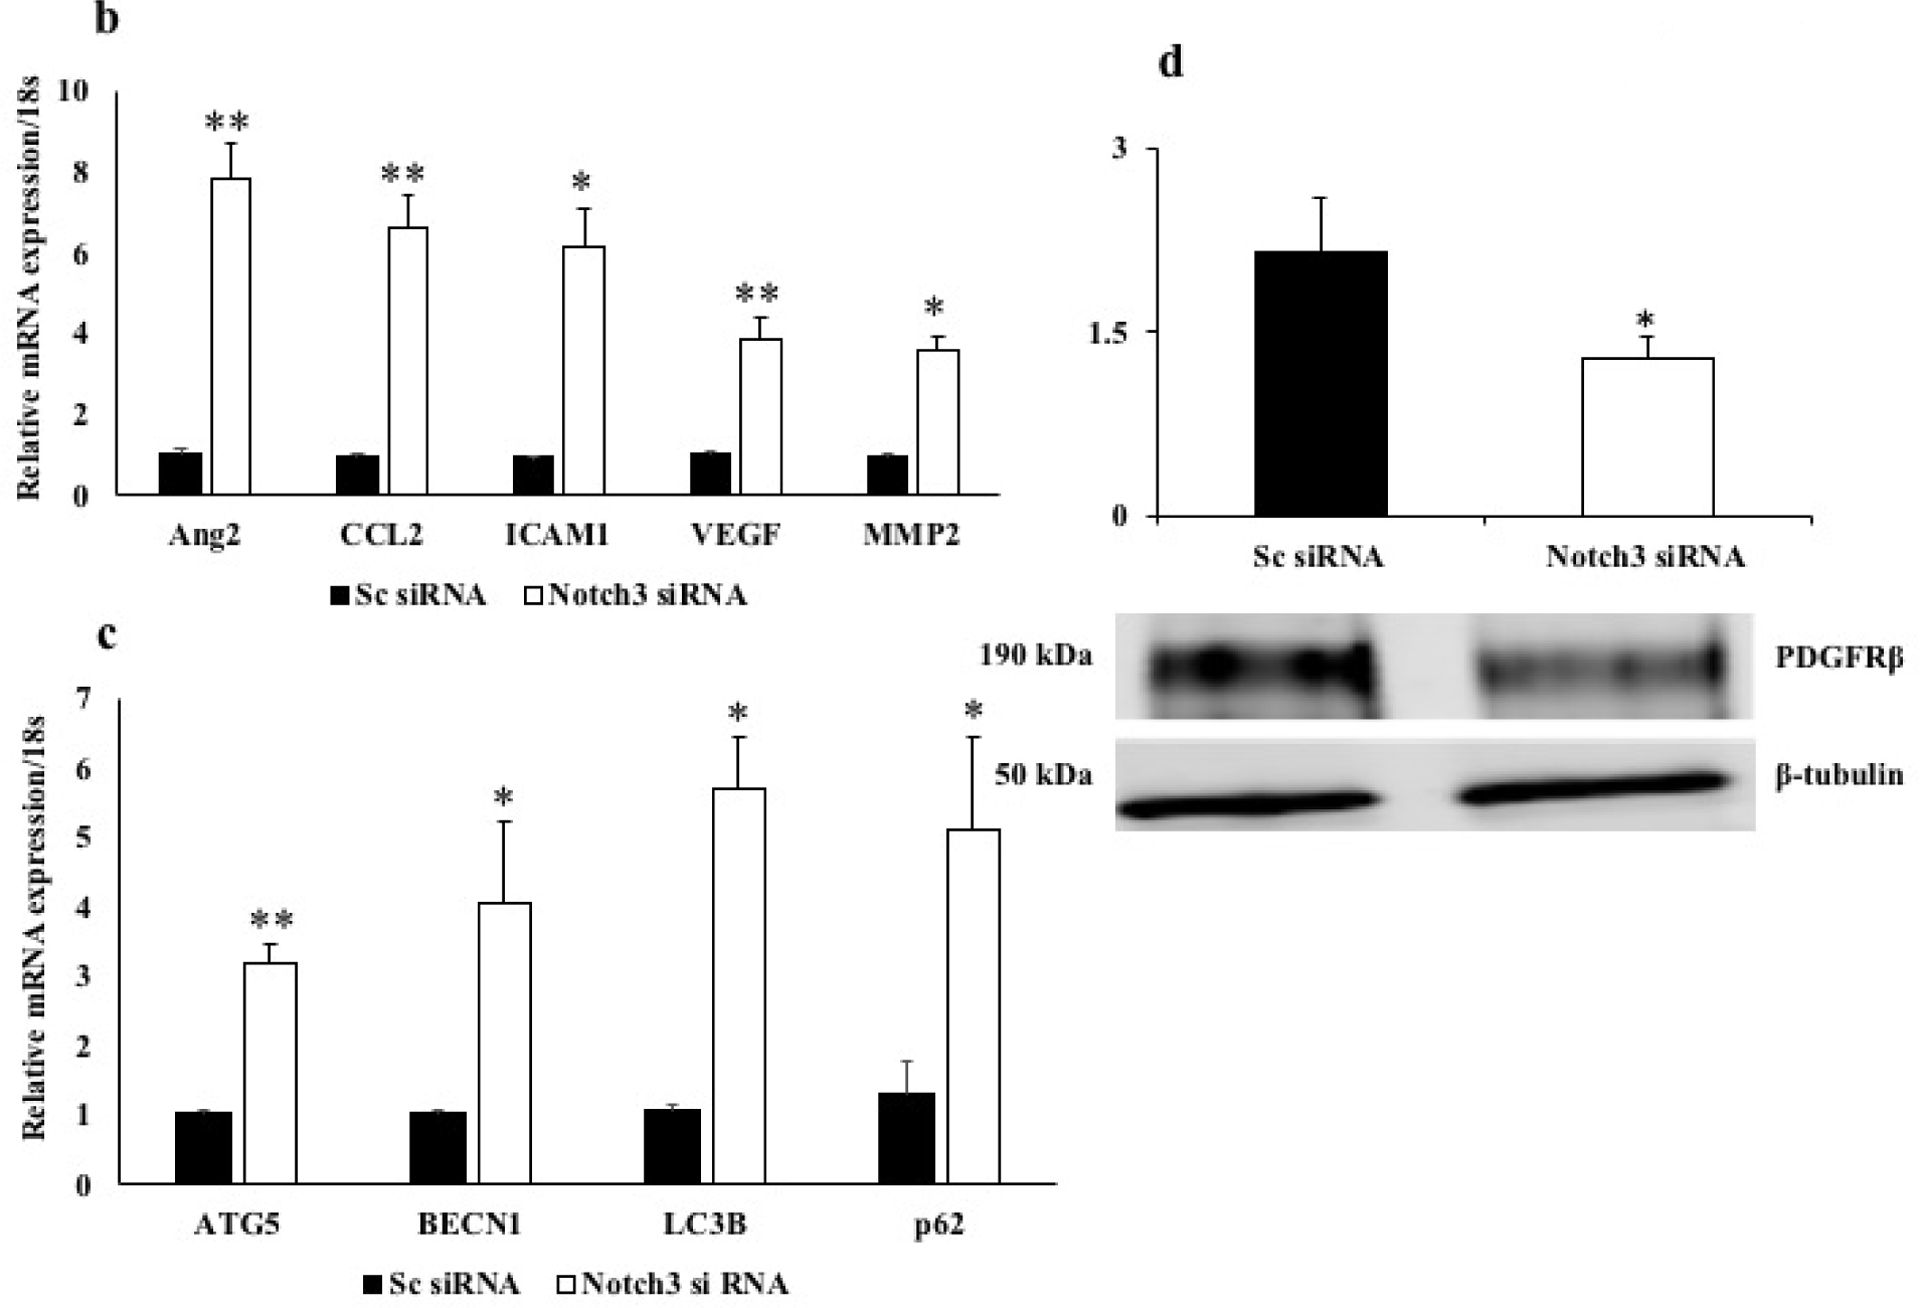
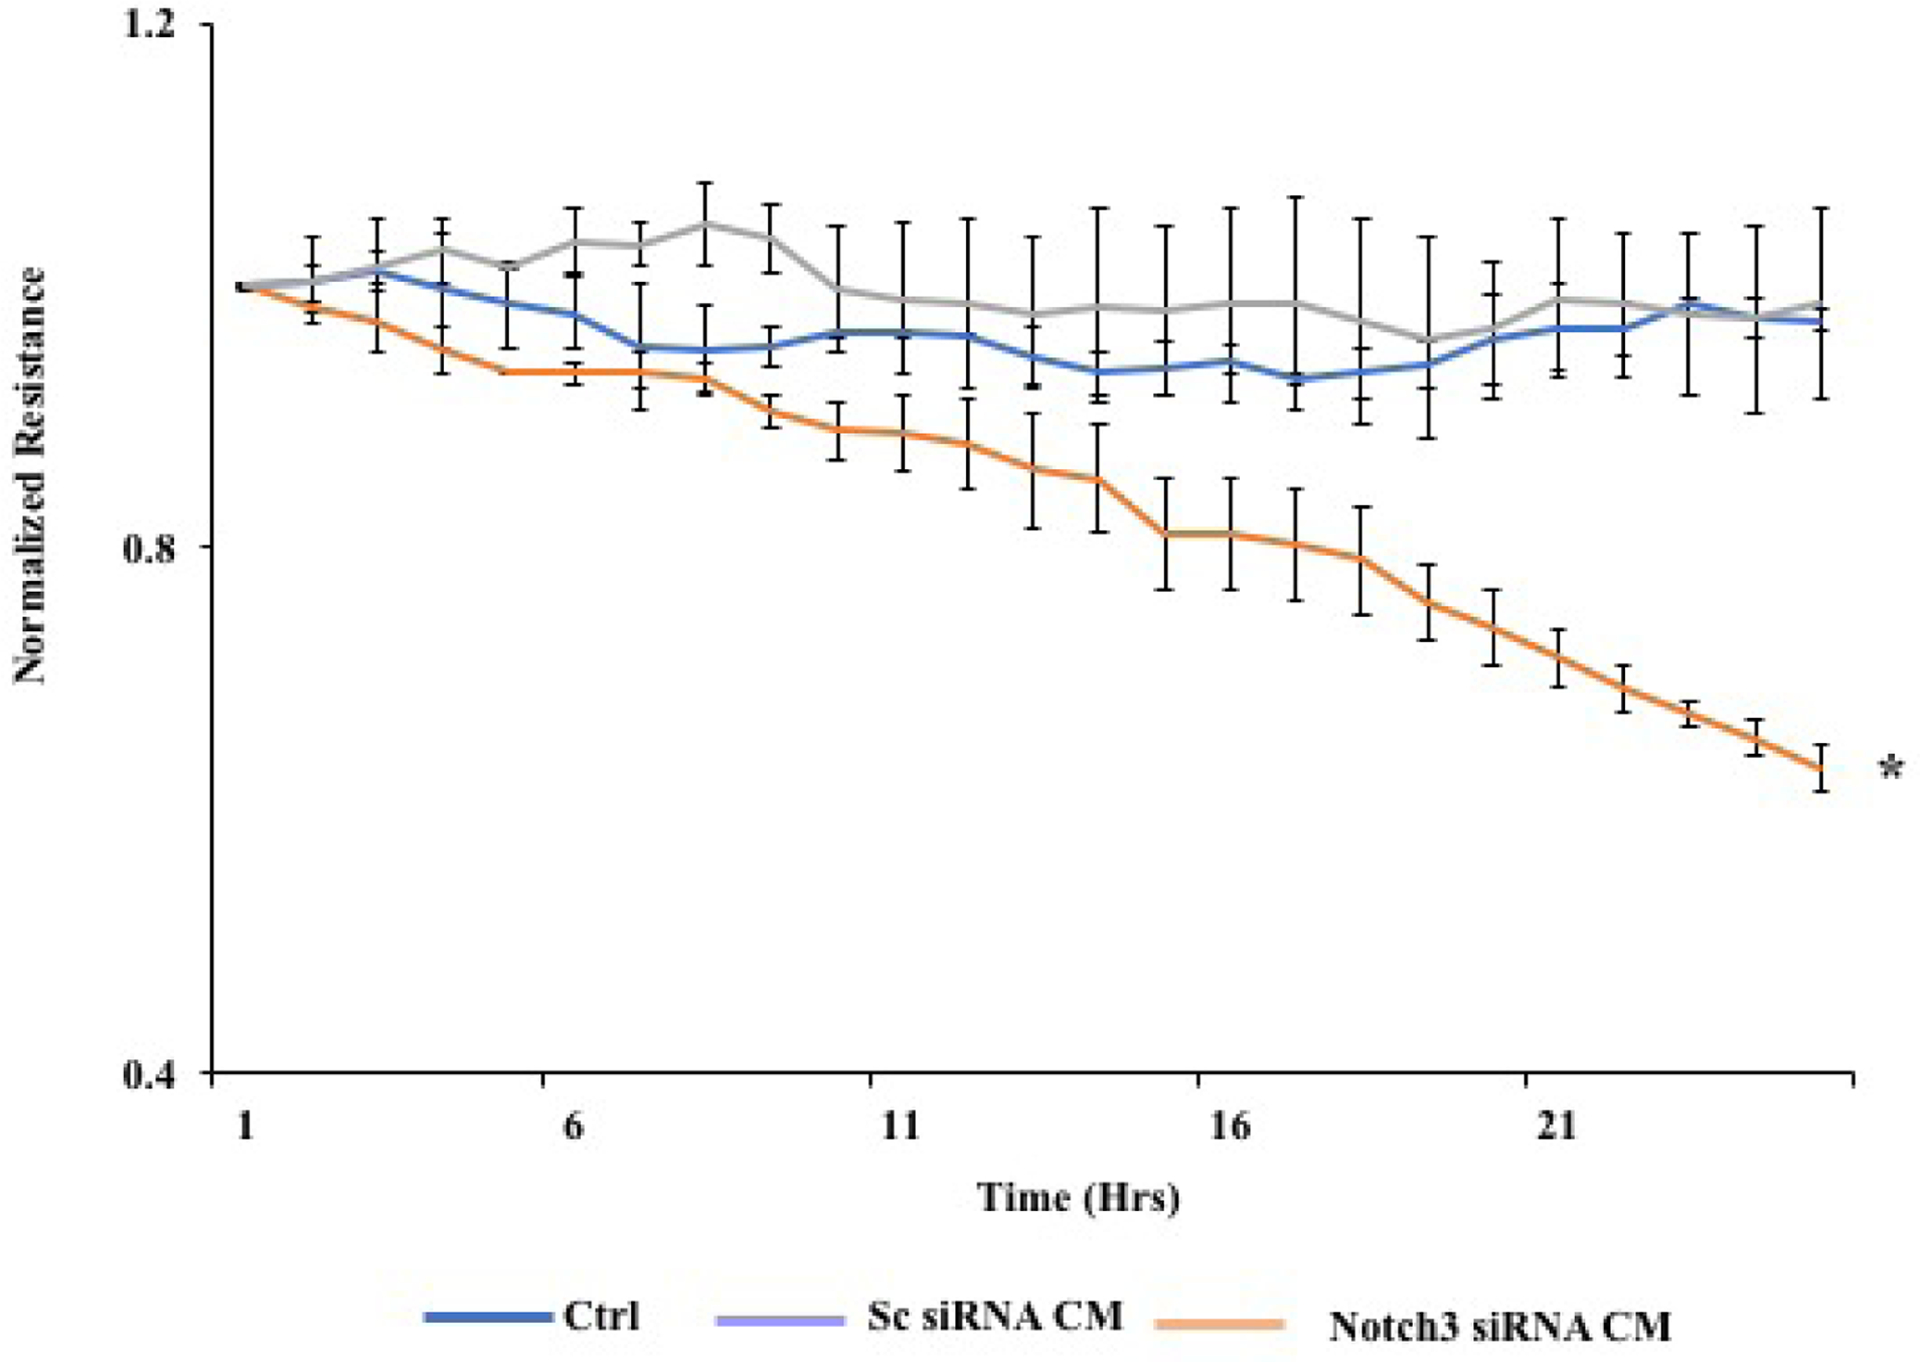
Selective pericyte loss, the histological hallmark of early diabetic retinopathy (DR), enhances the breakdown of the blood-retinal barrier (BRB) in diabetes. However, the role of pericytes on BRB alteration in diabetes and the signaling pathways involved in their effects are currently unknown. To understand the role of diabetes-induced molecular alteration of pericytes, we performed transcriptomic analysis of sorted retinal pericytes from mice model of diabetes. Retinal tissue from non-diabetic and diabetic (duration 3 months) mouse eyes (n = 10 in each group) were used to isolate pericytes through fluorescent activated cell sorting (FACS) using pericyte specific fluorescent antibodies, PDGFRb-APC. For RNA sequencing and qPCR analysis, a cDNA library was generated using template switching oligo and the resulting libraries were sequenced using paired-end Illumina sequencing. Molecular functional pathways were analyzed using differentially expressed genes (DEGs). Differential expression analysis revealed 217 genes significantly upregulated and 495 genes downregulated, in pericytes isolated from diabetic animals. These analyses revealed a core set of differentially expressed genes that could potentially contribute to the pericyte dysfunction in diabetes and highlighted the pattern of functional connectivity between key candidate genes and blood retinal barrier alteration mechanisms. The top up-regulated gene list included: Ext2, B3gat3, Gpc6, Pip5k1c and Pten and down-regulated genes included: Notch3, Xbp1, Gpc4, Atp1a2 and AKT3. Out of these genes, we further validated one of the down regulated genes, Notch 3 and its role in BRB alteration in diabetic retinopathy. We confirmed the downregulation of Notch3 expression in human retinal pericytes exposed to Advanced Glycation End-products (AGEs) treatment mimicking the chronic hyperglycemia effect. Exploration of pericyte-conditioned media demonstrated that loss of NOTCH3 in pericyte led to increased permeability of endothelial cell monolayers. Collectively, we identify a role for NOTCH3 in pericyte dysfunction in diabetes. Further validation of other DEGs to identify cell specific molecular change through whole transcriptomic approach in diabetic retina will provide novel insight into the pathogenesis of DR and novel therapeutic targets.

Keywords: Blood retinal barrier; Diabetic retinopathy; Notch3; Pericytes; RNA Sequencing.


Conflict of interest statement

Declaration of competing interest The authors declare that they have no competing financial interests.

Figures

Figure 1.
Figure 1.
Detailed illustration of the study design.
Figure 2.
Figure 2.
FACS purification of retinal pericytes. The representative Dot blots display the intensity of channel of analyzed retinal dissociated cells for Pdgfrb-APC staining from (A) non-diabetic mice retina and (B) diabetic mice retina (12 weeks old). The sorted, Pdgfrb-APC positive cell population for pericytes is specified by the inset.
Figure 3.
Figure 3.
a) Volcano plot of fold change (FC) of transcripts derived using edgeR. Diabetic pericytes compared to control pericytes. Significantly upregulated genes (217) are in the right side and down regulated genes (495) in the left indicated in red circles. b) Hierarchically clustered heatmap showing transcripts of pericytes from non-diabetic and diabetic mice (n=3).
Figure 4.
Figure 4.
Gene set enrichment analysis (GSEA) was done for genes that were regulated in the diabetic pericytes with two-fold regulation (p<0.05).
Figure 5.
Figure 5.
mRNA expression of Notch3 in HRPs treated with 500μg AGE was significantly decreased compared to untreated cells (*p=0.027).
Figure 6.
Figure 6.. Functional study on the impact of Notch3 knockdown in HRPs.
a. Representative western blot image of Notch3 and β-tubulin protein in HRPs knockdown for Notch3 using siRNA. Control (untreated), Notch3 siRNA and scrambled (Sc) siRNA. HRPs treated with Notch3 siRNA resulted in a significant reduction in the Notch3 protein expression in comparison with cells treated with Sc siRNA or untreated cells (*p≤0.002). b. mRNA expression of inflammatory genes- angiopoietin2 (Ang2), CCL2, ICAM1, VEGF and MMP2 were significantly increased in Notch3 siRNA HRPs compared with sc siRNA cells (**p≤0.009, *p=0.01). c. mRNA expression of autophagy markers- ATG5, BECN1, LC3B, p62 were significantly increased in Notch3 siRNA cells compared with sc siRNA cells (**p≤0.008, *p≤0.05). d. Representative western blot image of PDGFRb and β-tubulin protein in Notch3 siRNA and Sc siRNA. PDGFRb protein level was significantly decreased in cells treated with Notch3 siRNA cells compared with Sc siRNA cells (*p=0.03).
Figure 7.
Figure 7.
Preformed monolayers of HRECs were incubated with 50% of conditioned media from cells treated with both scrambled and Notch3 siRNA and the normalized resistance was determined. Decreased resistance which implies increased permeability was seen in cells treated with Notch3 siRNA conditioned media (CM) compared with CM from Sc siRNA cells (*p=0.01).

Similar articles

Cited by

References

    1. Ables JL, Breunig JJ, Eisch AJ, Rakic P, 2011. Not(ch) just development: Notch signalling in the adult brain. Nat Rev Neurosci 12, 269–283. - PMC - PubMed
    1. Anders S, Pyl PT, Huber W, 2015. HTSeq--a Python framework to work with high-throughput sequencing data. Bioinformatics 31, 166–169. - PMC - PubMed
    1. Armulik A, Abramsson A, Betsholtz C, 2005. Endothelial/pericyte interactions. Circ Res 97, 512–523. - PubMed
    1. Bergers G, Song S, 2005. The role of pericytes in blood-vessel formation and maintenance. Neuro Oncol 7, 452–464. - PMC - PubMed
    1. Chasseigneaux S, Moraca Y, Cochois-Guegan V, Boulay AC, Gilbert A, Le Crom S, Blugeon C, Firmo C, Cisternino S, Laplanche JL, Curis E, Decleves X, Saubamea B, 2018. Isolation and differential transcriptome of vascular smooth muscle cells and mid-capillary pericytes from the rat brain. Sci Rep 8, 12272. - PMC - PubMed

Publication types