

Association between tax on sugar sweetened beverages and soft drink consumption in adults in Mexico: open cohort longitudinal analysis of Health Workers Cohort Study
- PMID: 32376605
- PMCID: PMC7201935
- DOI: 10.1136/bmj.m1311
Association between tax on sugar sweetened beverages and soft drink consumption in adults in Mexico: open cohort longitudinal analysis of Health Workers Cohort Study
Abstract
Objective: To examine changes in categories of soft drink consumption in a cohort of Mexican adults, three years after the implementation of the sugar sweetened beverage tax.
Design: Open cohort longitudinal analysis.
Setting: Three waves of the Health Workers Cohort Study, Mexico, spanning 2004 to 2018.
Participants: 1770 people aged 19 years or older with information on drinks consumption available in at least one of the three cohort waves.
Main outcome measure: Change in probability of belonging to one of four categories of soft drinks consumption (non, low, medium, high) after the tax was implemented. Heterogeneity of associations by income and education was also assessed.
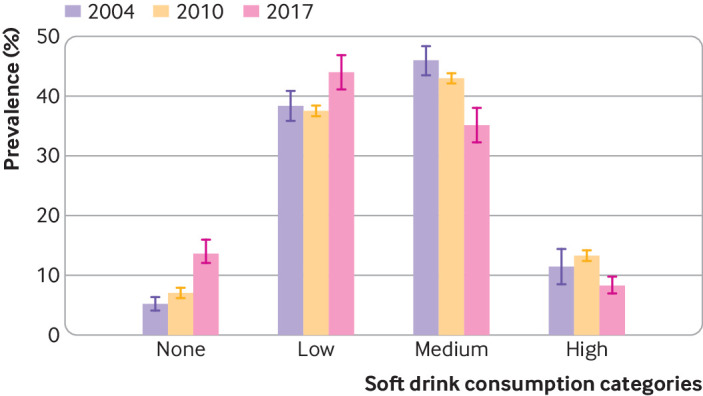
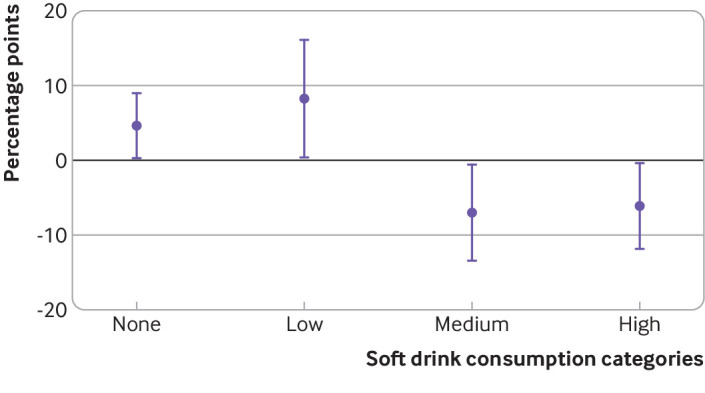
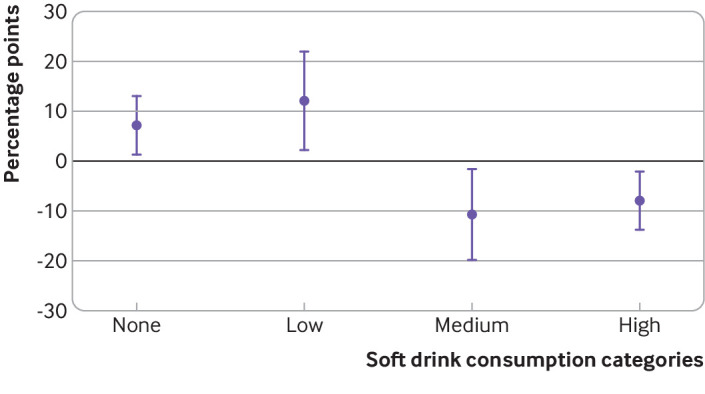
Results: Before the implementation of the tax, more than 50% of the participants were medium and high consumers of soft drinks and less than 10% were in the non-consumer category. After the tax was implemented, 43% of the population was categorised as medium or high consumers and the prevalence of non-consumers increased to 14%. Three years after implementation of the tax on 1 January 2014, the probability of being a non-consumer of soft drinks increased by 4.7 (95% confidence interval 0.3 to 9.1) percentage points and that of being a low consumer increased by 8.3 (0.6 to 16.0) percentage points compared with the pre-tax period. Conversely, the probability of being in the medium and high levels of soft drinks consumption decreased by 6.8 (0.5 to 13.2) percentage points and 6.1 (0.4 to 11.9) percentage points, respectively. No significant heterogeneity of the tax across income levels was observed, but stronger effects of the tax were seen in participants with secondary school education or higher, compared with those with elementary school or less.
Conclusions: The Mexican sugar sweetened beverage tax was associated with a reduction in the probability of consuming soft drinks in this cohort of employees from a healthcare provider. The results cannot be extrapolated to the Mexican population, but they suggest that three years after implementation, the tax had helped to increase the proportion of people who do not consume soft drinks while decreasing the proportion of high and medium consumers.
© Author(s) (or their employer(s)) 2019. Re-use permitted under CC BY-NC. No commercial re-use. See rights and permissions. Published by BMJ.
Conflict of interest statement
Competing interests: All authors have completed the ICMJE uniform disclosure form at www.icmje.org/coi_disclosure.pdf and declare: support from Bloomberg Philanthropies for the submitted work; no financial relationships with any organisations that might have an interest in the submitted work in the previous three years; no other relationships or activities that could appear to have influenced the submitted work.
Figures
References
-
- World Health Organization. Guideline: sugars intake for adults and children. 2015. https://apps.who.int/iris/bitstream/handle/10665/149782/9789241549028_en.... - PubMed
-
- World Health Organization Global status report on noncommunicable diseases 2010. WHO Press, 2011.
MeSH terms
Grants and funding
LinkOut - more resources
Full Text Sources