

Cost of hospital treatment of type 1 diabetes (T1DM) and type 2 diabetes (T2DM) compared to the non-diabetes population: a detailed economic evaluation
- PMID: 32376746
- PMCID: PMC7223153
- DOI: 10.1136/bmjopen-2019-033231
Cost of hospital treatment of type 1 diabetes (T1DM) and type 2 diabetes (T2DM) compared to the non-diabetes population: a detailed economic evaluation
Abstract
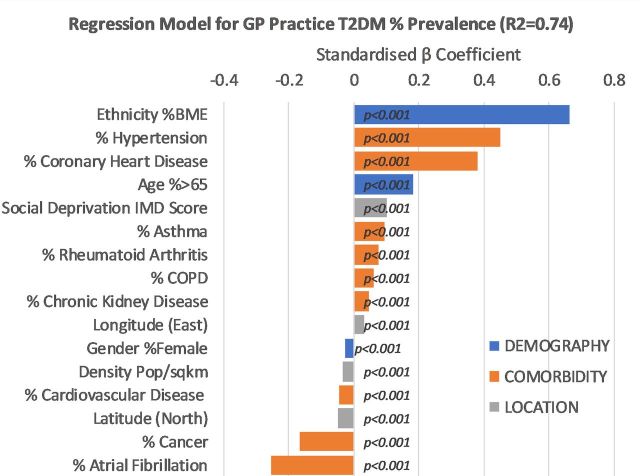
Objectives: Other than age, diabetes is the largest contributor to overall healthcare costs and reduced life expectancy in Europe. This paper aims to more exactly quantify the net impact of diabetes on different aspects of healthcare provision in hospitals in England, building on previous work that looked at the determinants of outcome in type 1 diabetes (T1DM) and type 2 diabetes (T2DM).
Setting: NHS Digital Hospital Episode Statistics (HES) in England was combined with the National Diabetes Audit (NDA) to provide the total number in practice of people with T1DM/T2DM.
Outcome measures: We compared differences between T1DM/T2DM and non-diabetes individuals in relation to hospital activity and associated cost.
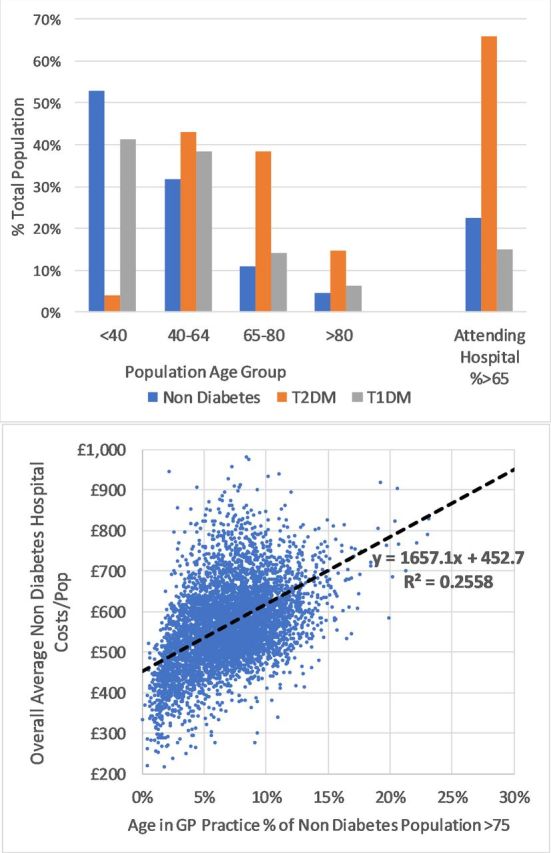
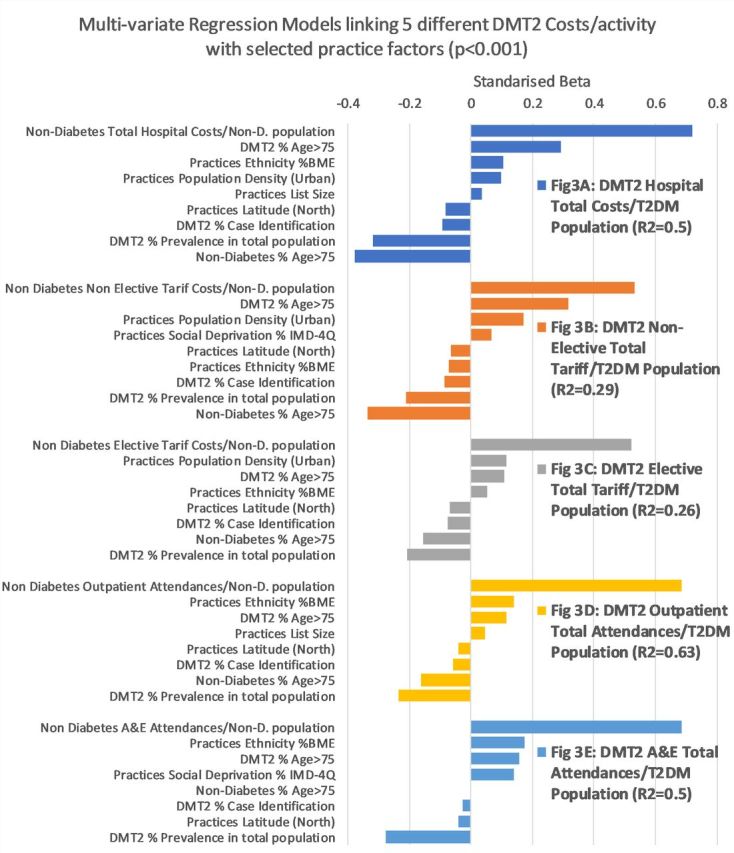
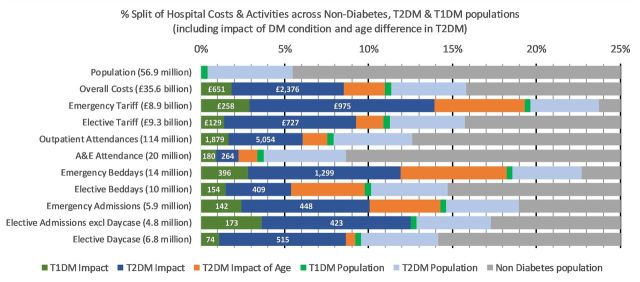
Results: The study captured 90% of hospital activity and £36 billion/year of hospital spend. The NDA Register showed that out of a total reported population of 58 million, 2.9 million (6.5%) had T2DM and 240 000 (0.6%) had T1DM. Bed-day analysis showed 17% of beds are occupied by T2DM and 3% by T1DM. The overall cost of hospital care for people with diabetes is £5.5 billion/year. Once the normally expected costs including the older age of T2DM hospital attenders are allowed for this fell to £3.0 billion/year or 8% of the total captured secondary care costs. This equates to £560/non-diabetes person compared with £3280/person with T1DM and £1686/person with T2DM. For people with diabetes, the net excess impact on non-elective/emergency work is £1.2 billion with additional estimated diabetes-related accident & emergency attendances at 440 000 costing the NHS £70 million/year. T1DM individuals required five times more secondary care support than non-diabetes individuals. T2DM individuals, even allowing for the age, require twice as much support as non-diabetes individuals.
Conclusions: This analysis shows that additional cost of provision of hospital services due to their diabetes comorbidities is £3 billion above that for non-diabetes, and that within this, T1DM has three times as much cost impact as T2DM. We suggest that supporting patients in diabetes management may significantly reduce hospital activity.
Keywords: general diabetes; health economics; hospital; public health.
© Author(s) (or their employer(s)) 2020. Re-use permitted under CC BY-NC. No commercial re-use. See rights and permissions. Published by BMJ.
Conflict of interest statement
Competing interests: None declared.
Figures
References
-
- Who global report on diabetes, 2016. Available: https://apps.who.int/iris [Accessed 31 May 2019].
-
- National diabetes inpatient audit, 2018. Available: http://content.digital.nhs.uk/diabetesinpatientaudit [Accessed 25 May 2019].
-
- NHS Digital HES data. Available: https://digital.nhs.uk/data-and-information/data-tools-and-services/data... [Accessed 21 May 2019].
-
- National diabetes audit, 2018. Available: http://content.digital.nhs.uk/diabetesinpatientaudit [Accessed 25 May 2019].
-
- HERC Yorkshire and the number public health Observatory data, 2018. Available: https://www.herc.ox.ac.uk/health_datasets/.data./yorkshire-and-the-humbe... [Accessed 26 May 2019].
Publication types
MeSH terms
LinkOut - more resources
Full Text Sources
Medical