. 2020 Jun 10;40(24):4715-4726.
doi: 10.1523/JNEUROSCI.2775-19.2020. Epub 2020 May 6.

Neural Signals in Red Nucleus during Reactive and Proactive Adjustments in Behavior

Affiliations

Neural Signals in Red Nucleus during Reactive and Proactive Adjustments in Behavior

Adam T Brockett et al. J Neurosci. .

Abstract

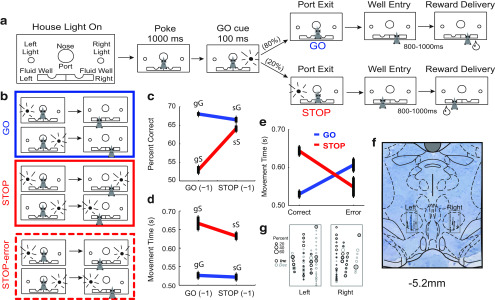
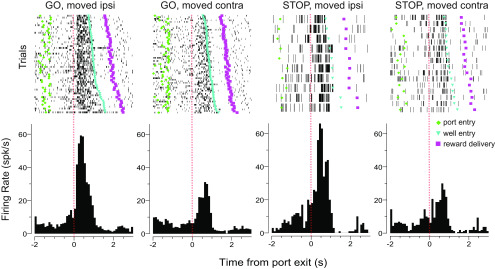
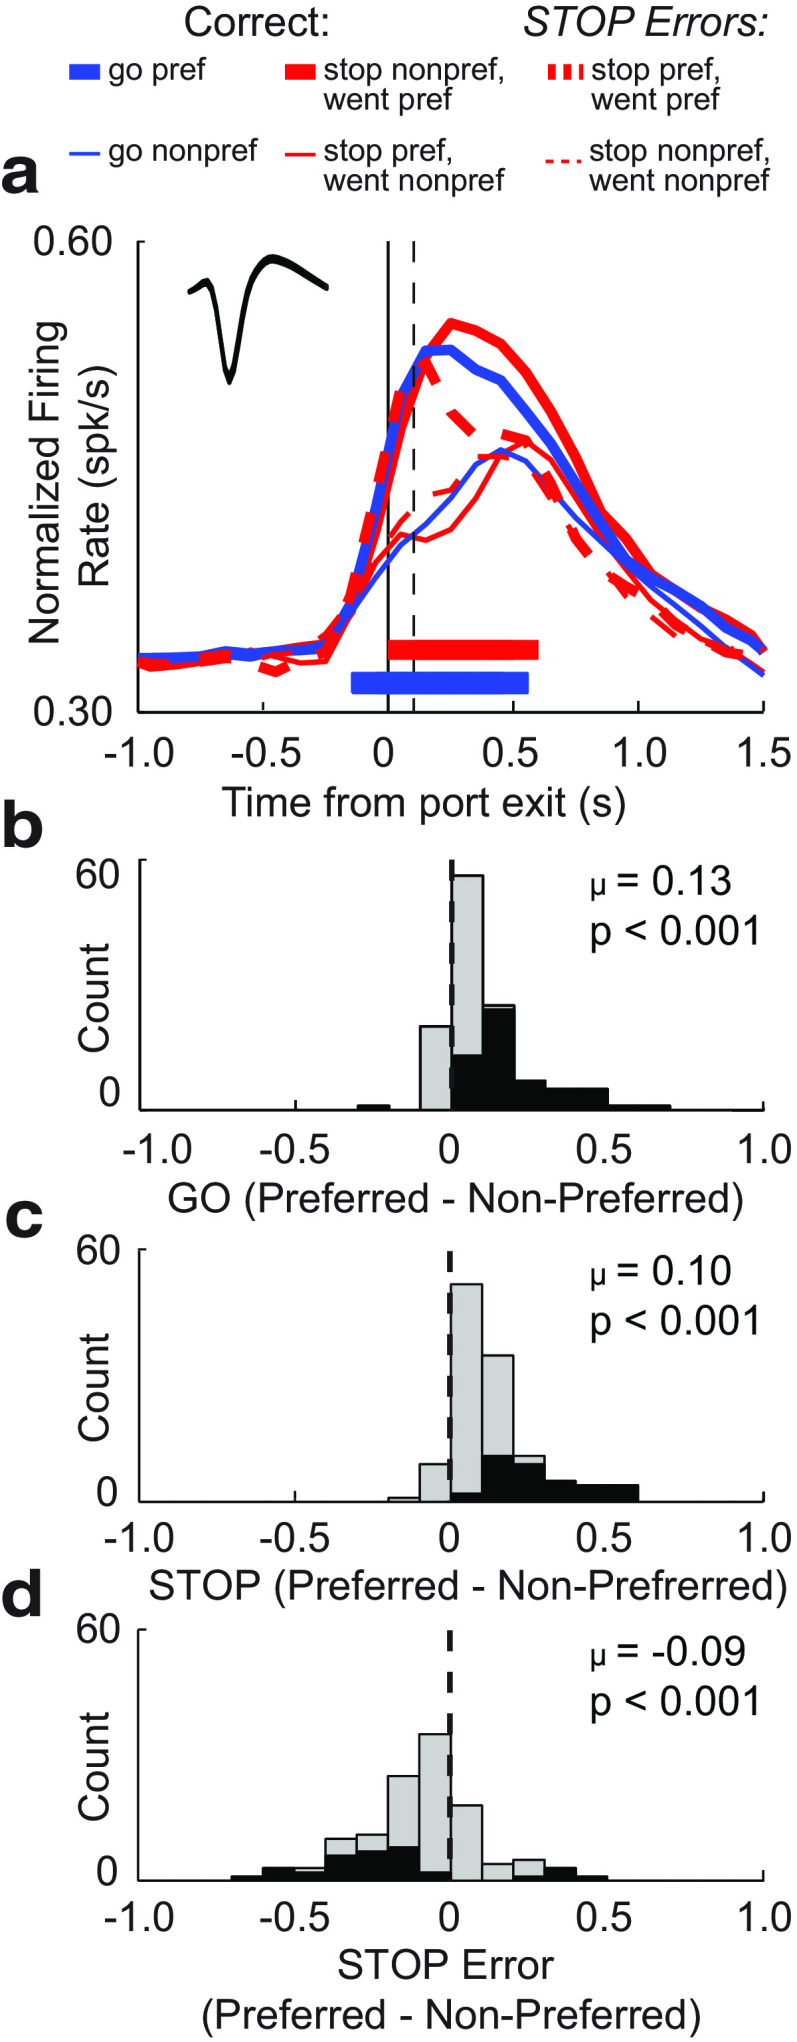
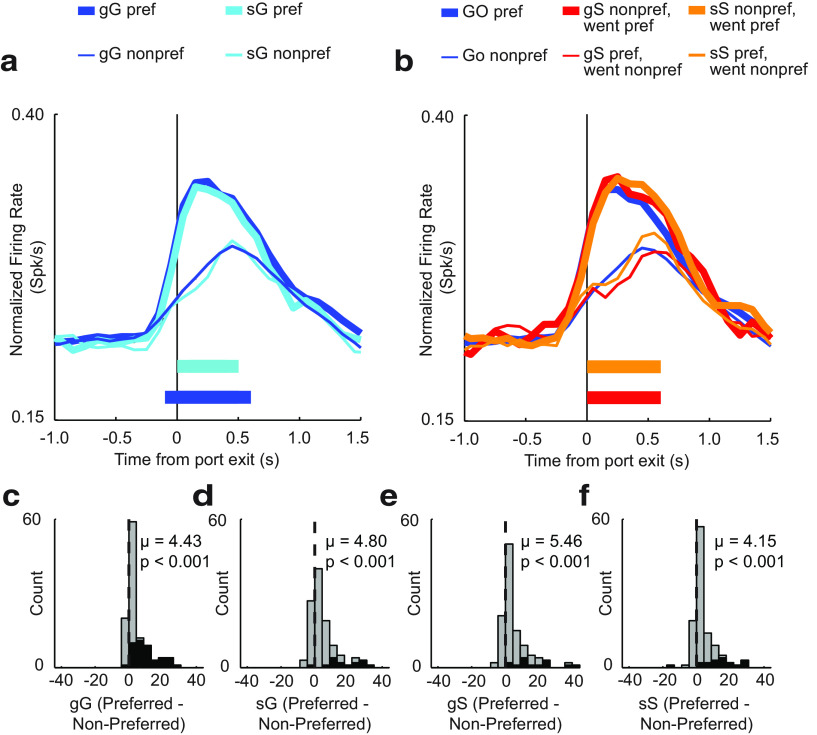
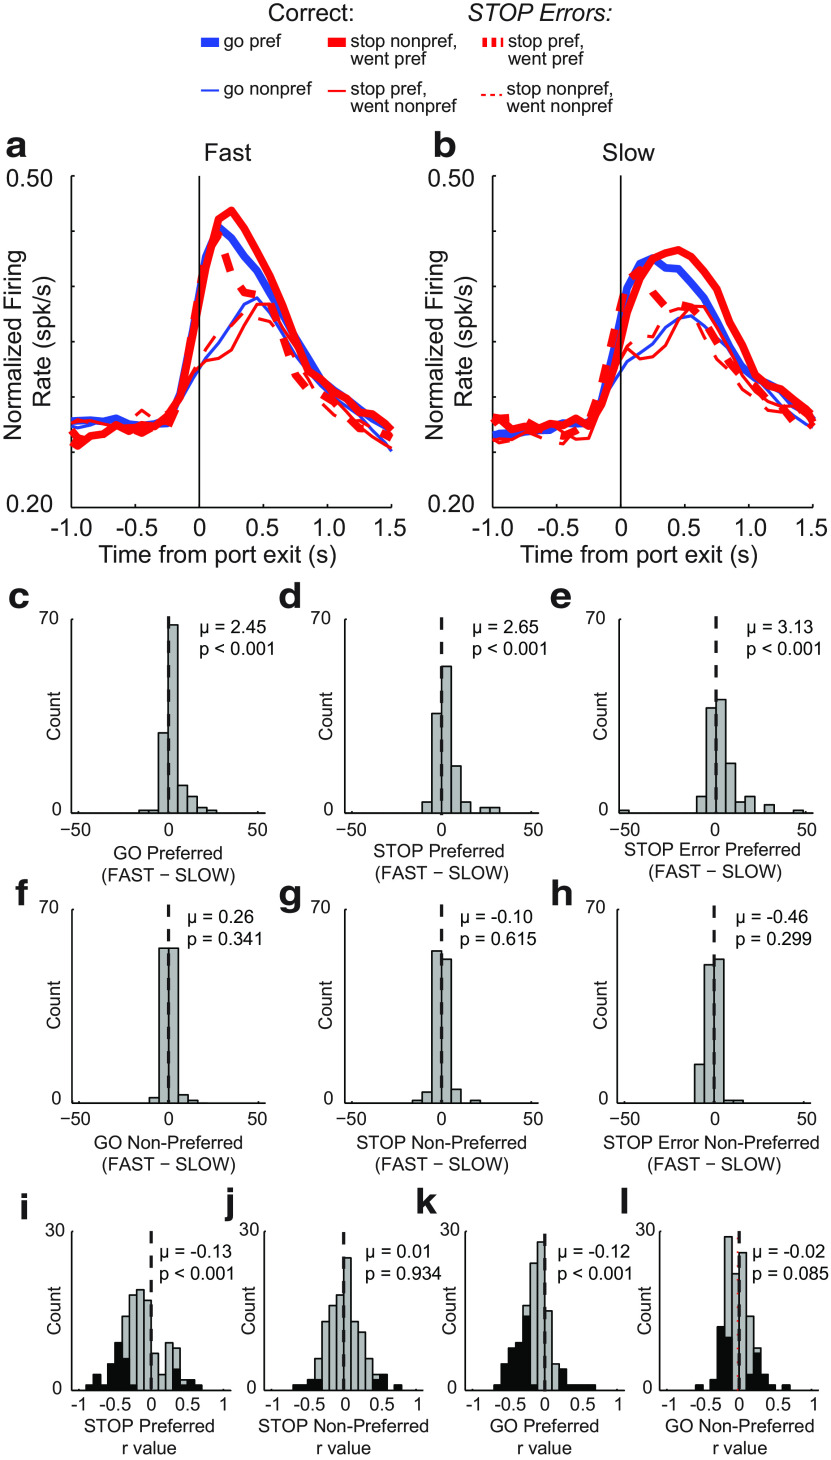
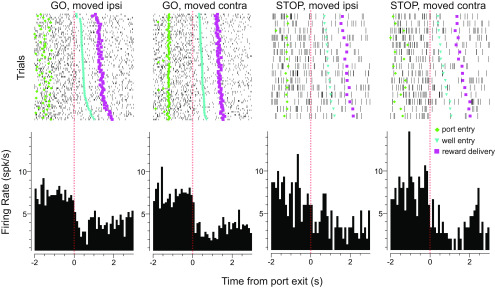
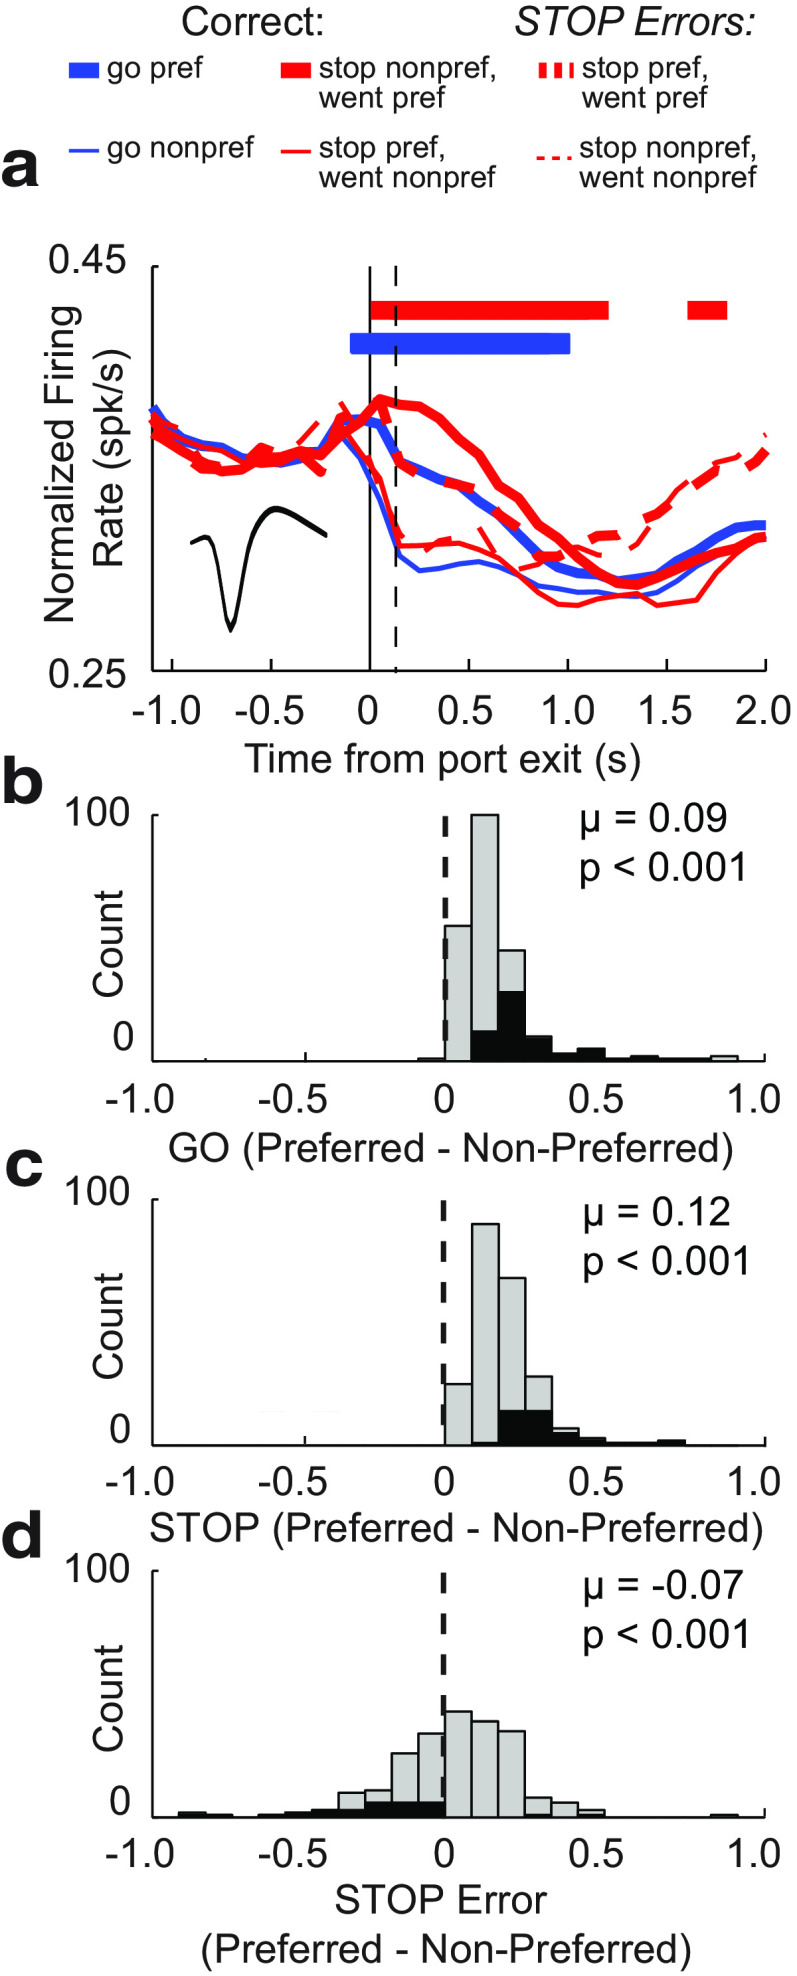
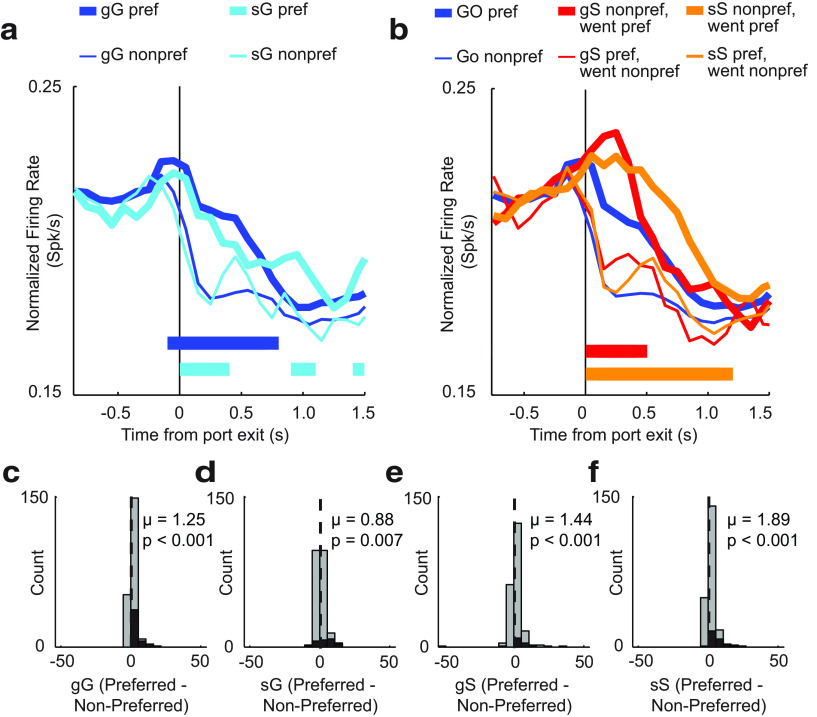
The ability to adjust behavior is an essential component of cognitive control. Much is known about frontal and striatal processes that support cognitive control, but few studies have investigated how motor signals change during reactive and proactive adjustments in motor output. To address this, we characterized neural signals in red nucleus (RN), a brain region linked to motor control, as male and female rats performed a novel variant of the stop-signal task. We found that activity in RN represented the direction of movement and was strongly correlated with movement speed. Additionally, we found that directional movement signals were amplified on STOP trials before completion of the response and that the strength of RN signals was modulated when rats exhibited cognitive control. These results provide the first evidence that neural signals in RN integrate cognitive control signals to reshape motor outcomes reactively within trials and proactivity across them.SIGNIFICANCE STATEMENT Healthy human behavior requires the suppression or inhibition of errant or maladaptive motor responses, often called cognitive control. While much is known about how frontal brain regions facilitate cognitive control, less is known about how motor regions respond to rapid and unexpected changes in action selection. To address this, we recorded from neurons in the red nucleus, a motor region thought to be important for initiating movement in rats performing a cognitive control task. We show that red nucleus tracks motor plans and that selectivity was modulated on trials that required shifting from one motor response to another. Collectively, these findings suggest that red nucleus contributes to modulating motor behavior during cognitive control.

Keywords: cognitive control; inhibition; motor; red nucleus; single-neuron recording; stop signal.


Figures

Figure 1.
Figure 1.
Task design and behavioral analysis. a, Schematic of stop-change task. Following the house lights, rats made a nose poke for 1000 ms before a light cue was illuminated on either the right or left side. In 80% of trials (GO trials), this light corresponded to the correct direction that the rat needed to move to receive the reward. On 20% of trials, a second light was illuminated after the initial GO cue directing the rat to inhibit their initial response to the first cue in favor of making a response in the direction of the second cue. b, Illustration of GO (blue), STOP (red), STOP-error (dashed red) trial types. c, d, Percentage of correct and movement times for sequence effects: gG, go, go; sG, stop, go; sG, stop, go; sS, stop, stop. Percentage correct and movement times were averaged over sessions. Error bars represent ±SEM. e, Movement time in the current trial as a function of trial success. GO, Blue; STOP, red. Movement times were averaged over sessions. Error bars represent ±SEM. f, Electrode placements from seven rats that contributed neural data. g, Zoomed-in schematic of electrode positions from f. The sizes of circles represent the percentage of cells that significantly increased (black) or decreased (gray) firing during the response epoch (port exit to well entry) compared with baseline (1 s; Wilcoxon test, p < 0.0500).
Figure 2.
Figure 2.
Raster plots showing an example of a directionally selective increasing cell. From left to right figures show the following: GO trials where the rat moved in the direction ipsilateral to the electrode location; GO trials where rats moved in the contralateral direction; STOP trials where the rat inhibited the contralateral movement (signaled by the first light) and moved in the ipsilateral direction (signaled by the second light); and STOP trials where the rat inhibited the ipsilateral movement and moved in the contralateral direction. Sessions are sorted by movement speed. Plots are aligned to port exit. Green diamonds reflect port entry, blue upside down triangles represent well entry, purple squares represent reward delivery, and each tick mark represents an action potential.
Figure 3.
Figure 3.
RN firing was higher for STOP trials when aligned to port exit for increasing cells (n = 121). a, Average population histogram for all trial types aligned to time of cue onset. Red, STOP; Blue, GO; solid, correct; dashed, error; thick, preferred direction; thin, nonpreferred direction. Preferred direction was determined by the direction that elicited the stronger response average across correct trial types during the response epoch (port exit to well entry) for each neuron. Inset shows the average waveform shape (maximum to maximum). b–d, Distribution of directional indices (preferred − nonpreferred/preferred + nonpreferred) computed during the response epoch for GO (b), STOP (c), and STOP-error (d) trials (Wilcoxon test, μ = mean). Black bars indicate individual cells that exhibited significant differences between preferred and nonpreferred directional responses (Wilcoxon test, p < 0.05).
Figure 4.
Figure 4.
Effects of trial sequence on RN firing for increasing cells. a, Population histogram aligned to port exit for trials followed by a GO trial: gG (blue); sG (teal). Line thickness indicates direction, preferred (thick) or nonpreferred (thin). b, Population histograms comparing average GO trials (preferred: thick, blue; nonpreferred: thin, blue) to gS trials (preferred: thick, red; nonpreferred: thin, red) and sS trials (preferred: thick, orange; nonpreferred: thin, orange). Aligned to time of port exit. c–f, Distributions of directional indices (preferred − nonpreferred) for gG (c), sG (d), gS (e), and sS (f) or all trial types (Wilcoxon test, μ = mean). Black bars indicate individual neurons that exhibited a significant shift (Wilcoxon test, p < 0.05).
Figure 5.
Figure 5.
Effects of movement time on RN firing on increasing cells. a, b, Average population histogram for Fast (a) and Slow (b) trials. Fast and Slow were determined by taking the median split within each recording session. Trial types are distinguished by color, as follows: GO, blue; STOP, red; STOP-error, dashed red. Direction is indicated by line thickness, as follows: preferred, thick; nonpreferred, thin). c–h, Distribution of speed indices comparing firing during Fast to Slow trials (Fast −Slow) for GO preferred (c) and nonpreferred (f); STOP preferred (d) and nonpreferred (g); and STOP error preferred (e) and nonpreferred (h; Wilcoxon test: p < 0.05; μ represents the mean). i–l, Distribution of r values depicting correlation between firing rate during the response epoch and movement time for STOP preferred (i) and nonpreferred (j) and GO preferred (k) and nonpreferred (l) directions (Wilcoxon test: μ = mean). Black bars indicate individual neurons that exhibited significant within-session correlations between firing rate and movement time (p < 0.05).
Figure 6.
Figure 6.
Raster plots showing an example of a directionally selective decreasing cell. From left to right: GO trials where the rat moved in the direction ipsilateral to the electrode location; GO trials where rats moved in the contralateral direction; STOP trials where the rat inhibited the contralateral movement signaled by the first light and moved in the ipsilateral direction (signaled by the second light); and STOP trials where the rat inhibited the ipsilateral movement and moved in the contralateral direction. Sessions are sorted by movement speed. Plots are aligned to port exit. Green diamonds reflect port entry, blue upside down triangles represent well entry, purple squares represent reward delivery, and each tick mark represents an action potential.
Figure 7.
Figure 7.
RN firing was higher for STOP trials when aligned to port exit for decreasing cells (n = 229). a, Average population histogram for all trial types aligned to time of cue onset. Red, STOP; Blue, GO; solid, correct; dashed, error; thick, preferred direction; thin, nonpreferred direction. Preferred direction determined by the direction that elicited the stronger response average across correct trial types during the response epoch (port exit to well entry) for each neuron. Inset shows average waveform shape (maximum to maximum). b–d, Distribution of directional indices (preferred − nonpreferred/preferred + nonpreferred) computed during the response epoch for GO (b), STOP (c), and STOP-error (d) trials (Wilcoxon test, μ = mean). Black bars indicate individual cells that exhibited significant differences between preferred and nonpreferred directional responses (Wilcoxon test, p < 0.05).
Figure 8.
Figure 8.
Effects of trial sequence on RN firing for decreasing cells. a, Population histogram aligned to port exit for trials followed by a GO trial: gG, blue; sG, teal. Line thickness indicates direction preference: preferred, thick; or nonpreferred, thin. b, Population histograms comparing average GO trials (preferred: thick, blue; nonpreferred: thin, blue) to gS (preferred: thick, red; nonpreferred: thin, red) and sS trials (preferred: thick, orange; nonpreferred: thin, orange). Activity is aligned to time of port exit. c–f, Distributions of directional indices (preferred − nonpreferred) for gG (c), sG (d), gS (e), and sS (f) or all trial types (Wilcoxon test, μ = mean). Black bars indicate individual neurons that exhibited a significant shift (Wilcoxon test, p <0.05).
Figure 9.
Figure 9.
Effects of movement time on RN firing on decreasing cells. a, b, Average population histogram for Fast (a) and Slow (b) trials. Fast and Slow were determined by taking the median split within each recording session. Trial types are distinguished by color: GO, blue; STOP, red; STOP-error, dashed red. Direction is indicated by line thickness: preferred, thick; nonpreferred, thin. c–h, Distribution of speed indices comparing firing during Fast to Slow trials (Fast − Slow) for GO preferred (c) and nonpreferred (f); STOP preferred (d) and nonpreferred (g); and STOP error preferred (e) and nonpreferred (h; Wilcoxon test, μ = mean). i–l, Distribution of r values depicting the correlation between firing rate during the response epoch and movement time for STOP preferred (i) and nonpreferred (j) and GO preferred (k) and nonpreferred (l) directions (Wilcoxon test, μ = mean). Black bars indicated individual neurons that exhibited a significant within-session correlations between firing rate and movement time (p < 0.05).

Similar articles

Cited by

References

    1. Aghoghovwia BE, Oorschot DE (2016) Absolute number of parvicellular and magnocellular neurons in the red nucleus of the rat midbrain: a stereological study. J Anat 229:406–415. 10.1111/joa.12495 - DOI - PMC - PubMed
    1. Amalric M, Condé H, Dormont JF, Farin D, Schmied A (1983) Cat red nucleus changes of activity during the motor initiation in a reaction time task. Exp Brain Res 52:210–218. 10.1007/BF00236629 - DOI - PubMed
    1. Amassian VE, Batson D (1988) Long loop participation of red nucleus in contact placing in the adult cat with facilitation by tactile input at the spinal level. Behav Brain Res 28:225–232. 10.1016/0166-4328(88)90100-3 - DOI - PubMed
    1. Arshavsky YI, Orlovsky GN, Perret C (1988) Activity of rubrospinal neurons during locomotion and scratching in the cat. Behav Brain Res 28:193–199. 10.1016/0166-4328(88)90096-4 - DOI - PubMed
    1. Batson DE, Amassian VE (1986) A dynamic role of rubral neurons in contact placing by the adult cat. J Neurophysiol 56:835–856. 10.1152/jn.1986.56.3.835 - DOI - PubMed

Publication types

LinkOut - more resources