. 2020 Jun 10;40(24):4761-4772.
doi: 10.1523/JNEUROSCI.2897-19.2020. Epub 2020 May 6.

Value-Related Neuronal Responses in the Human Amygdala during Observational Learning

Affiliations

Value-Related Neuronal Responses in the Human Amygdala during Observational Learning

Tomas G Aquino et al. J Neurosci. .

Abstract

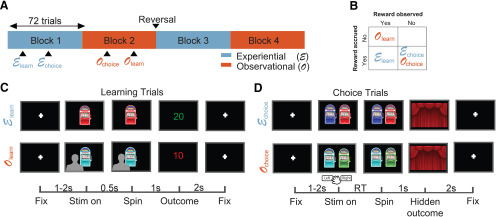
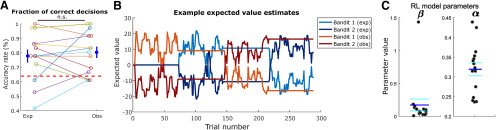
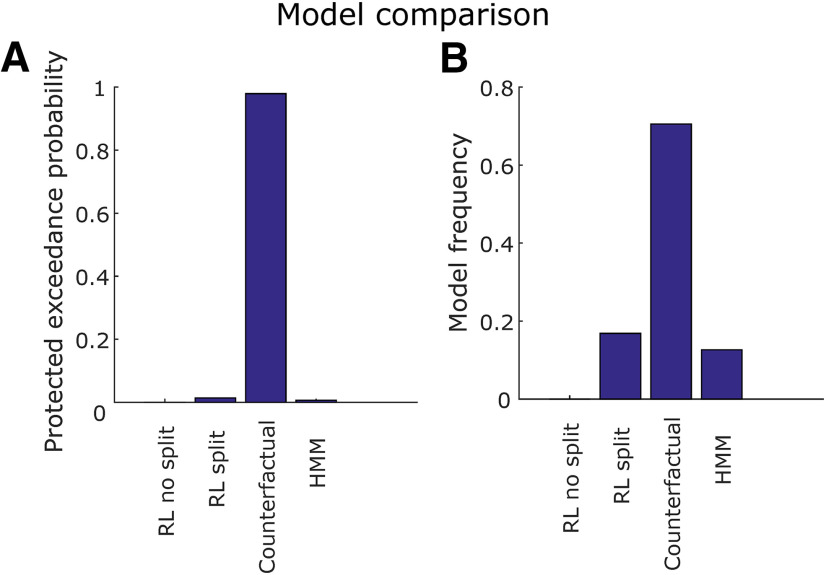
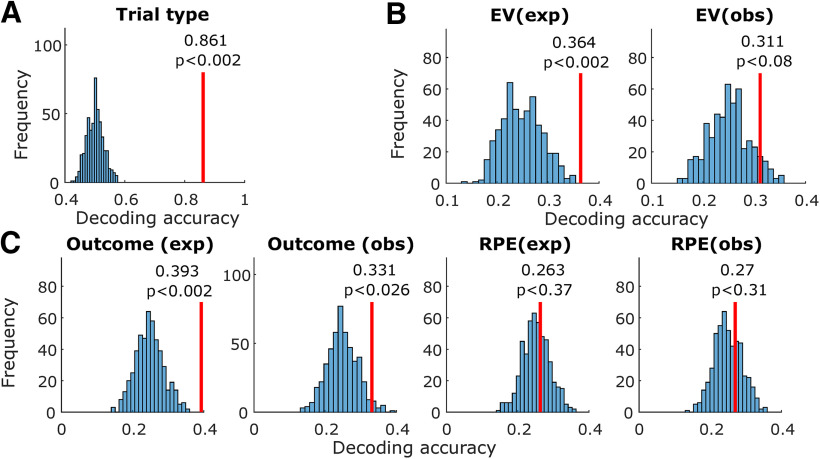
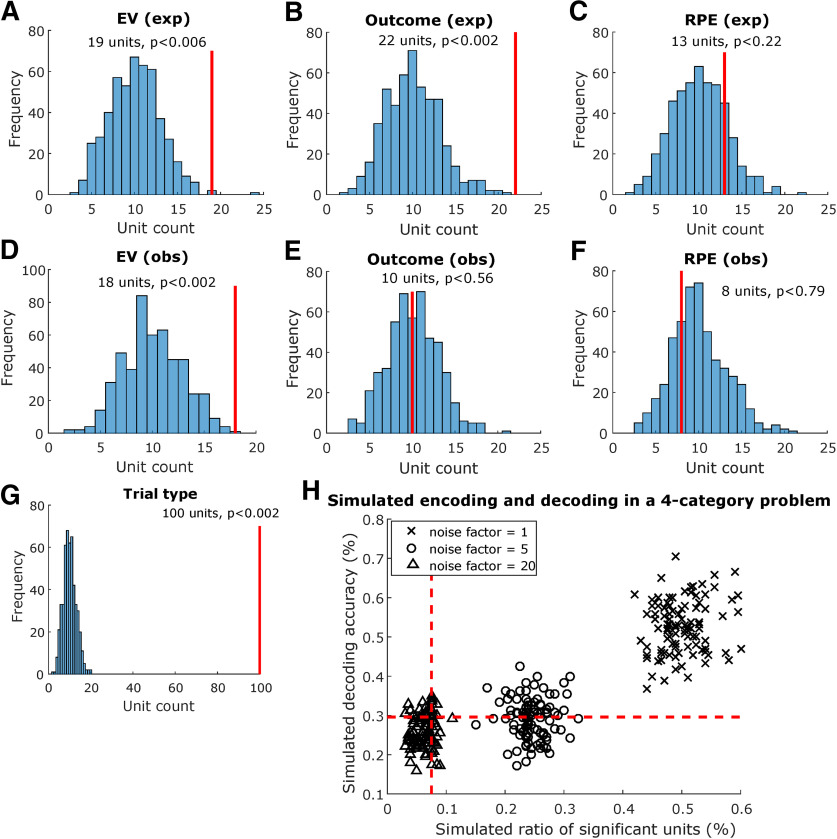
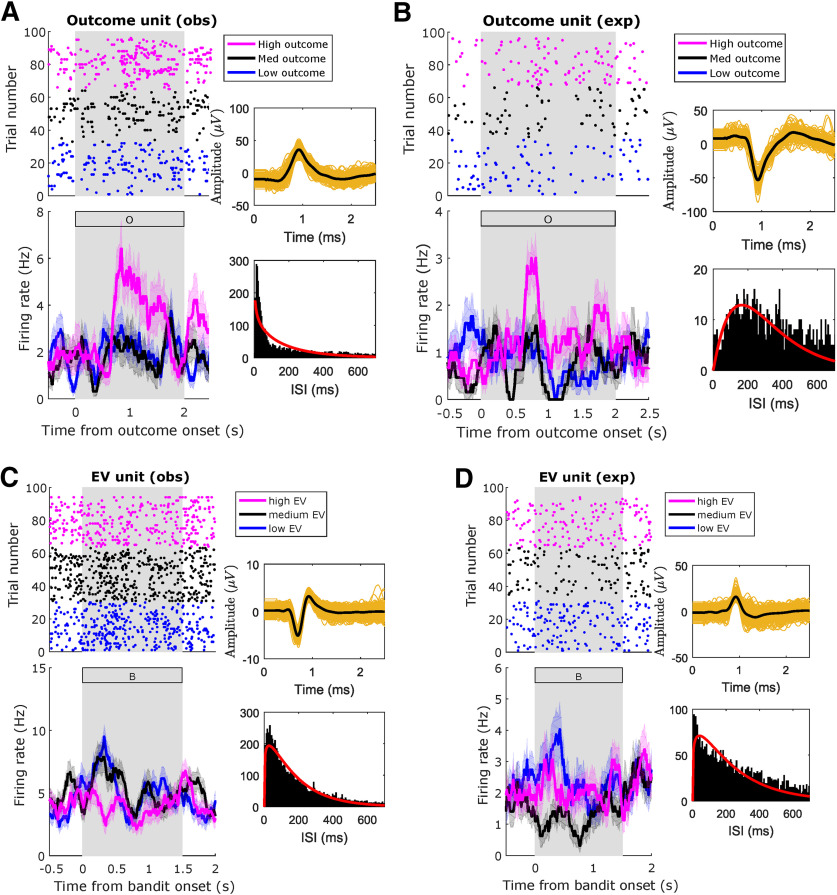
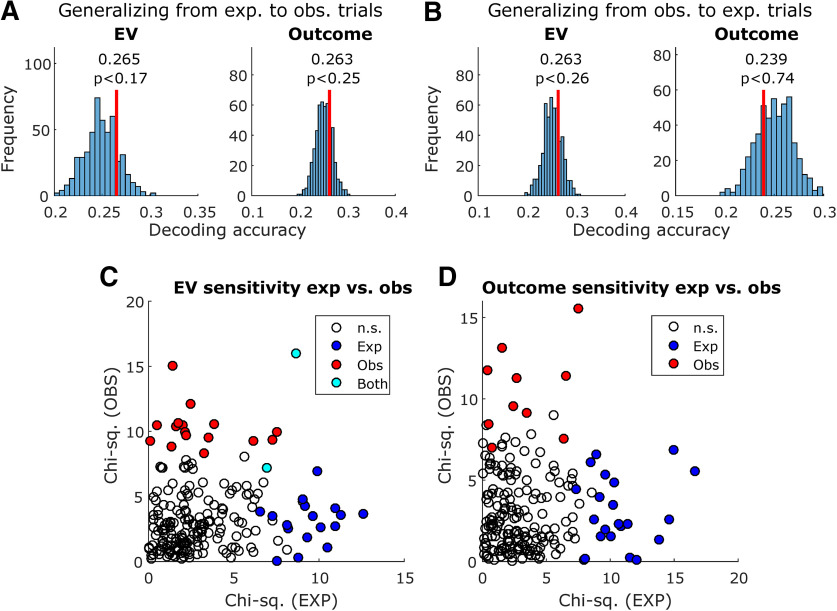
The amygdala plays an important role in many aspects of social cognition and reward learning. Here, we aimed to determine whether human amygdala neurons are involved in the computations necessary to implement learning through observation. We performed single-neuron recordings from the amygdalae of human neurosurgical patients (male and female) while they learned about the value of stimuli through observing the outcomes experienced by another agent interacting with those stimuli. We used a detailed computational modeling approach to describe patients' behavior in the task. We found a significant proportion of amygdala neurons whose activity correlated with both expected rewards for oneself and others, and in tracking outcome values received by oneself or other agents. Additionally, a population decoding analysis suggests the presence of information for both observed and experiential outcomes in the amygdala. Encoding and decoding analyses suggested observational value coding in amygdala neurons occurred in a different subset of neurons than experiential value coding. Collectively, these findings support a key role for the human amygdala in the computations underlying the capacity for learning through observation.SIGNIFICANCE STATEMENT Single-neuron studies of the human brain provide a unique window into the computational mechanisms of cognition. In this study, epilepsy patients implanted intracranially with hybrid depth electrodes performed an observational learning (OL) task. We measured single-neuron activity in the amygdala and found a representation for observational rewards as well as observational expected reward values. Additionally, distinct subsets of amygdala neurons represented self-experienced and observational values. This study provides a rare glimpse into the role of human amygdala neurons in social cognition.

Keywords: decision making; human electrophysiology; intracranial recordings; observational learning; reinforcement learning; social cognition.


Figures

Figure 1.
Figure 1.
OL task. A, Block structure. The task had 288 trials in total, in four blocks of 72 trials. Each block contained either experiential or OL trials, as well as choice trials. Block order was interleaved, and bandit values were reversed after the end of block 2. B, Reward structure. Reward was accrued to subjects' total only in experiential trials, and reward feedback was only presented in learning trials, both in experiential and observational blocks. C, Learning trials structure. Top row, Experiential learning trials. After a fixation cross of jittered duration between 1 and 2 s, subjects viewed a one-armed bandit whose tumbler was spun after 0.5 s. After a 1-s spinning animation, subjects received outcome feedback, which lasted for 2 s. Bottom row, OL trials. Subjects observed a video of another player experiencing learning trials with the same structure. Critically, outcomes received by the other player were not added to the subject's total. Lower bar, Timing of trial events in seconds. D, Choice trials structure. Subjects chose between the two bandits shown in the learning trials of the current block. After deciding, the chosen bandit's tumbler spun for 1 s, and no outcome feedback was presented.
Figure 2.
Figure 2.
Behavior and RL model. A, Accuracy rate of all sessions as defined by the fraction of free trials in which a subject chose the bandit with highest mean payout, discarding the first 25% of trials in each block. Each color represents a different session, for experiential and observational trials, with average and standard error indicated on the left and right. Accuracy in experiential and observational trials was not significantly different (p < 0.66, two-sample t test), n.s., not significant. The dashed red line indicates the chance level estimated by the theoretical 95th percentile of correct proportions, obtained from an agent making random decisions with p = 0.5. B, Typical time course of modeled EVs throughout the task, using the RL (counterfactual) model. Bandit 1 (exp) and Bandit 2 (exp) indicate EVs for each of the two bandits shown in experiential blocks, respectively, whereas Bandit 1 (obs) and Bandit 2 (obs) indicate EVs for each of the two bandits shown in observational blocks, respectively. C, Parameter fits for each valid session, for the chosen RL model. The model contained a single learning rate (α) for experiential and observational trials and an inverse temperature β. Dark blue horizontal lines indicate parameter means, and cyan horizontal lines indicate SE.
Figure 3.
Figure 3.
Model comparison. A, Protected exceedance probability. This is the probability that each one of the four models fit using HBI (RL split, RL no split, counterfactual, and HMM) was more likely than any other, taking into account the possibility that there is no difference between models. B, Model frequency. This is the proportion of individual patients whose behavior is better explained by each model. The counterfactual learning model outperforms the others both in terms of protected exceedance probability and model frequency.
Figure 4.
Figure 4.
Amygdala population decoding analysis. A, Entire trial decoding. The tested variable was trial type (experiential vs observational). The vertical red line indicates average decoding accuracy in held-out trials after training with a maximum Pearson correlation classifier. The histogram indicates decoding accuracy in each instance of a permutation test, shuffling variable labels; p values were obtained by computing the proportion of permutation iterations in which the decoding accuracy exceeded the true decoding accuracy. B, Same, decoding within the preoutcome period. Decoded variables, from left to right, were EV (experiential) and EV (observational). C, Same, decoding within the postoutcome period. Decoded variables, from left to right, were outcome (experiential), outcome (observational), RPE (experiential), and RPE (observational).
Figure 5.
Figure 5.
Amygdala single-neuron encoding analysis. A, Preoutcome encoding of EV in experiential trials. Solid red lines indicate how many units were found to be sensitive to the tested variable within the preoutcome period. Histograms indicate how many units were sensitive to the tested variable in each iteration of the permutation test, shuffling variable labels; p values were obtained by computing the proportion of permutation iterations in which unit counts exceeded the true unit count. Similarly, we tested encoding for (B) experiential outcome in the postoutcome period, (C) experiential RPE in the postoutcome period, (D) observational EV in the preoutcome period, (E) observational outcome in the postoutcome period, (F) observational RPE in the postoutcome period, and (G) trial type in whole trials. H, Comparing encoding and decoding in a simulated four-category problem with varying noise levels. We simulated 96 trials with 200 artificial Poisson type neurons whose latent firing rate varied linearly as a function of an artificial categorical variable, chosen randomly between 1 and 4 for each trial. Noise was added to the latent firing rate of each neuron scaled by a noise factor of 1 (crosses), 5 (circles), or 20 (triangles), and simulations were repeated 100 times for each noise level. Each data point in the plot represents one individual simulation. Dashed red lines indicate theoretical chance levels for encoding (vertical) and decoding (horizontal).
Figure 6.
Figure 6.
Amygdala neuron raster plot examples. Example amygdala units, significantly modulated by the indicated regressors, in the indicated conditions. A, Unit modulated by outcome in observational trials during postoutcome period. B, Unit modulated by outcome in experiential trials during postoutcome period. C, Unit modulated by EV in observational trials during preoutcome period. D, Unit modulated by EV in experiential trials during preoutcome period. Top, Raster plots. For plotting purposes only, we reordered trials by regressor levels by obtaining three quantiles from the variable of interest (magenta: high; black: medium; blue: low). Bottom, PSTH (bin size = 0.2 s, step size = 0.0625 s). The annex panels to the right of each raster display spike waveforms (top) and ISI histograms (bottom) from the plotted neuron. Background gray rectangles postoutcome periods (A, B) or preoutcome periods (C, D). Rectangles filled with a letter indicate which stimulus was present on the screen at that time (B: bandit; O: outcome).
Figure 7.
Figure 7.
Comparing decoding and encoding across experiential and observational trials. A, Decoding generalization, training a decoder in experiential trials and testing in observational trials. Decoded variables were EV (left) and outcome (right). Vertical red lines indicate decoding accuracy, and histograms indicate decoding accuracy in each instance of the permutation test with shuffled variable labels; p values were obtained by computing the proportion of permutation iterations in which the decoding accuracy exceeded the true decoding accuracy. B, Same, but training in observational trials and testing in experiential trials. C, Sensitivity to EV in each unit, as obtained in the encoding analysis, plotted for experiential trials (x-axis) and observational trials (y-axis). Sensitivity was defined as the χ2 value obtained from the Kruskal–Wallis test used in the encoding analysis. Unfilled data points indicate not sensitive units, blue data points indicate units only sensitive to experiential EV, red data points indicate units only sensitive to observational EV, and cyan data points indicate units sensitive to both experiential and observational EV. D, Same, but for outcome sensitivity.

References

    1. Adolphs R. (2010) What does the amygdala contribute to social cognition? Ann NY Acad Sci 1191:42–61. 10.1111/j.1749-6632.2010.05445.x - DOI - PMC - PubMed
    1. Adolphs R, Tranel D, Damasio AR (1998) The human amygdala in social judgment. Nature 393:470–474. 10.1038/30982 - DOI - PubMed
    1. Aggleton J, Burton M, Passingham R (1980) Cortical and subcortical afferents to the amygdala of the rhesus monkey (Macaca mulatta). Brain Res 190:347–368. 10.1016/0006-8993(80)90279-6 - DOI - PubMed
    1. Baxter MG, Parker A, Lindner CC, Izquierdo AD, Murray EA (2000) Control of response selection by reinforcer value requires interaction of amygdala and orbital prefrontal cortex. J Neurosci 20:4311–4319. 10.1523/JNEUROSCI.20-11-04311.2000 - DOI - PMC - PubMed
    1. Bechara A, Damasio H, Damasio AR, Lee GP (1999) Different contributions of the human amygdala and ventromedial prefrontal cortex to decision-making. J Neurosci 19:5473–5481. 10.1523/JNEUROSCI.19-13-05473.1999 - DOI - PMC - PubMed

Publication types

LinkOut - more resources