. 2020 May 7;5(9):e133497.
doi: 10.1172/jci.insight.133497.

T cell exosome-derived miR-142-3p impairs glandular cell function in Sjögren's syndrome

Affiliations

T cell exosome-derived miR-142-3p impairs glandular cell function in Sjögren's syndrome

Juan Cortes-Troncoso et al. JCI Insight. .

Abstract

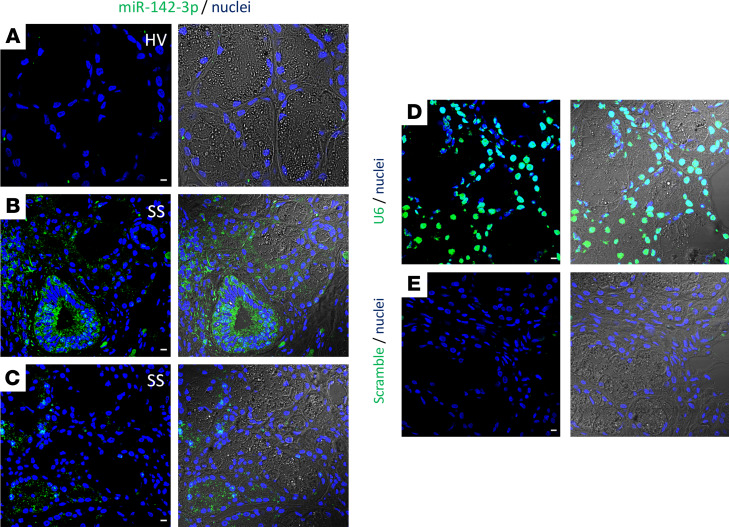
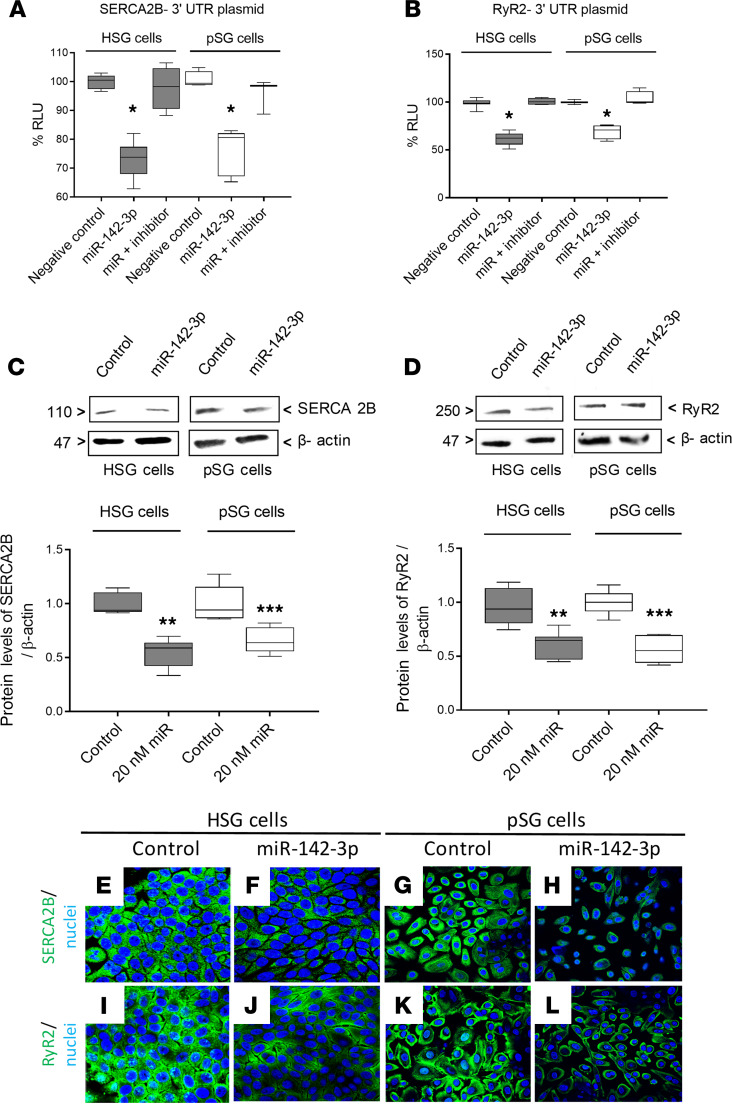
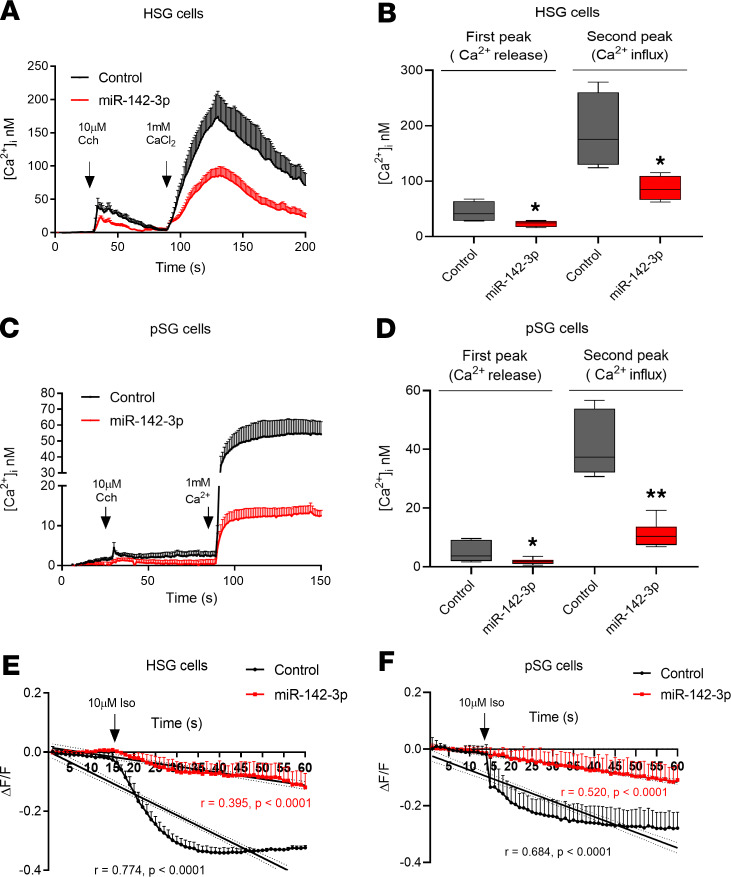
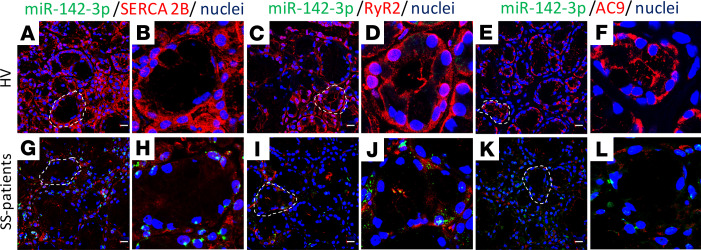
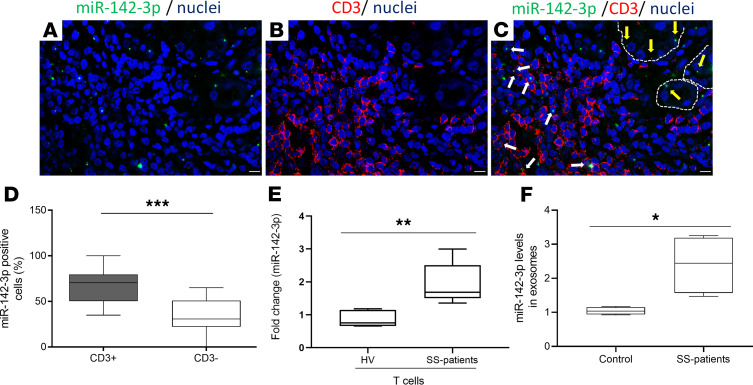
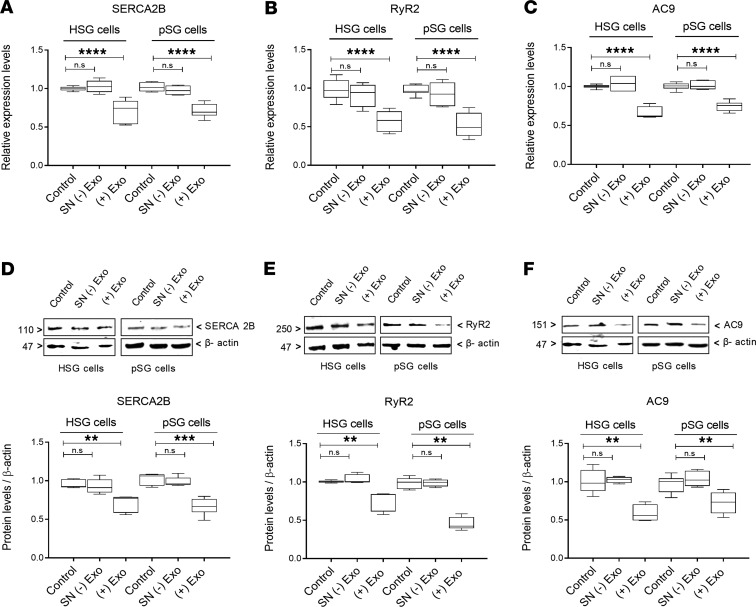
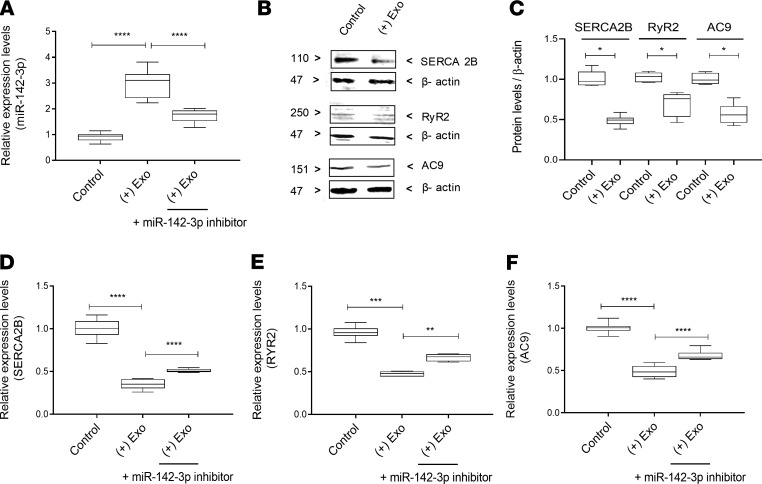
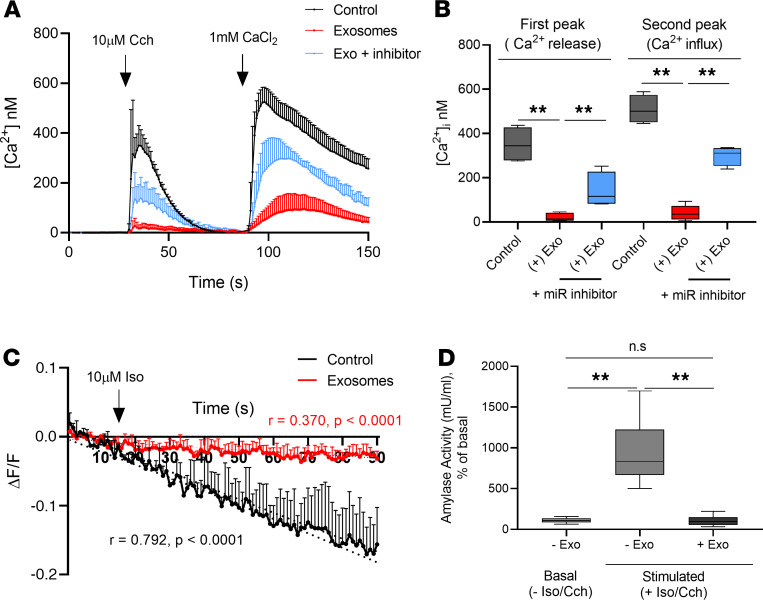
Sjögren's syndrome (SS) is a systemic autoimmune disease that mainly affects exocrine salivary and lacrimal glands. Local inflammation in the glands is thought to trigger glandular dysfunction and symptoms of dryness. However, the mechanisms underlying these processes are incompletely understood. Our work suggests T cell exosome-derived miR-142-3p as a pathogenic driver of immunopathology in SS. We first document miR-142-3p expression in the salivary glands of patients with SS, both in epithelial gland cells and within T cells of the inflammatory infiltrate, but not in healthy volunteers. Next, we show that activated T cells secreted exosomes containing miR-142-3p, which transferred into glandular cells. Finally, we uncover a functional role of miR-142-3p-containing exosomes in glandular cell dysfunction. We find that miR-142-3p targets key elements of intracellular Ca2+ signaling and cAMP production - sarco(endo)plasmic reticulum Ca2+ ATPase 2b (SERCA2B), ryanodine receptor 2 (RyR2), and adenylate cyclase 9 (AC9) - leading to restricted cAMP production, altered calcium signaling, and decreased protein production from salivary gland cells. Our work provides evidence for a functional role of the miR-142-3p in SS pathogenesis and promotes the concept that T cell activation may directly impair epithelial cell function through secretion of miRNA-containing exosomes.

Keywords: Autoimmune diseases; Autoimmunity.


Conflict of interest statement

Conflict of interest: The authors have declared that no conflict of interest exists.

Figures

Figure 1
Figure 1. miR-142-3p expression in minor salivary gland tissues.
(AC) ISH of miR-142-3p in human minor salivary gland biopsies of healthy volunteers (HVs) and patients with SS. (D and E) ISH of U6 (positive control) and scrambled miRNA (negative control). (AE) Left panels are ISH of miR-142-3p, U6, and negative control. Right panels represent transmission light combined with ISH for miR-142-3p, U6, and scramble RNA negative control. miRNA and U6 were stained by green, and cell nuclei were stained by blue. Scale bar: 10 μm. HVs; n = 3, SS patients; n = 4.
Figure 2
Figure 2. SERCA2B and RyR2 are both targets of miR-142-3p in HSG and pSG cells.
(A and B) Dual luciferase reporter assays in HSG and pSG. Cells were cotransfected with plasmid 3′-UTR SERCA2B or 3′-UTR RyR2 and miR-142-3p mimic or miRNA hairpin inhibitor. Luciferase activity was measured in relative light units (RLU) (n = 4, median, maximum, and minimum shown). Statistical significance was determined by Mann-Whitney nonparametric test; *P < 0.05. (C and D) Protein levels of SERCA2B and RyR2 in HSG and pSG transfected with or without miR-142-3p mimic. (n = 5, median, maximum, and minimum shown; **P < 0.01, and ***P < 0.001 determined by Mann-Whitney nonparametric test.) The box plots depict the minimum and maximum values (whiskers), the upper and lower quartiles, and the median. The length of the box represents the interquartile range. (EL) Immunofluorescence staining for SERCA2B and RyR2 (both green) in HSG and pSG transfected with or without miR-142-3p mimic. Cell nuclei were stained DAPI (blue). Scale bar: 10 μm. (n = 3 experiments per condition, 3 fields of view evaluated per experiment.)
Figure 3
Figure 3. Ca2+ signaling and cAMP production are disrupted in miR-142-3p–transfected HSG and pSG cells.
(A and C) HSG and pSG cells loaded with Fluo-4-AM were stimulated with carbachol (Cch) (concentration, 10 μM) with or without 1 mM Ca2+ externally. Time course of [Ca2+]i in HSG and pSG cells. (B and D) Quantification of calcium release and influx peaks in HSG and pSG cells that were transfected with (red) and without (black) miR-142-3p mimic (n = 4, median, maximum, and minimum shown). Statistical significance was determined by Mann-Whitney nonparametric test; *P < 0.05, and **P < 0.01 (20 cells per condition, n = 4 experiments). The box plots depict the minimum and maximum values (whiskers), the upper and lower quartiles, and the median. The length of the box represents the interquartile range. (E and F) Time course of cAMP production. cADD, a cAMP biosensor, loaded in HSG and pSG cells that were stimulated with isoproterenol (Iso) (concentration, 10 μM). Linear regression analysis of cAMP production versus time in control salivary epithelial cells (black) and miR-142-3p mimic–transfected salivary epithelial cells (red). Averages of 4 independent experiments are shown with their standard deviation (20 cells per condition, n = 4 experiments).
Figure 4
Figure 4. Expression of SERCA2B, RyR2, and AC9 is reduced in SGs of patients with SS.
(AL) Double ISH/immunofluorescence staining in paraffin-embedded sections from minor SG biopsies of healthy volunteers and patients with SS. B, D, F, H, J, and L are higher magnification (×60) images of indicated (outlined) areas in A, C, E, G, I, and K. (A and G) miR-142-3p expression (green) and SERCA2B (red), (C and I) miR-142-3p (green) and RyR2 (red), and (E and K) miR-142-3p (green) and AC9 (red). Cell nuclei were stained with DAPI (blue). Scale bar: 10 μm. Representative of healthy volunteers, n = 3; SS patients, n = 4.
Figure 5
Figure 5. miR-142-3p is upregulated in salivary gland lesions and within secreted T cell exosomes from patients with SS.
(AC) ISH for miR-142-3p (green) and immunofluorescence staining for CD3+ T cells (red) were performed on paraffin-embedded sections from minor SG biopsies of patients with SS. Merged image shows several CD3+ T cell/miR-142-3p–coexpressing cells. White arrows point to miR-142-3p expressed by CD3+ T cells. Yellow arrows point to miR-142-3p expressed by epithelial cells. Cell nuclei were stained with DAPI (blue). Scale bar: 10 μm. (Representative images n = 4 SS patients.) (D) Fluorescence intensity quantification of miR-142-3p in T cells (CD3+) and non-T cells (CD3) from minor SG biopsies of SS patients. (SS patients, n = 4.) (n = 12, median, maximum, and minimum shown.) Statistical significance was determined by Mann-Whitney nonparametric test; ***P < 0.001. (E) Expression of miR-142-3p in CD3+ T cells from PBMCs of healthy volunteers and SS patients (healthy volunteers, n = 4; SS patients, n = 4) (n = 4, median, maximum, and minimum shown). Statistical significance was determined by Mann-Whitney nonparametric test; **P < 0.01. (F) Expression of miR-142-3p in serum exosomes from healthy volunteers and SS patients (healthy volunteers, n = 4; SS patients, n = 4) (n = 4, median, maximum, and minimum shown). Statistical significance was determined by Mann-Whitney nonparametric test; *P < 0.05. The box plots depict the minimum and maximum values (whiskers), the upper and lower quartiles, and the median. The length of the box represents the interquartile range.
Figure 6
Figure 6. SERCA2B, RyR2, and AC9 expression in epithelial cells is altered by T cell exosomes.
(AC) mRNA expression for SERCA2B, RyR2, and AC9 in HSG and pSG cells. (DF) Representative Western blots and relative protein levels of SERCA2B, RyR2, and AC9 in HSG and pSG cells obtained by densitometric analysis. HSG and pSG cells were treated with complete epithelial cell medium (control), exosome-depleted supernatant [SN (-) Exo], or pure exosomes isolated from activated T cells [(+) Exo]. Figure 6, D and F, are derived from the same blots and thus share the same loading control. The box plots depict the minimum and maximum values (whiskers), the upper and lower quartiles, and the median. The length of the box represents the interquartile range. (n = 5, median, maximum, and minimum shown; **P < 0.01, ***P < 0.001, and ****P < 0.0001, determined by Mann-Whitney nonparametric test.) n.s, not significant.
Figure 7
Figure 7. SERCA2B, RyR2, and AC9 expression is altered by T cell exosomes in 3D cultures of HSG acini.
(A) miR-142-3p expression in 3D HSG acini that were treated with complete epithelial cell medium (control), pure exosomes isolated from activated T cells, or pure exosomes isolated from activated T cells and miR-142-3p hairpin inhibitor. (B) Western blots of SERCA2B, RyR2, and AC9 in 3D HSG acini that were treated with complete epithelial cell medium (control) and pure exosomes isolated from activated T cells. (C) Graph shows relative protein levels of SERCA2B, RyR2, and AC9 in 3D HSG acini obtained by densitometric analysis. (DF) Relative mRNA levels of SERCA2B, RyR2, and AC9 in 3D HSG acini that were treated with complete epithelial cell medium (control), pure exosomes isolated from activated T cells, or pure exosomes isolated from activated T cells and miR-142-3p hairpin inhibitor. (n = 5, median, maximum, and minimum shown; *P < 0.05, **P < 0.01, ***P < 0.001, and ****P < 0.0001, determined by Mann-Whitney nonparametric test.) The box plots depict the minimum and maximum values (whiskers), the upper and lower quartiles, and the median. The length of the box represents the interquartile range.
Figure 8
Figure 8. T cell–derived exosomes affect Ca2+ signaling, cAMP production, and amylase secretion in 3D cultures of HSG acini.
(A and B) Internal Ca2+ concentration was measured in 3D HSG acini. 3D HSG acini were treated with complete epithelial cell medium (black), exosomes isolated from activated T cells (red), or exosomes and miR-142-3p inhibitor (light blue). 3D HSG acini were loaded with Fluo-4-AM. Time course of [Ca2+]i induced by stimulation of 3D HSG acini with 10 μM Cch in the absence or presence of external CaCl2(A) and quantification of calcium release entry peaks (B) (n = 4, median, maximum, and minimum shown). Statistical significance was determined by Mann-Whitney nonparametric test; **P < 0.01. (There were 15 cells per condition, n = 4 experiments.) (C) Time course of cAMP production in cADDis cAMP biosensor–loaded 3D acini that were stimulated with Iso (10 μM). Linear regression analysis of cAMP production versus time in 3D acini control (black) and 3D acini treated with pure exosomes isolated from activated T cells (red). (There were 15 cells per condition, n = 3 experiments.) (D) Summary for the percentage of amylase activity with respect to basal condition under 10 μM Cch and 10 μM Iso stimulation (n = 6, median, maximum, and minimum shown). Statistical significance was determined by Mann-Whitney nonparametric test; **P < 0.01. The box plots depict the minimum and maximum values (whiskers), the upper and lower quartiles, and the median. The length of the box represents the interquartile range.

Similar articles

Cited by

References

    1. Mavragani CP, Moutsopoulos HM. Sjögren’s syndrome. Annu Rev Pathol. 2014;9:273–285. doi: 10.1146/annurev-pathol-012513-104728. - DOI - PubMed
    1. Brito-Zerón P, et al. Influence of geolocation and ethnicity on the phenotypic expression of primary Sjögren’s syndrome at diagnosis in 8310 patients: a cross-sectional study from the Big Data Sjögren Project Consortium. Ann Rheum Dis. 2017;76(6):1042–1050. doi: 10.1136/annrheumdis-2016-209952. - DOI - PubMed
    1. Alevizos I, Alexander S, Turner RJ, Illei GG. MicroRNA expression profiles as biomarkers of minor salivary gland inflammation and dysfunction in Sjögren’s syndrome. Arthritis Rheum. 2011;63(2):535–544. doi: 10.1002/art.30131. - DOI - PMC - PubMed
    1. Gebert LFR, MacRae IJ. Regulation of microRNA function in animals. Nat Rev Mol Cell Biol. 2019;20(1):21–37. doi: 10.1038/s41580-018-0045-7. - DOI - PMC - PubMed
    1. Kapsogeorgou EK, Gourzi VC, Manoussakis MN, Moutsopoulos HM, Tzioufas AG. Cellular microRNAs (miRNAs) and Sjögren’s syndrome: candidate regulators of autoimmune response and autoantigen expression. J Autoimmun. 2011;37(2):129–135. doi: 10.1016/j.jaut.2011.05.003. - DOI - PubMed

Publication types

MeSH terms