. 2020 May 6;11(1):2219.
doi: 10.1038/s41467-020-15902-9.

Disruption of ATRX-RNA interactions uncovers roles in ATRX localization and PRC2 function

Affiliations

Disruption of ATRX-RNA interactions uncovers roles in ATRX localization and PRC2 function

Wenqing Ren et al. Nat Commun. .

Abstract

Heterochromatin in the eukaryotic genome is rigorously controlled by the concerted action of protein factors and RNAs. Here, we investigate the RNA binding function of ATRX, a chromatin remodeler with roles in silencing of repetitive regions of the genome and in recruitment of the polycomb repressive complex 2 (PRC2). We identify ATRX RNA binding regions (RBRs) and discover that the major ATRX RBR lies within the N-terminal region of the protein, distinct from its PHD and helicase domains. Deletion of this ATRX RBR (ATRXΔRBR) compromises ATRX interactions with RNAs in vitro and in vivo and alters its chromatin binding properties. Genome-wide studies reveal that loss of RNA interactions results in a redistribution of ATRX on chromatin. Finally, our studies identify a role for ATRX-RNA interactions in regulating PRC2 localization to a subset of polycomb target genes.


Conflict of interest statement

The authors declare no competing interests.

Figures
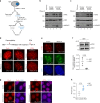
Fig. 1
Fig. 1. RNA interactions regulate ATRX chromatin association.
a Schematic for nuclear fractionation of MEFs with and without RNase A or RNase H treatment. b Western blot for ATRX, LSD1, and HNRNPC in MEF nuclear soluble and chromatin-bound fractions obtained with and without RNase A treatment as indicated on top. Representative blot from four independent experiments is shown. c Western blot for ATRX, LSD1, and HNRNPC in MEF nuclear soluble and chromatin-bound fractions obtained with and without RNase H treatment as indicated. Representative blot from three independent experiments is shown. d Top—Schematic of RNase A or RNase H treatment of MEFs for immunostaining. Bottom—Immunostaining of control (top) and RNase A or RNase H treated (bottom) MEFs with ATRX (red) and Cbx5 (red) antibodies. Percent of nuclei with pericentromeric Cbx5 or ATRX signal is shown along with total number of nuclei (n) quantified. Scale bar = 10 μm. e Immunostaining of control (left) and RNase A treated (right) MEFs with ATRX (red) and Npm1 (green) antibodies. Nucleus is stained with DAPI. Percent of nuclei with pericentromeric ATRX signal or nucleolar Npm1 signal is shown along with total number of nuclei (n) quantified. Scale bar = 10 μm. f Top—Western blot for ATRX and EZH2 in WT MEFs with and without Actinomycin D treatment. Bottom—RT-PCR analysis of minor satellite transcripts in WT MEFs with and without Actinomycin D treatment. Data are presented as mean values +/− SEM. P values are calculated using two-sided Student’s t test. g Immunostaining of WT MEFs with ATRX and Cbx5 antibodies (red) before and after Actinomycin D treatment. Percent of nuclei with pericentromeric Cbx5 or ATRX signal is shown along with total number of nuclei (n) quantified. Scale bar = 10 μm. h Cross-linking and immunoprecipitation in WT MEFs with IgG (gray) or ATRX antibodies (dark blue). qPCR analysis with minor satellite primers. Data are presented as mean values +/− SEM. P values are calculated using two-sided Student’s t test. Source data underlying Fig. 1b–h are provided as a Source Data file.
Fig. 2
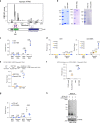
Fig. 2. RBR-ID identifies regions within ATRX that bind RNA.
a Top—Residue-level RBR-ID scores plotted along the primary sequence of human ATRX. Data are from eight biological replicates processed in two separate experiments. Bottom—Schematic for location of RNA binding peptides along human ATRX. PHD finger domain is in gray and helicase domain in dark blue. The region we designate the RBR is in green. b Coomassie gel of purified GST and GST-RBR (left), ATRX helicase domain (middle), and full-length ATRX and ATRXΔRBR (right) proteins. Representative image from three independent protein purifications is shown. c In vitro DNA/RNA IP with GST (gray) and GST-RBR (blue) proteins as indicated with MBP or Xist Repeat A DNA/RNA. Data are presented as mean values +/− SEM. P values are calculated using two-sided Student’s t test. d In vitro RNA IP with GST (left) and GST-RBR (right) proteins at indicated concentrations with MBP or Xist Repeat A RNA. Data are presented as mean values +/− SEM. P values are calculated using two-sided Student’s t test. e In vitro RNA IP with GST and GST-RBR and a mixture of MBP and Repeat A RNAs. Data are presented as mean values +/− SEM. P values are calculated using two-sided Student’s t test. f In vitro RNA IP with FLAG-ATRX helicase, GST-RBR and Repeat A RNA. Flag beads alone or GST are used as controls. Data are presented as mean values +/− SEM. P values are calculated using two-sided Student’s t test. g In vitro DNA/RNA IP with ATRX (gray) and ATRXΔRBR (blue) proteins as indicated with MBP or Xist Repeat A DNA/RNA. Data are presented as mean values +/− SEM. P values are calculated using two-sided Student’s t test. h RNA IP with purified proteins as indicated and total RNAs from MEFs. RNA is visualized by SYBR gold staining and immunoprecipitated proteins are detected by western blot. Source data are provided as a Source Data file. Representative image from three independent experiments is shown. Source data underlying Fig. 2b–h are provided as a Source Data file.
Fig. 3
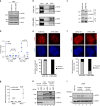
Fig. 3. ATRXΔRBR has reduced RNA and chromatin interactions in vivo.
a Western blot for ATRX, DAXX, and Actin in equal amount (50 μg) of WT and ATRXΔRBR nuclear extract. Representative image from four independent experiments is shown. b Endogenous immunoprecipitation (IP) of ATRX from WT and ATRXΔRBR MEFs. IgG is used as a control. Immunoprecipitates are analyzed with ATRX and DAXX antibodies. Source data are provided as a Source Data file. Representative image from three independent experiments is shown. c Immunoprecipitation (IP) with HA agarose from HA-ATRX and HA-ATRXΔRBR transfected HEK293. Immunoprecipitated proteins are analyzed with HA and DAXX antibodies. Representative image from three independent experiments is shown. d UV-RIP in WT and ATRXΔRBR MEFs as indicated with IgG (gray) or ATRX antibodies (dark blue). qPCR analysis with primers spanning Xist exon 1–3 and U1 snRNAs. Data are presented as mean values +/− SEM. P values are calculated using two-sided Student’s t test. e Top—Immunostaining of WT and ATRXΔRBR MEFs with ATRX antibodies (red) and DAPI (blue). Bottom—Quantification of nuclei that show normal (gray) or reduced (black) enrichment of ATRX on centromeric/pericentromeric heterochromatin. WT n = 127 and ATRXΔRBR n = 189. Scale bar = 10 μm. f Top—Immunostaining of Cbx5 (red) in WT and ATRXΔRBR MEFs. Nucleus is stained with DAPI (blue). Bottom—Quantification of nuclei that show normal (gray) or diffuse (black) enrichment of CBX5 on centromeric/pericentromeric heterochromatin. WT n = 151 and ATRXΔRBR n = 136. Scale bar = 10 μm. g RT-PCR analysis of major and minor satellite transcripts in WT and ATRXΔRBR. Data are presented as mean values +/− SEM. P values are calculated using two-sided Student’s t test. h Western blot for ATRX, EZH2, and Tubulin in cytosol, nuclear soluble, and chromatin-bound fractions from WT and ATRXΔRBR MEFs. Positions of full length and ATRXΔRBR are shown with asterisks (*). Representative image from three independent experiments is shown. i Western blot for ATRX, and EZH2 in ATRXΔRBR MEF nuclear soluble and chromatin bound fractions obtained with and without RNase A treatment as indicated on top. Representative image from three independent experiments is shown. Source data underlying Fig. 3a–i are provided as a Source Data file.
Fig. 4
Fig. 4. ATRX genome-wide distribution relies on RNA-dependent and independent mechanisms.
a ATRX and ATRXΔRBR peak distribution in MEFs at TSS, gene body and intergenic sites. b Venn diagram of peak overlap between ATRX and ATRXΔRBR. Total number of peaks in each sample and their overlap is shown. The distribution of newly acquired ATRXΔRBR peaks to promoters and gene bodies is indicated in the bar graph. c Genome browser view of Slc25a16 gene showing IgG (gray) and ATRX (purple) CUT&RUN tracks from WT ATRX and ATRXΔRBR cells. d Genome browser view of Gins2 gene showing gain of ATRX signal (purple) in ATRXΔRBR. RNA Polymerase II (RNAPII, yellow) and H3K4me3 (green) ChIP-Seq tracks are shown. e Metaplot for RNAPII and H3K4me3 at TSS of ATRX peaks that are unique to WT MEFs (blue) and ATRX peaks that are unique to ATRXΔRBR (red). f Model ATRX binds RNAs that contain G-rich motifs and this prevents ATRX accumulation on chromatin (top). Loss of RNA interactions results in relocation of ATRXΔRBR to the G-rich DNA sequences on the gene body (bottom).
Fig. 5
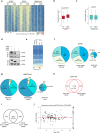
Fig. 5. ATRXΔRBR accumulation at ectopic sites results in recruitment of PRC2 and results in derepression of a subset of PRC2 targets.
a Heatmaps of ATRX, EZH2, and H3K27me3 signal across all TSS that acquire ATRX signal in ATRXΔRBR, sorted by ATRXΔRBR EZH2 signal. b, c Boxplots of read densities (Log2 scale) in WT ATRX and ATRXΔRBR for EZH2 (red) and H3K27me3 (teal) at ATRX peaks that are acquired at TSS in ATRXΔRBR. Each boxplot represents median (center line), interquartile range (box), and min-max range (whiskers). Read densities are computed over 2600 TSS that acquire ATRX in ATRXΔRBR. P values are calculated using two-sided Student’s t test. d Co-IP of ATRX, ATRXΔRBR, and PRC2 as indicated. Western blot detection using ATRX and EZH2 antibodies. Source data are provided as a Source Data file. Representative image from three independent experiments is shown. e Heatmap showing expression of genes that acquire ATRX peaks at TSS in ATRXΔRBR compared with their expression in WT ATRX cells. f EZH2 peak distribution in WT, ATRXΔRBR, and ATRX KD MEFs at TSS, gene body and intergenic sites. Total peak number is shown for each sample. g H3K27me3 peak distribution in WT, ATRXΔRBR and ATRX KD MEFs at TSS, gene body and intergenic sites. Total peak number is shown for each sample. h Venn diagram showing overlap between TSS that contain EZH2 in ATRX and ATRXΔRBR. Total number of peaks in each sample and their overlap is shown. P < 0.005, hypergeometric distribution. i Venn diagram showing overlap between genes that lose ATRX and EZH2 in ATRXΔRBR. Gene numbers in each sample and their overlap is shown. P < 0.005, hypergeometric distribution. j MA plot showing RNA-Seq TPM of 152 genes that lose EZH2 from TSS in ATRXΔRBR MEFs. A positive Log2 Fold Change indicates derepression in ATRXΔRBR.

Similar articles

Cited by

References

    1. Batista PJ, Chang HY. Long noncoding RNAs: cellular address codes in development and disease. Cell. 2013;152:1298–1307. - PMC - PubMed
    1. Bonasio R, Shiekhattar R. Regulation of transcription by long noncoding RNAs. Annu Rev. Genet. 2014;48:433–455. - PMC - PubMed
    1. Shields EJ, Petracovici AF, Bonasio R. lncRedibly versatile: biochemical and biological functions of long noncoding RNAs. Biochem. J. 2019;476:1083–1104. - PMC - PubMed
    1. Gibbons R. Alpha thalassaemia-mental retardation, X linked. Orphanet J. Rare Dis. 2006;1:15. - PMC - PubMed
    1. Chu HP, et al. TERRA RNA antagonizes ATRX and protects telomeres. Cell. 2017;170:86–101. - PMC - PubMed

Publication types