. 2020 Oct;27(10):2904-2920.
doi: 10.1038/s41418-020-0550-z. Epub 2020 May 6.

Chemical activation of SAT1 corrects diet-induced metabolic syndrome

Affiliations

Chemical activation of SAT1 corrects diet-induced metabolic syndrome

Francesca Castoldi et al. Cell Death Differ. 2020 Oct.

Abstract

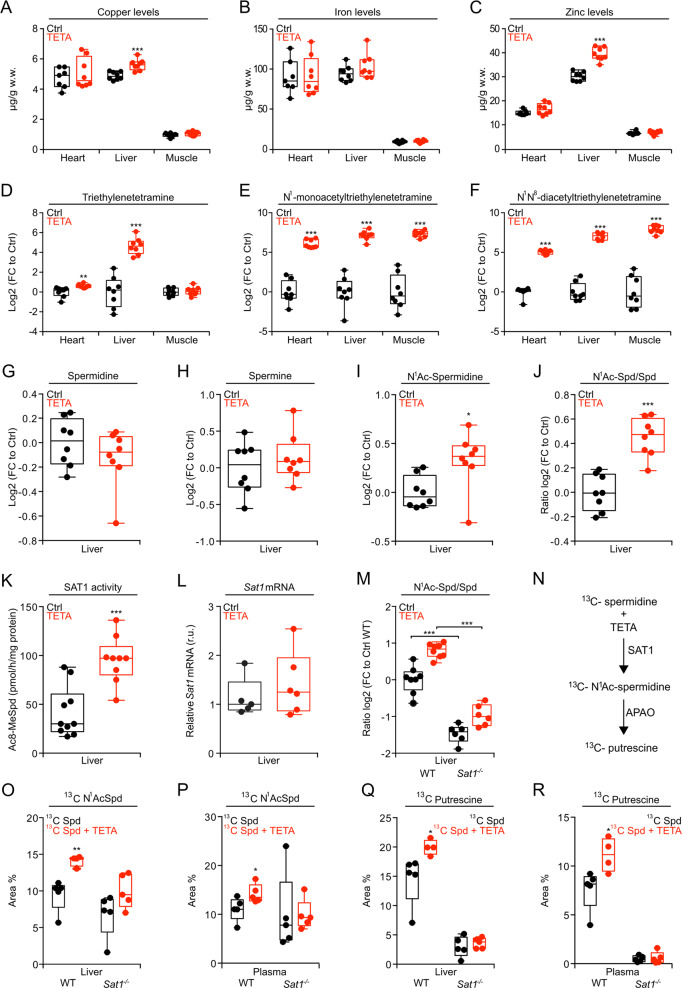
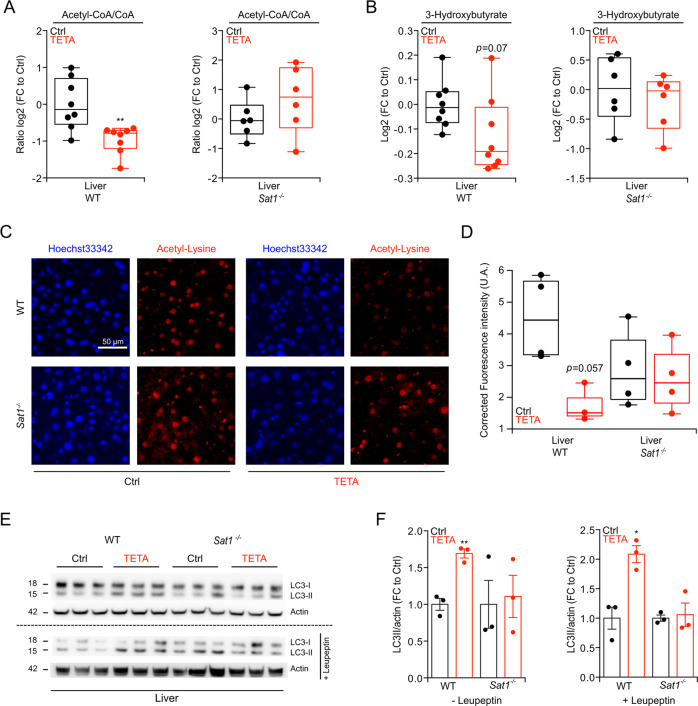
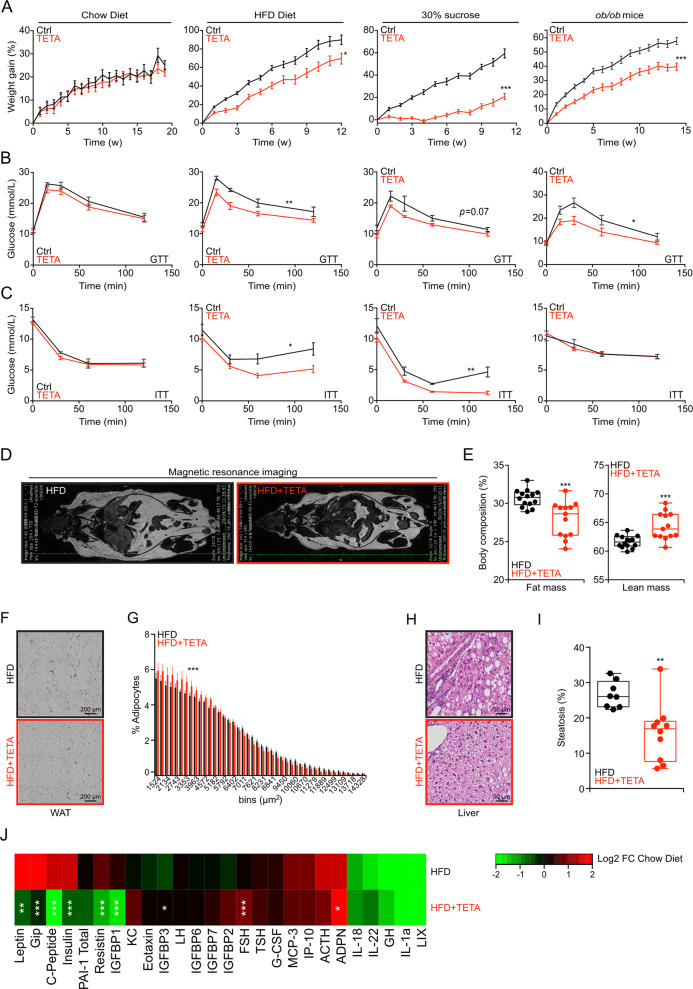
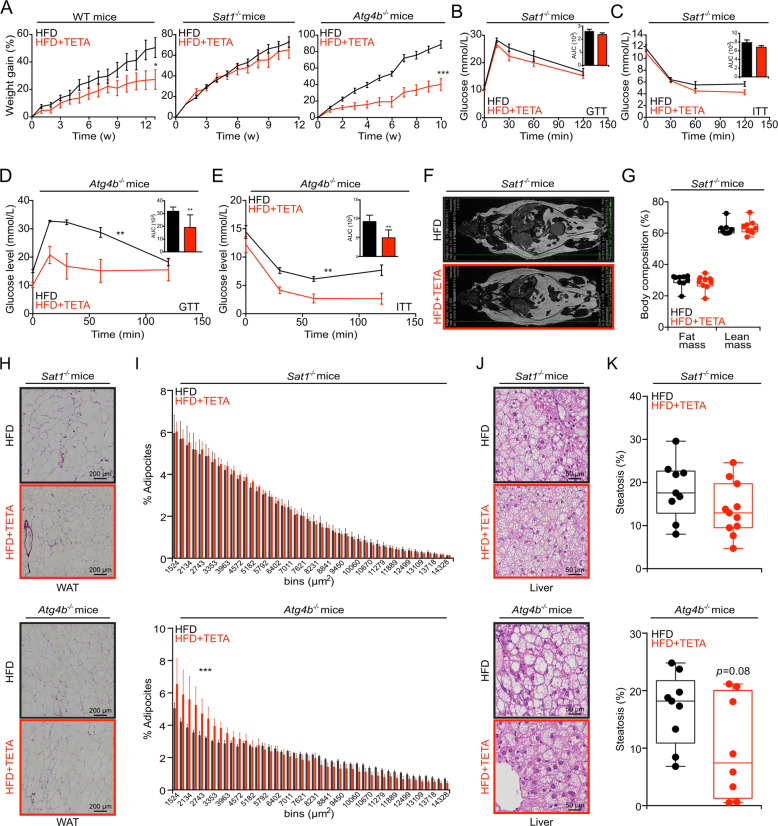
The pharmacological targeting of polyamine metabolism is currently under the spotlight for its potential in the prevention and treatment of several age-associated disorders. Here, we report the finding that triethylenetetramine dihydrochloride (TETA), a copper-chelator agent that can be safely administered to patients for the long-term treatment of Wilson disease, exerts therapeutic benefits in animals challenged with hypercaloric dietary regimens. TETA reduced obesity induced by high-fat diet, excessive sucrose intake, or leptin deficiency, as it reduced glucose intolerance and hepatosteatosis, but induced autophagy. Mechanistically, these effects did not involve the depletion of copper from plasma or internal organs. Rather, the TETA effects relied on the activation of an energy-consuming polyamine catabolism, secondary to the stabilization of spermidine/spermine N1-acetyltransferase-1 (SAT1) by TETA, resulting in enhanced enzymatic activity of SAT. All the positive effects of TETA on high-fat diet-induced metabolic syndrome were lost in SAT1-deficient mice. Altogether, these results suggest novel health-promoting effects of TETA that might be taken advantage of for the prevention or treatment of obesity.


Conflict of interest statement

GK and FM are co-founders of Samsara Therapeutics. GK and FP hold a patent protecting new medical use for TETA. FM is a co-founder of The Longevity Labs. TE has equity interests in The Longevity Labs. GK is a consultant for The Longevity Labs.

Figures

Fig. 1
Fig. 1. Metabolic effects of TETA on mice.
Wild-type (WT) C57BL/6JOlaHsd male mice fed a chow diet, were treated with TETA (3000 ppm dissolved in drinking water) starting at 7 weeks of age. After 2 weeks of treatment, the organs (heart, liver, and muscle) were collected for the determination of metals (a–c) (n = 7/8 mice/group), TETA, and its mono- or diacetylated metabolites (d–f) (n = 8 mice/group). g–j In addition, in the liver of mice, the endogenous levels of polyamines were measured (n = 8 mice/group). WT male mice, fed a chow diet, were treated with TETA and, after 5 weeks, livers were collected, and the hepatic SAT1 activity (k) (n = 9/10 mice) and Sat1 mRNA expression (l) (n = 5/6 mice) were determined. m WT and Sat1−/− male mice were treated with TETA (3000 ppm) for 2 weeks. The ratio N1-acetylspermidine over spermidine was then assessed in the liver (n = 6/8 mice/group). n Schematic representation of polyamine flux. WT and Sat1−/− male mice were treated with TETA (3000 ppm) for 2 weeks. 13C-spermidine was injected intraperitoneally (i.p., 50 mg/kg) 3 h before the recovery of livers and plasma for the mass spectrometric quantitation of 13C N1-acetylspermidine (o, p) and 13C putrescine (q, r) (n = 4/5 mice/group). In this figure, the results are displayed as box-and-whisker plots, which show median, first and third quartiles, and maximum and minimum values (a–m, o–r). Circles indicate each mouse used in the experiment. For statistical analyses, p values were calculated by two-tailed unpaired Student’s t test (a–l, o–r), comparing TETA-treated with -untreated mice (*p < 0.05, **p < 0.01, ***p < 0.001), or in (m) comparing WT with Sat1−/− mice in control and TETA-treated group (***p < 0.001). APAO acetylpolyamineoxidase, Ctrl control, FC fold change, r.u. relative units, SAT1 spermidine/spermine N1-acetyltransferase-1, Spd spermidine, w.w. wet weight.
Fig. 2
Fig. 2. Acetyl-CoA depletion, deacetylation, and autophagy induction by TETA.
WT or Sat1−/− male mice (7 weeks old) were treated with TETA (3000 ppm in drinking water) for 2 weeks, and livers were collected to determine the acetyl-CoA/CoA ratio (a) and the abundance of 3-hydroxybutyrate (b) by mass spectrometry analysis (n = 6/8 mice/group). c, d TETA was injected i.p. (100 mg/kg), into WT or Sat1−/− male mice to determine, 8 h later, the level of Nε lysine acetylation of hepatic proteins by indirect immunofluorescence (representative images in c, quantitation in d) (n = 3/4 mice/group). e, f In the same experimental conditions described in (c, d), the autophagy- associated level of LC3 lipidation was evaluated in the absence or presence of leupeptin (i.p., 15 mg/kg) administered 2 h before the recovery of livers (representative blots in e, quantitation in f) (n = 3 mice/group in each experiment. N = 3 and N = 2 different experiments were performed without and with leupeptin injection, respectively). In this figure, the results are displayed as box-and-whisker plots, which show median, first and third quartiles, and maximum and minimum values (a, b and d) or mean ± s.e.m. (f). Circles, in the graphs, indicate each mouse used in the experiment. Statistical comparisons were done by two-tailed unpaired Student’s t test (a, b and f) comparing TETA-treated with -untreated mice (*p < 0.05, **p < 0.01). Statistical comparisons in d were done by applying a Wilcoxon test (*p < 0.05), comparing TETA-treated with control mice. Ctrl control, FC fold change, UA arbitrary units.
Fig. 3
Fig. 3. Metabolic effects of TETA in the context of obesogenic diets or leptin deficiency.
a–c WT mice received standard chow diet (Ctrl = 10 and TETA = 9 mice), a high-fat diet (HFD) (n = 10 mice/group), or normal chow diet with 30% sucrose in the drinking water (n = 10 mice/group), for at least 12 weeks in the presence, or not, of TETA administration (3000 ppm in drinking water or daily i.p. injection, 100 mg/kg). Similarly, leptin-deficient ob/ob male mice (Ctrl = 9 and TETA = 10 mice), receiving a normal diet, were treated, or not, with TETA (3000 ppm in drinking water). Body weight was monitored weekly (a), and glucose- (b) or insulin-tolerance (c) tests were performed after 6–7 weeks of treatment, except for ob/ob male mice to whom the metabolic tests were performed after 11–12 weeks of treatment (chow diet: GTT and ITT, n = 5 mice/condition; HFD: GTT, n = 10 mice/group, ITT Ctrl = 9 and TETA = 10 mice; sucrose 30%: GTT 5 mice/group and ITT Ctrl = 5 and TETA = 4 mice; ob/ob mice: GTT Ctrl = 9 and TETA = 8 mice, ITT Ctrl = 9 and TETA = 7 mice; one representative experiment). d, e In addition, at 12 weeks of TETA treatment in HFD-fed mice, body composition was determined by magnetic resonance imaging (representative images in d and quantitation in e) (n = 13/14 mice/group). f–i Moreover, visceral white adipose tissues (representative images in f and quantification in g) or livers (representative images in h and quantification in i) were removed and subjected to hematoxylin and eosin staining, and image analysis for quantification of the surface of individual adipocytes (g) (Ctrl = 10 and TETA = 8 mice), or the occupancy of the liver by lipid droplets (i) (n = 8/10 mice per condition), was performed. j In addition, at 12 weeks of treatments, plasma was drawn and subjected to a multiplexed quantification of multiple hormones and cytokines, plotting a heat map (HFD vs. normal diet) in otherwise untreated or TETA-treated mice (n = 5 mice/condition). In this figure, the results are displayed as box-and-whisker plots, which show median, first and third quartiles, and maximum and minimum values (e, i) or mean ± s.e.m. (g). Circles, in the graphs, indicate each mouse used in the experiment. For statistical analysis, longitudinal statistical comparisons for mice weight gain, were performed by Wald test (a) (**p < 0.01, ***p < 0.001); p values were determined by two-tailed unpaired Student’s t test (for b, c, areas under the curve in Fig. S3a, b, and e, i) comparing TETA-treated with -untreated mice (*p < 0.05, **p < 0.01, ***p < 0.001); p values in g were done by means of a Kolmogorov–Smirnov test comparing TETA-treated with -untreated mice (***p < 0.001). In j statistical comparisons were done by Wilcoxon test (*p < 0.05, **p < 0.01, ***p < 0.001). Ctrl control, FC fold change, GTT glucose-tolerance test, HFD high-fat diet, min minutes, ITT insulin-tolerance test, w weeks, WAT white adipose tissues. Cytokines: ACTH adrenocorticotropic hormone, ADPN adiponectin, FSH follicle-stimulating hormone, G-CSF granulocyte colony-stimulating factor, GH growth hormone, Gip gastric-inhibitory polypeptide, IGFBP-1/2/3/6/7 insulin-like growth factor-binding protein 1/2/3/6/7, IL-18/22/1a interleukin, IP-10 interferon gamma-induced protein 10, KC keratinocyte chemoattractant, LH luteinizing hormone, LIX lipopolysaccharide-inducible CXC chemokine, MCP-3 monocyte chemotactic protein-3, PAI-1 total plasminogen activator inhibitor-1, TSH thyroid-stimulating hormone.
Fig. 4
Fig. 4. SAT1-dependent metabolic effects of TETA.
a Male mice with the indicated genotypes (WT, Sat1−/−, or Atg4b−/−) were subjected to a HFD diet in the presence, or not, of TETA administration (3000 ppm in drinking water) for at least 10 weeks of treatment, and the body weight was monitored weekly (WT: Ctrl = 9 and TETA = 10 mice; Sat1−/−: Ctrl = 8 and TETA = 7 mice; Atg4b−/−: Ctrl = 10 and TETA = 8 mice). Glucose-tolerance tests (b, d) and insulin-tolerance tests (c, e) were performed after 6–11 weeks of treatment in Sat1−/− (Ctrl = 8 and TETA = 7 mice) and Atg4b−/− mice (Ctrl = 8 and TETA = 5 mice), respectively. After 12 weeks, Sat1−/− mice were subjected to magnetic resonance imaging, representative image in f, and quantitation in g (n = 9 mice/group). Histological analysis of visceral white adipose tissue (h, i), liver histopathology (j, k), was performed and quantified in Sat1−/− (upper panels; for visceral white adipose tissue analysis: Ctrl =9  and TETA = 12 mice; for liver histopathology: Ctrl = 9 and TETA = 11 mice) and Atg4b−/− (lower panels; for visceral white adipose tissue analysis: Ctrl = 10 and TETA = 8 mice; for liver histopathology: Ctrl = 9 and TETA = 8 mice). Representative images are shown in h, j, and quantifications are reported in i, k, respectively. In this figure, the results are displayed as box-and-whisker plots, which show median, first and third quartiles, and maximum and minimum values (g, k) or mean ± s.e.m. (i). Circles, in the graphs, indicate each mouse used in the experiment. Longitudinal statistical comparisons for mice weight gain, were performed by Wald test (a) (*p < 0.05, ***p < 0.001). For statistical analysis, p values were calculated by two-tailed unpaired Student’s t test (b–e calculating the related AUC, and g, k) comparing TETA-treated with -untreated mice. Statistical comparisons in i were done by means of a Kolmogorov–Smirnov test comparing TETA-treated with control group. The HFD control group of Sat1−/− mice in a–c is shared with Fig. S4a–c; HFD control group of Sat1−/− mice in f is shared with the control group in Fig. S4d, as well as the control group in h–k is shared with Fig. S4f–i. AUC area under the curve, Ctrl control, GTT glucose-tolerance test, HFD high-fat diet, min minutes, ITT insulin-tolerance test, min minutes, w weeks, WAT white adipose tissues.

Similar articles

Cited by

References

    1. Madeo F, Eisenberg T, Pietrocola F, Kroemer G. Spermidine in health and disease. Science. 2018;359:pii: eaan2788. - PubMed
    1. Eisenberg T, Abdellatif M, Schroeder S, Primessnig U, Stekovic S, Pendl T, et al. Cardioprotection and lifespan extension by the natural polyamine spermidine. Nat Med. 2016;22:1428–38.. - PMC - PubMed
    1. Eisenberg T, Knauer H, Schauer A, Buttner S, Ruckenstuhl C, Carmona-Gutierrez D, et al. Induction of autophagy by spermidine promotes longevity. Nat Cell Biol. 2009;11:1305–14. - PubMed
    1. Kiechl S, Pechlaner R, Willeit P, Notdurfter M, Paulweber B, Willeit K, et al. Higher spermidine intake is linked to lower mortality: a prospective population-based study. Am J Clin Nutr. 2018;108:371–80.. - PubMed
    1. Levine B, Kroemer G. Biological functions of autophagy genes: a disease perspective. Cell. 2019;176:11–42. - PMC - PubMed

Publication types