. 2020 May 6;10(1):7696.
doi: 10.1038/s41598-020-64725-7.

Structural and mechanical remodeling of the cytoskeleton maintains tensional homeostasis in 3D microtissues under acute dynamic stretch

Affiliations

Structural and mechanical remodeling of the cytoskeleton maintains tensional homeostasis in 3D microtissues under acute dynamic stretch

Matthew Walker et al. Sci Rep. .

Abstract

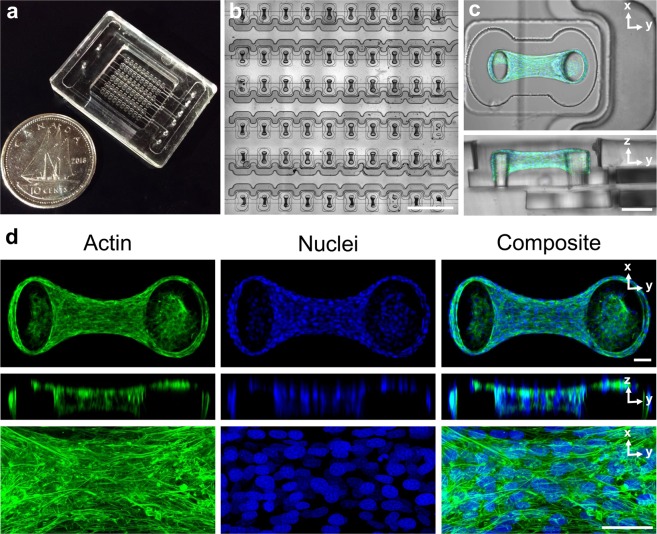
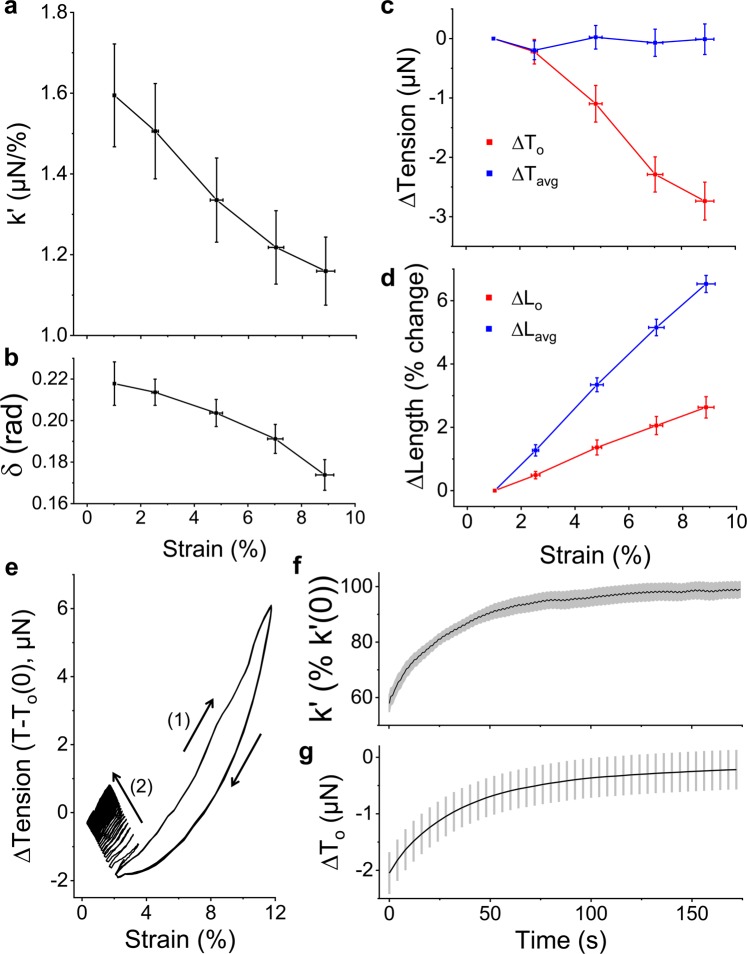
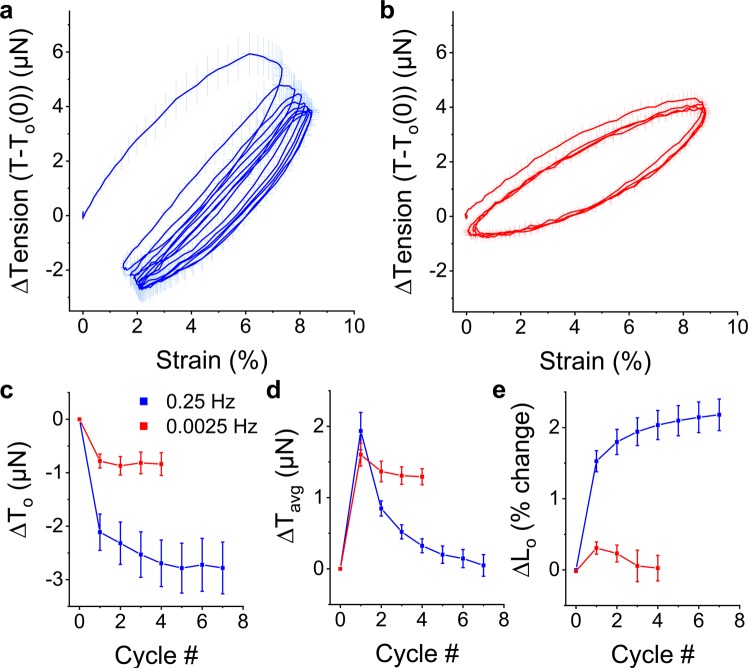
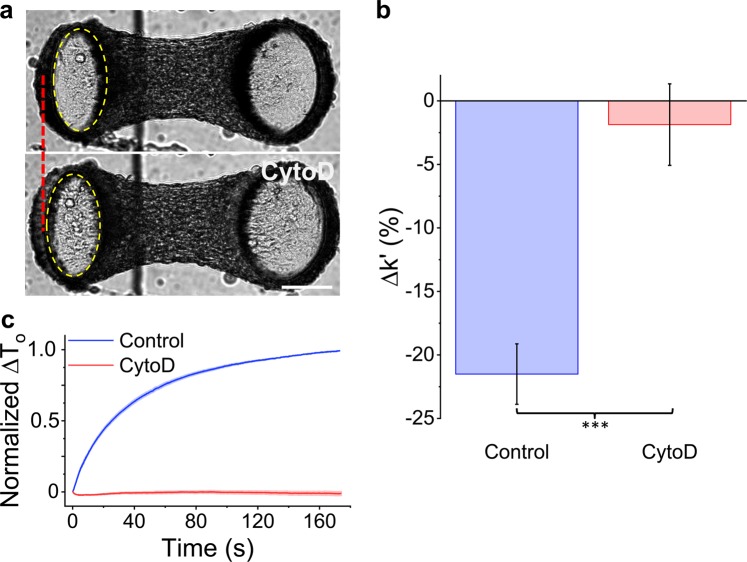
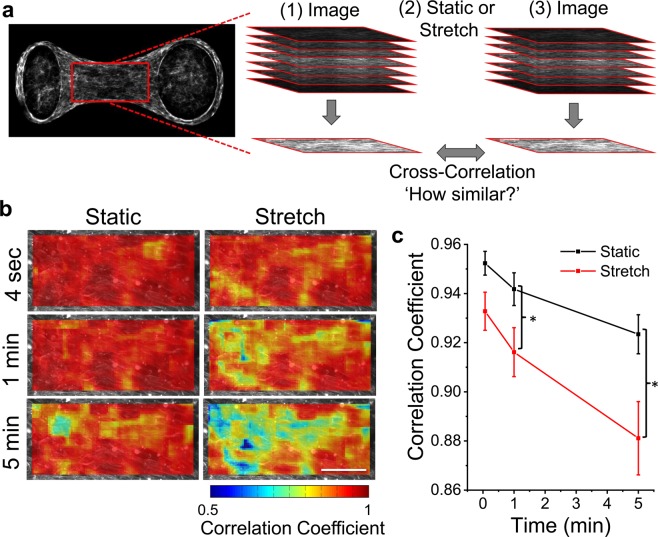
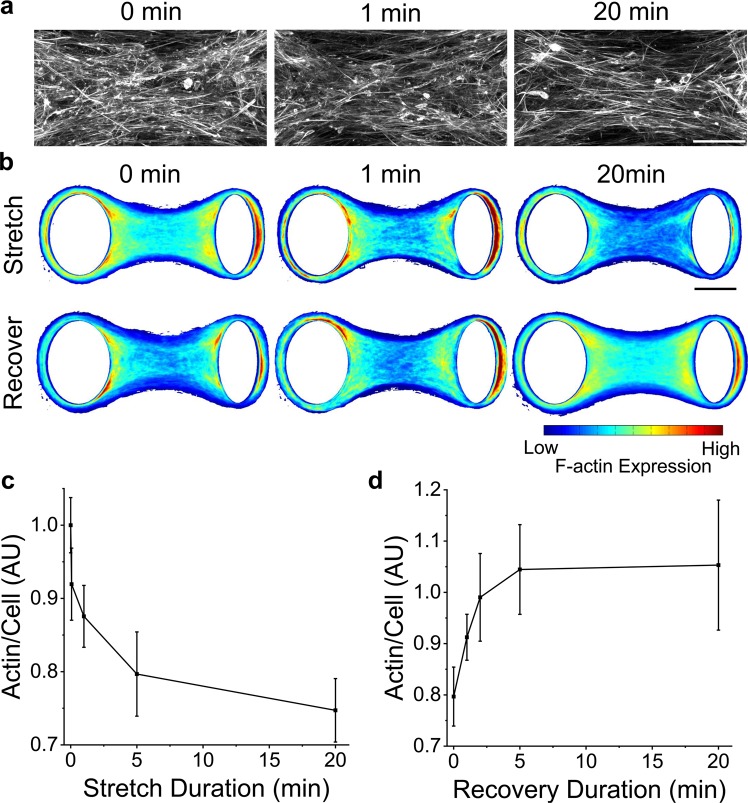
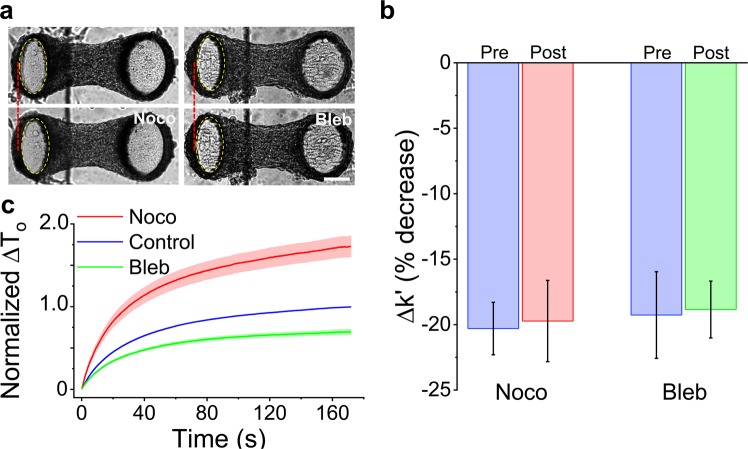
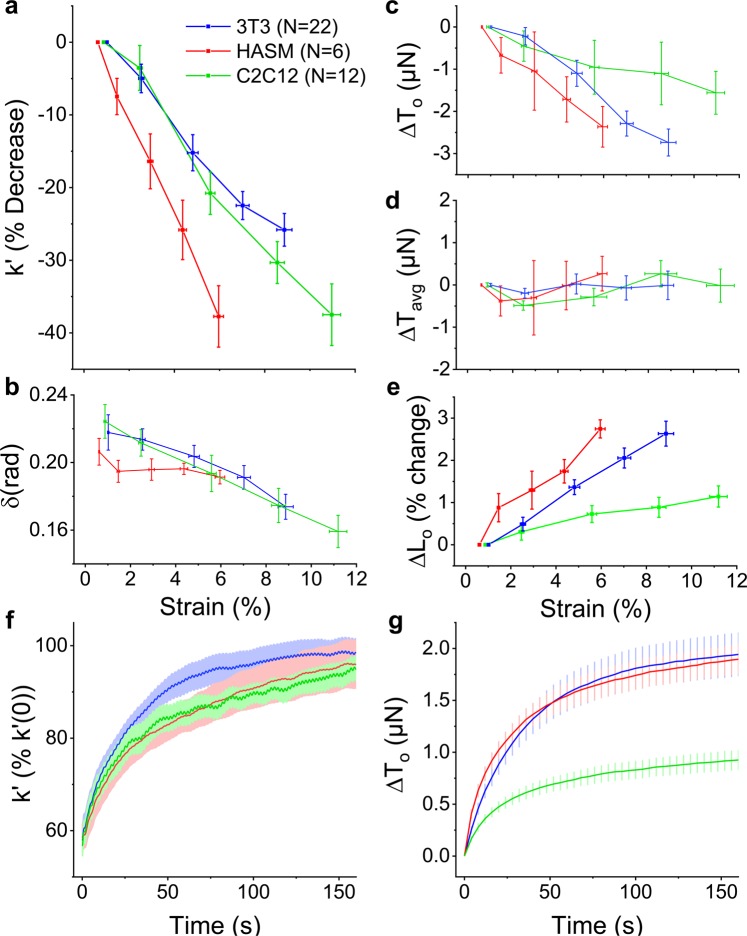
When stretched, cells cultured on 2D substrates share a universal softening and fluidization response that arises from poorly understood remodeling of well-conserved cytoskeletal elements. It is known, however, that the structure and distribution of the cytoskeleton is profoundly influenced by the dimensionality of a cell's environment. Therefore, in this study we aimed to determine whether cells cultured in a 3D matrix share this softening behavior and to link it to cytoskeletal remodeling. To achieve this, we developed a high-throughput approach to measure the dynamic mechanical properties of cells and allow for sub-cellular imaging within physiologically relevant 3D microtissues. We found that fibroblast, smooth muscle and skeletal muscle microtissues strain softened but did not fluidize, and upon loading cessation, they regained their initial mechanical properties. Furthermore, microtissue prestress decreased with the strain amplitude to maintain a constant mean tension. This adaptation under an auxotonic condition resulted in lengthening. A filamentous actin cytoskeleton was required, and responses were mirrored by changes to actin remodeling rates and visual evidence of stretch-induced actin depolymerization. Our new approach for assessing cell mechanics has linked behaviors seen in 2D cultures to a 3D matrix, and connected remodeling of the cytoskeleton to homeostatic mechanical regulation of tissues.


Conflict of interest statement

The authors declare no competing interests.

Figures

Figure 1
Figure 1
The MVAS-Force allows high throughput dynamic mechanical measurements of 3D cell cultures. The MVAS-force was microfabricated from three photolithographic masters (a). It comprises of an array of microtissue wells each bordered by a controllable vacuum chamber (b). A top-down and cross-section view of a microtissue is shown in (c). Microtissues are dense, organized, three-dimensional cell cultures that are freely suspended around the cantilevers. Max projections of confocal stacks, orthogonal views and high magnification images are shown in (d). The actin cytoskeleton is in green and the nuclei are in blue. Both the cytoskeleton and nuclei show a high degree of organization, aligning between the cantilevers. Scale bars in b,c and d, represent 1 mm, 100 μm and 50 μm, respectively.
Figure 2
Figure 2
3T3 fibroblast microtissues strain soften to maintain a constant mean stress. The storage stiffness, k’, (a), phase lag between stress and strain, δ, (b) and prestress, T0, (c) all decreased with increasing the oscillatory strain amplitude (N = 22). Importantly, the decrease to the stiffness and prestress led to a constant mean stress, Tavg, (c) despite a linear increase to mean microtissue length, Lavg (d). Under an auxotonic condition, these behaviors increased the offset microtissue length, Lo. To see whether these responses were reversible, microtissues were oscillated under a large amplitude strain until subsequent loading loops overlapped (1) and then suddenly switched to a small amplitude strain (2) (e). Both the storage stiffness (f) and prestress (g) fully recovered to their initial values over 160 seconds with similar rates (N = 8). In this figure, the prestress and mean stress are expressed as the difference from the smallest strain amplitude.
Figure 3
Figure 3
Adaptation to oscillatory loading depends upon the loading frequency. Average (N = 6) conditioning cycles from rest at 0.25 Hz and 0.0025 Hz are shown in (a,b), respectively. In both cases, the prestress decreased with subsequent loading cycles towards a new set point but to a greater extent with faster loading frequencies (c). While the mean tension remained elevated when oscillations were slowly applied, it decreased with additional cycles towards the resting tension at 0.25 Hz (d). Under an auxotonic condition and when the oscillation frequency was faster than the recovery time constant (1/f ≪ τ), these behaviors resulted in a progressive lengthening response (e). However, this lengthening response was absent when the oscillation frequency was slower than the recovery time constant (1/f ≫ τ).
Figure 4
Figure 4
Softening requires an intact actin cytoskeleton. Images of a microtissue prior to and following CytoD treatment are in panel (a). As shown by the dotted red line and the dotted yellow ellipse that outlines the top of the force-sensing cantilever (left), depolymerization of F-actin with Cytochalasin D (CytoD) visibly moved the cantilever outward, indicating a lower resting tension. Importantly, CytoD treatment reduced the stiffness change under large vs. small amplitude stretching (ie. the amount of strain softening) (b). There was also no tension recovery following stretch cessation (c). The scale bar in (a) represents 100 μm.
Figure 5
Figure 5
Oscillatory stretch increases remodeling of actin filaments in living cells in 3D culture. The effect of oscillatory stretch on the actin remodeling rate was measured across centrally located regions (212 × 106 µm; red rectangle) in living microtissues using live-cell staining and comparing confocal stacks taken immediately before and after various durations of stretching or static culture (a). Representative heat maps of cross-correlation coefficients show that actin remodeling was spatially heterogeneous and increased with large amplitude stretching vs. static conditions (b). The average correlation coefficient was significantly reduced (ie. a greater amount of remodeling had occurred) when stretching vs. static after 1 min and 5 min (b). The scale bar in (b) represents 50 μm. (*P < 0.05; N = 6 repeated measures t-test).
Figure 6
Figure 6
F-actin depolymerizes with stretching and repolymerizes upon stretch cessation. Representative images after different durations of stretching show that there were fewer actin filaments with longer stretch durations (a). F-actin expression in average heat maps was similarly reduced with stretch duration (b) (N > 14). Moreover, f-actin expression recovered to initial values upon stretch cessation (N > 11). The average actin expression normalized to the number of cells under various durations of stretching and recovery are shown in (c,d), respectively. The scale bars in (a,b) represent 50 and 100 μm, respectively.
Figure 7
Figure 7
Microtubules and myosin do not contribute to softening. Microtissues prior to and following nocodazole and blebbistatin treatments are shown in (a). Microtubule depolymerization with nocodazole moved the force-sensing cantilever inward, indicating increased prestress. In contrast, myosin-II inhibition with blebbistatin moved the cantilever outward, indicating decreased prestress. Neither treatment changed the amount of strain softening in terms of percent change (b). Furthermore, microtubule depolymerization increased the tension recovery while myosin inhibition decreased recovery (c) but neither treatment changed the time constant of the recovery response. The scale bar in (a) represents 100 μm.
Figure 8
Figure 8
Strain softening is a conserved response in microtissue cultures. Microtissues composed of fibroblast (3T3), human airway smooth muscle (HASM), or skeletal muscle (C2C12) cells all strain softened with similar changes to their stiffness (a), phase lag (b), and prestress (c). For all cell types, the mean tension was invariant with the stretch amplitude (d) despite a linear increase to their mean lengths (data not shown). Together these behaviors led to an increased offset microtissue length (e). 3T3, HASM and C2C12 microtissues also shared similar recovery dynamics upon stretch cessation in terms of the rates of their storage stiffness (f) and prestress (g) recovery.

Similar articles

Cited by

References

    1. Eyckmans J, Boudou T, Yu X, Chen CS. A Hitchhiker’s Guide to Mechanobiology. Dev. Cell. 2011;21:35–47. - PMC - PubMed
    1. Ingber DE. Cellular mechanotransduction: putting all the pieces together again. FASEB J. 2006;20:811–27. - PubMed
    1. Mammoto T, Mammoto A, Ingber DE. Mechanobiology and developmental control. Annual review of cell and developmental biology. 2013;29:27–61. - PubMed
    1. Ingber DE. Mechanobiology and diseases of mechanotransduction. Ann. Med. 2003;35:564–77. - PubMed
    1. Lenormand G, Bursac P, Butler JP, Fredberg JJ. Out-of-equilibrium dynamics in the cytoskeleton of the living cell. Phys. Rev. E. 2007;76:041901. - PubMed

Publication types