. 2020 May 6;10(1):7631.
doi: 10.1038/s41598-020-63657-6.

Deforestation and world population sustainability: a quantitative analysis

Affiliations

Deforestation and world population sustainability: a quantitative analysis

Mauro Bologna et al. Sci Rep. .

Abstract

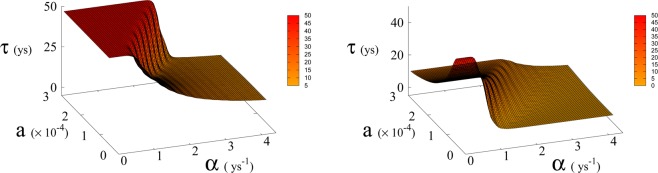
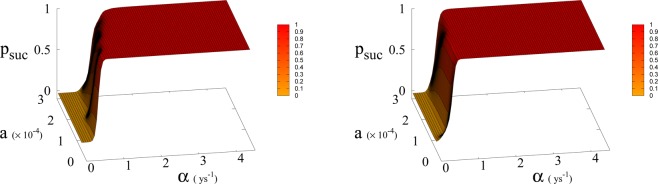
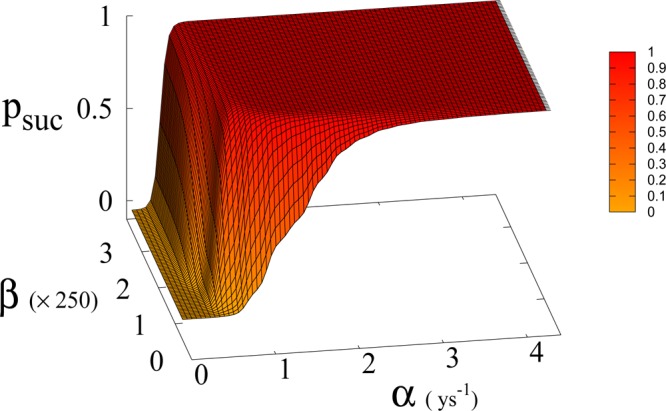
In this paper we afford a quantitative analysis of the sustainability of current world population growth in relation to the parallel deforestation process adopting a statistical point of view. We consider a simplified model based on a stochastic growth process driven by a continuous time random walk, which depicts the technological evolution of human kind, in conjunction with a deterministic generalised logistic model for humans-forest interaction and we evaluate the probability of avoiding the self-destruction of our civilisation. Based on the current resource consumption rates and best estimate of technological rate growth our study shows that we have very low probability, less than 10% in most optimistic estimate, to survive without facing a catastrophic collapse.


Conflict of interest statement

The authors declare no competing interests.

Figures

Figure 1
Figure 1
On the left: plot of the solution of Eq. (1) with the initial condition N0 = 6 × 109 at initial time t = 2000 A.C. On the right: plot of the solution of Eq. (2) with the initial condition R0 = 4 × 107. Here β = 700 and a0 = 10−12.
Figure 2
Figure 2
On the left: plot of the solution of Eq. (1) with the initial condition N0 = 6 × 109 at initial time t = 2000 A.C. On the right: plot of the solution of Eq. (2) with the initial condition R0 = 4 × 107. Here β = 170 and a0 = 10−12.
Figure 3
Figure 3
(Left) Comparison between theoretical prediction of Eq. (15) (black curve) and numerical simulation of Eq. (3) (cyan curve) for γ = 4 (arbitrary units). (Right) Comparison between theoretical prediction of Eq. (15) (red curve) and numerical simulation of Eq. (3) (black curve) for γ = 1/4 (arbitrary units).
Figure 4
Figure 4
(Left panel) Probability psuc of reaching Dyson value before reaching “no-return” point as function of α and a for β = 170. Parameter a is expressed in Km2 ys−1. (Right panel) 2D plot of psuc for a = 1.5 × 10−4 Km2 ys−1 as a function of α. Red line is psuc for β = 170. Black continuous lines (indistinguishable) are psuc for β = 300 and 700 respectively (see also Fig. 6). Green dashed line indicates the value of α corresponding to Moore’s law.
Figure 5
Figure 5
Average time τ (in years) to reach Dyson value before hitting “no-return” point (success, left) and without meeting Dyson value (failure, right) as function of α and a for β = 170. Plateau region (left panel) where τ ≥ 50 corresponds to diverging τ, i.e. Dyson value not being reached before hitting “no-return” point and therefore failure. Plateau region at τ = 0 (right panel), corresponds to failure not occurring, i.e. success. Parameter a is expressed in Km2 ys−1.
Figure 6
Figure 6
Probabilitypsuc of reaching Dyson value before hitting “no-return” point as function of α and a for β = 300 (left) and 700 (right). Parameter a is expressed in Km2 ys−1.
Figure 7
Figure 7
Probability of reaching Dyson value psuc before reaching “no-return” point as function of β and α for a = 1.5 × 10−4 Km2 ys−1.

References

    1. Waring, R. H. & Running, S. W. Forest Ecosystems: Analysis at Multiple Scales (Academic Press, 2007).
    1. The State of the World’s Forests 2018. Forest Pathways to Sustainable Development, Food and Agriculture Organization of the United Nations Rome (2018).
    1. Bologna M, Flores JC. A simple mathematical model of society collapse applied to Easter Island. EPL. 2008;81:48006. doi: 10.1209/0295-5075/81/48006. - DOI
    1. Bologna M, Chandia KJ, Flores JC. A non-linear mathematical model for a three species ecosystem: Hippos in Lake Edward. Journal of Theoretical Biology. 2016;389:83. doi: 10.1016/j.jtbi.2015.10.026. - DOI - PubMed
    1. U.S. Energy Information Administration (EIA), https://www.eia.gov/international/data/world.