. 2020 May;581(7806):94-99.
doi: 10.1038/s41586-020-2238-4. Epub 2020 Apr 29.

Childhood vaccines and antibiotic use in low- and middle-income countries

Affiliations

Childhood vaccines and antibiotic use in low- and middle-income countries

Joseph A Lewnard et al. Nature. 2020 May.

Abstract

Vaccines may reduce the burden of antimicrobial resistance, in part by preventing infections for which treatment often includes the use of antibiotics1-4. However, the effects of vaccination on antibiotic consumption remain poorly understood-especially in low- and middle-income countries (LMICs), where the burden of antimicrobial resistance is greatest5. Here we show that vaccines that have recently been implemented in the World Health Organization's Expanded Programme on Immunization reduce antibiotic consumption substantially among children under five years of age in LMICs. By analysing data from large-scale studies of households, we estimate that pneumococcal conjugate vaccines and live attenuated rotavirus vaccines confer 19.7% (95% confidence interval, 3.4-43.4%) and 11.4% (4.0-18.6%) protection against antibiotic-treated episodes of acute respiratory infection and diarrhoea, respectively, in age groups that experience the greatest disease burden attributable to the vaccine-targeted pathogens6,7. Under current coverage levels, pneumococcal and rotavirus vaccines prevent 23.8 million and 13.6 million episodes of antibiotic-treated illness, respectively, among children under five years of age in LMICs each year. Direct protection resulting from the achievement of universal coverage targets for these vaccines could prevent an additional 40.0 million episodes of antibiotic-treated illness. This evidence supports the prioritization of vaccines within the global strategy to combat antimicrobial resistance8.


Conflict of interest statement

J.A.L. has received consulting fees and research grants from Pfizer, consulting fees and research grants from Merck Sharp & Dohme and research grants from the World Health Organization, all for unrelated work. N.C.L. has received personal fees from the World Health Organization, for unrelated work. All other authors declare no competing interests.

Figures
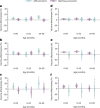
Fig. 1
Fig. 1. Effectiveness of pneumococcal and rotavirus vaccines against illness and antibiotic treatment.
af, The estimated effectiveness against ARI and diarrhoea end points of PCV10/13 (ac) and rotavirus vaccines (df) for all cases (a, d), cases for which treatment or advice was sought (b, e) and cases that were treated with antibiotics (c, f). Estimates were calculated as one minus the matched odds ratio and are shown as vaccine effectiveness. Analyses matched children with each end point to asymptomatic controls on the basis of country, age (within 1 month), visit timing (within 1 month), wealth quintile (country-specific), urbanicity and pentavalent vaccine doses received. The population available for analysis included 5,342 ARI cases (of whom 3,294 sought treatment or advice and 1,913 received antibiotics) and 57,856 controls without ARI; and 9,944 diarrhoea cases (of whom 7,382 sought treatment or advice and 1,437 received antibiotics) and 40,059 controls without diarrhoea (Supplementary Tables 1, 2). Points and lines indicate median estimates and 95% confidence intervals, respectively. We estimated vaccine effectiveness against negative-control end points (PCV10/13 effect against diarrhoea; rotavirus vaccine effect against ARI) to assess residual confounding as a validation step. PCV10/13 exposure was defined as ≥3 doses received. Because all countries in this analysis used Rotarix in their national immunization program, we defined ≥2 doses as a full rotavirus vaccination series. Numerical estimates can be found in Supplementary Tables 3–5. Quantiles are estimated through 2,000 independent draws from the distribution of estimates.
Fig. 2
Fig. 2. Estimates of the attributable fraction for vaccine-preventable infections.
a, b, We illustrate estimates of pathogen-specific attributable fractions of vaccine-serotype pneumococci for children aged 0–59 months (a, left) and 24–59 months (a, right), and rotavirus for children aged 0–23 months (b). c, We also illustrate distributions of vaccine efficacy estimates against infections involving the vaccine-targeted organism, as estimated using meta-analyses (Supplementary Table 7); these estimates provided a basis for computing the attributable fraction (Supplementary Tables 1, 2). We considered PCV efficacy against vaccine-serotype invasive pneumococcal disease for the primary analysis (left). A secondary analysis (Supplementary Table 8) used PCV efficacy against culture-confirmed pneumococcal vaccine-serotype acute otitis media. For rotavirus (right), we stratified estimates of human monovalent rotavirus vaccine (Rotarix) efficacy against rotavirus gastroenteritis in children aged 0–23 months in middle-income countries and low-income countries to account for the differential efficacy in these settings, and obtained a pooled estimate of the attributable fraction weighted by the number of children residing in middle-income countries and low-income countries (Methods). VE, vaccine effectiveness. Points and lines indicate median estimates and 95% confidence intervals, respectively. Quantiles are obtained through 2,000 independent draws from the distribution of estimates.
Fig. 3
Fig. 3. Estimated incidence across countries of ARI and diarrheal illnesses per 100 children.
a, b, We estimate country-specific incidence of ARI and antibiotic-treated ARI in children aged 24–59 months (a) and diarrhoea and antibiotic-treated diarrhoea in children aged 0–23 months (b). Points and lines indicate median estimates for an individual country together with accompanying 95% confidence intervals. Estimates are obtained from analyses of Demographic Health Surveys and Multiple Indicator Cluster Surveys, comprising 944,173 children across 77 countries, as well as extrapolations based on 405 health, nutrition and population indicators for all LMICs. Points plotted in white are extrapolated from estimates based on household survey data (see Methods). Estimates for individual countries are provided in Supplementary Tables 11–13. Quantiles are obtained through 5,000 independent draws from the distribution of estimates.
Fig. 4
Fig. 4. Total vaccine-preventable antibiotic consumption and incidence per 100 children.
a, b, We estimated the incidence and total number of antibiotic-treated ARI and diarrhoea episodes attributable to PCV10/13-serotype pneumococci in children aged 24–59 months (a) and rotavirus in children aged 0–23 months (b), respectively. Left, incidence in the absence of vaccination. Right, the corresponding total number of cases, the total number of cases under 2018 vaccine coverage levels and under universal vaccine coverage. Estimates were stratified by income status (low income; lower middle income; upper middle income). Points indicate median estimates, with superimposed lines indicating 95% confidence intervals; violin plots illustrate the distribution around estimated incidence and total cases. Numerical estimates are provided in Supplementary Tables 20–22, 24–26. Quantiles are obtained through 5,000 independent draws from the distribution of estimates.
Extended Data Fig. 1
Extended Data Fig. 1. Potential effect of pneumococcal serotype replacement.
a, We compare the maximum estimate of the replacement disease associated with increased carriage of nonvaccine-type (NVT) pneumococci to the prevented burden of disease associated with vaccine-type (VT) pneumococci based on the approach described in the Methods section ‘Potential reduction in PCV10/13 effects owing to serotype replacement’. We plot the ratio of replacement-attributable NVT disease as a function of the relative pathogenicity of NVT and VT pneumococci. As this ratio may differ according to disease end point, the measure presented in a can be interpreted as end point agnostic. Estimates from two previous studies, of acute otitis media (AOM) and invasive pneumococcal disease (IPD) provide a range of 0.218–0.387 for the relative pathogenicity of NVT compared with VT pneumococci in these conditions. We plot estimates based on serotype replacement observations from three carriage studies in LMICs with continuous, prospective surveillance in place before and after PCV10/13 implementation, , . b, We next illustrate the estimated ratio of replacement-attributable antibiotic-treated ARI to all-cause antibiotic-treated ARI among children aged 24–59 months, based on our estimates of the fraction of antibiotic-treated ARI attributable to VT pneumococci (Fig. 2). On the basis of the input values from the carriage and disease studies cited, –, , we infer that the maximum extent of antibiotic-treated ARI that replacement serotypes would account for would decrease to between 2.6% and 8.2% of the pre-vaccination incidence of all-cause antibiotic-treated ARI; this range is well below the estimated reduction associated with protection against VT pneumococci.
Extended Data Fig. 2
Extended Data Fig. 2. Bias that occurs when using the odds ratio to approximate the relative risk.
ad, We illustrate the degree of bias that occurs in attributable fraction estimates (indicated by the departure of the estimated proportion from the 1:1 diagonal) under differing parameterizations with respect to the true aetiological fraction and vaccine efficacy against the targeted infection. Values correspond to our meta-analytic estimates of PCV efficacy against vaccine-serotype invasive pneumococcal disease (a), PCV efficacy against vaccine-serotype acute otitis media (b), rotavirus vaccine efficacy against rotavirus gastroenteritis in middle-income countries (c) and rotavirus vaccine efficacy against rotavirus gastroenteritis in low-income countries (d). The range of 15–30% is highlighted in grey as plausible values for the proportion of disease attributable to vaccine-serotype pneumococci for children aged 24–59 months and rotavirus for children aged 0–23 months, based on previously published studies, . Values are plotted on a blue-to-red ramp corresponding to increases in symptom prevalence (ρ + ω); values of 0.01, 0.02, 0.03, 0.05 and 0.1 correspond to incidence rates of 52, 104, 156, 261 and 521 episodes per 100 children annually (roughly the range of our all-cause ARI and diarrhoea incidence rate estimates); under the assumption of a 3-day duration of symptoms, the same prevalence values correspond to incidence rates of 122 to 1,217 episodes per 100 children annually. These outcomes suggest negligible bias in aetiological fractions over the range of plausible values for our analysis.
Extended Data Fig. 3
Extended Data Fig. 3. Fitted association of improved water and sanitation access with diarrhoea risk.
ac, We illustrate model-estimated rates of the incidence (Inc.) per 100 children of diarrhoea under differing conditions of access to improved water and sanitation conditions among at ages 0–23 months. Estimates account for interactions of sanitation and water access with GDP per capita. Shaded regions indicate 95% confidence intervals around estimates. True intercepts are dependent on the distribution of other individual and setting-level risk factors; plotted estimates do not account for the joint distribution of other risk factors with respect to the access of children to water and sanitation at the country level and GDP per capita. Sanitation conditions include improved (a) and unimproved sanitation (b) or open defaecation (c) in combination with or without improved water access. Model parameter estimates are presented in full in Supplementary Table 30. Estimates are obtained from analyses of DHS and MICS surveys comprising 377,665 children across 77 countries. Quantiles are obtained through 5,000 independent draws from the distribution of estimates.
Extended Data Fig. 4
Extended Data Fig. 4. Fitted association of GDP per capita with antibiotic treatment of ARI, by region.
a, b, We illustrate model-estimated probabilities of antibiotic treatment for cases of ARI among children aged 24–59 months in rural (a) and urban (b) settings associated with region and GDP per capita. Estimates for central and eastern Europe are omitted from plots as wide uncertainty intervals would obscure the illustration of associations in other settings. Shaded regions indicate 95% confidence intervals around the estimates. True intercepts are dependent on the distribution of other individual and setting-level risk factors; plotted estimates do not account for the joint distribution of other risk factors with respect to region and GDP per capita. Model parameters are included in Supplementary Table 31; estimates are nearly identical for children aged 24–59 months and 0–59 months (Supplementary Table 32). Estimates are obtained from analyses of DHS and MICS surveys comprising 566,508 children across 77 countries. Quantiles are obtained through 5,000 independent draws from the distribution of estimates.
Extended Data Fig. 5
Extended Data Fig. 5. Fitted association of GDP per capita with antibiotic treatment of diarrhoea, by region.
a, b, We illustrate model-estimated probabilities of antibiotic treatment for cases of diarrhoea among children aged 0–23 months in rural (a) and urban (b) settings associated with region and GDP per capita. Estimates for central and eastern Europe are omitted from plots as wide uncertainty intervals would obscure the illustration of associations in other settings. Shaded regions indicate 95% confidence intervals around estimates. True intercepts are dependent on the distribution of other individual and setting-level risk factors; plotted estimates do not account for the joint distribution of other risk factors with respect to region and GDP per capita. Model parameter estimates are provided in Supplementary Table 33. Estimates are obtained from analyses of DHS and MICS surveys comprising 377,665 children across 77 countries. Quantiles are obtained through 5,000 independent draws from the distribution of estimates.
Extended Data Fig. 6
Extended Data Fig. 6. Out-of-sample performance of the extrapolated incidence estimation.
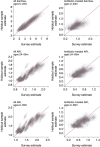
We illustrate the extrapolated estimates of ARI and diarrhoea incidence and antibiotic-treated ARI and antibiotic-treated diarrhoea incidence against model-based estimates within the 10% holdout samples reserved to assess out-of-sample performance of predictive modelling. Red lines indicate expectations under the scenario of one-to-one correspondence between true and predicted out-of-sample values.

References

    1. Klugman KP, Black S. Impact of existing vaccines in reducing antibiotic resistance: primary and secondary effects. Proc. Natl Acad. Sci. USA. 2018;115:12896–12901. - PMC - PubMed
    1. Lipsitch M, Siber GR. How can vaccines contribute to solving the antimicrobial resistance problem? mBio. 2016;7:e00428–16. - PMC - PubMed
    1. Atkins KE, Flasche S. Vaccination to reduce antimicrobial resistance. Lancet Glob. Health. 2018;6:e252. - PubMed
    1. Bloom DE, Black S, Salisbury D, Rappuoli R. Antimicrobial resistance and the role of vaccines. Proc. Natl Acad. Sci. USA. 2018;115:12868–12871. - PMC - PubMed
    1. Buckley BS, et al. Impact of vaccination on antibiotic usage: a systematic review and meta-analysis. Clin. Microbiol. Infect. 2019;25:1213–1225. - PubMed

Publication types

MeSH terms