

Estimating and projecting air passenger traffic during the COVID-19 coronavirus outbreak and its socio-economic impact
- PMID: 32377034
- PMCID: PMC7200368
- DOI: 10.1016/j.ssci.2020.104791
Estimating and projecting air passenger traffic during the COVID-19 coronavirus outbreak and its socio-economic impact
Abstract
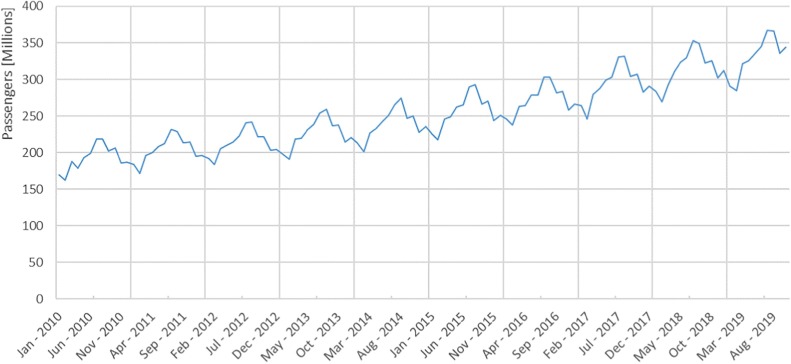
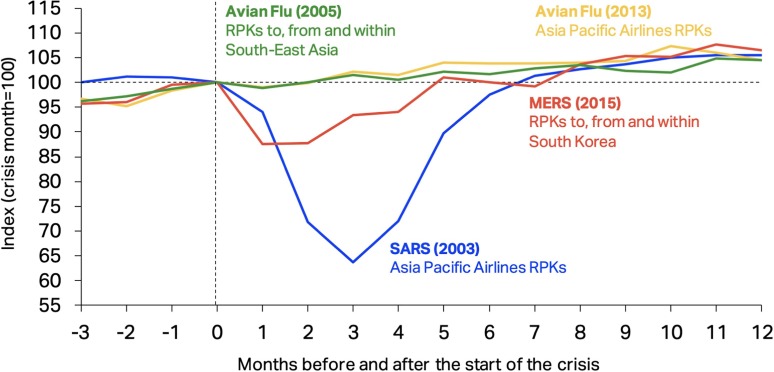
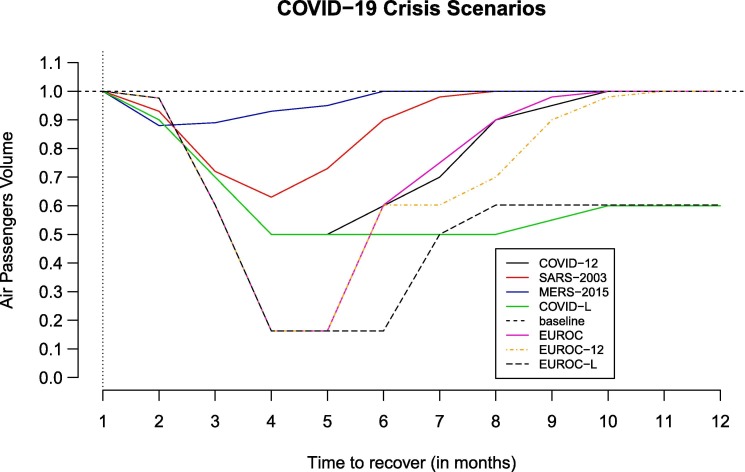
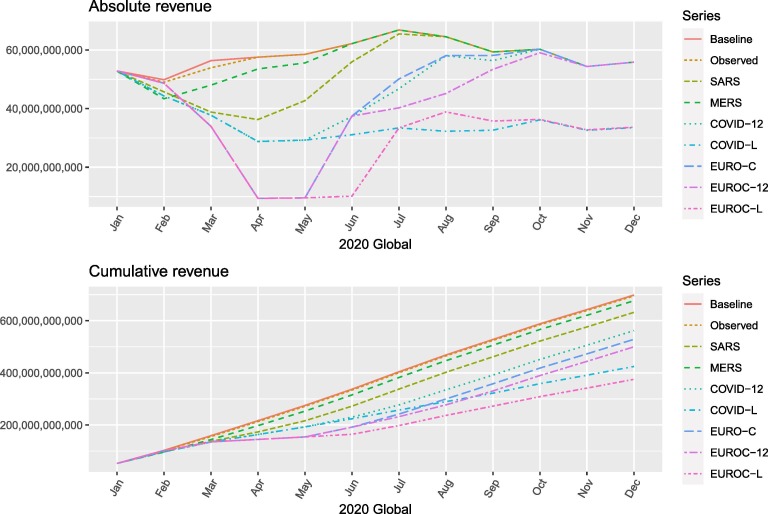
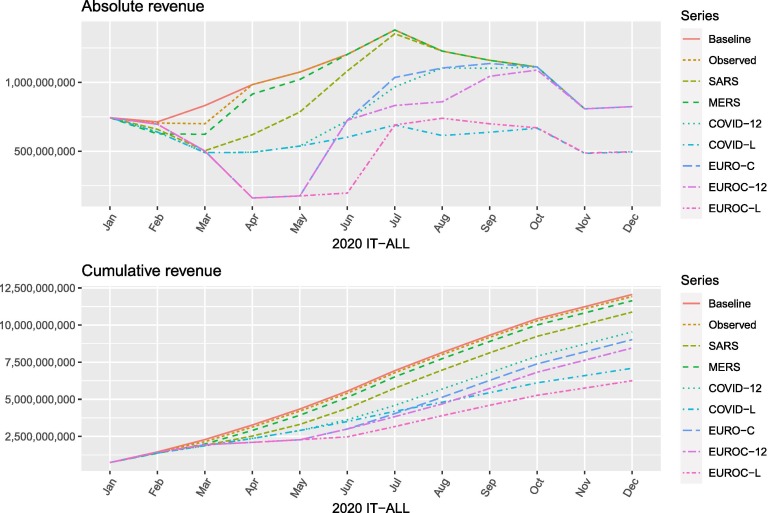
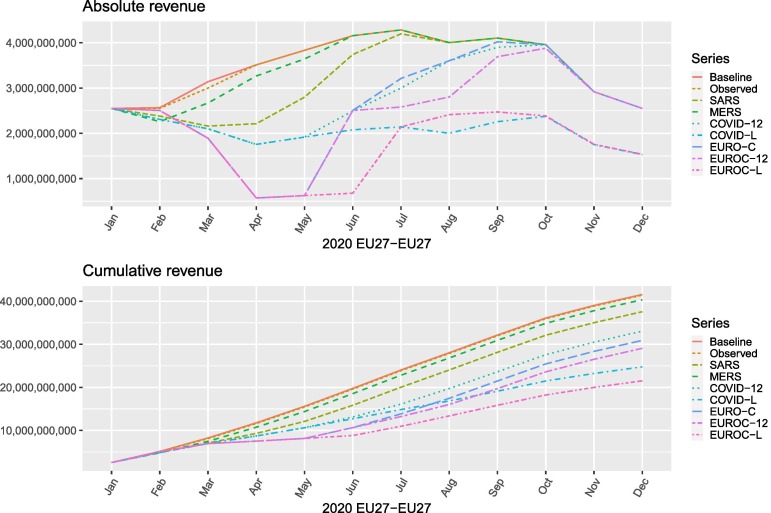
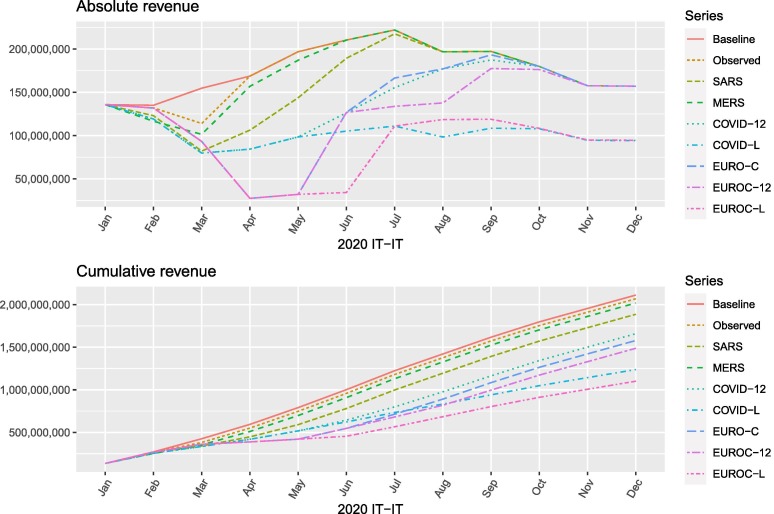
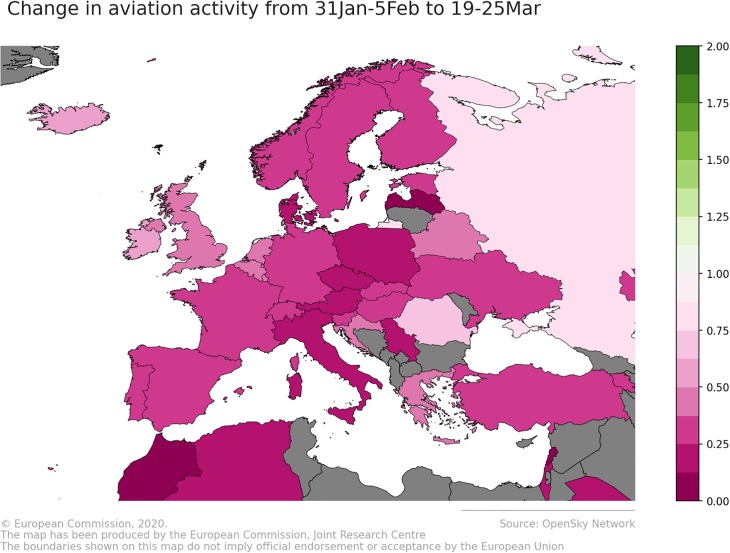
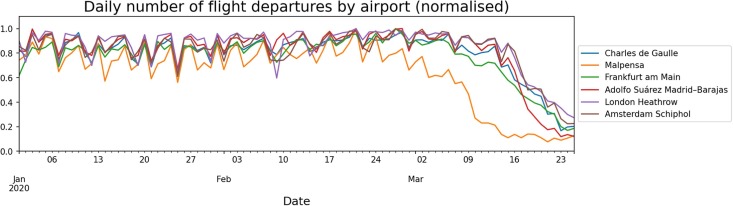
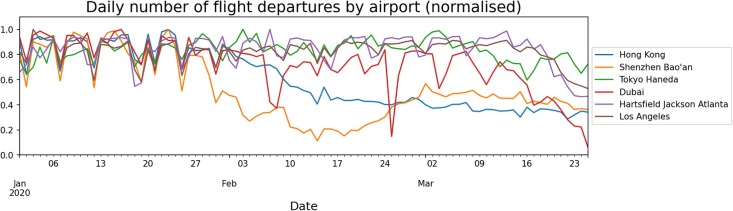
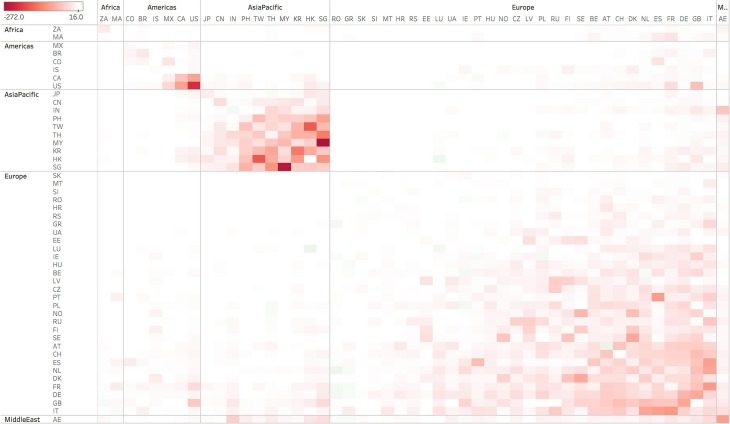
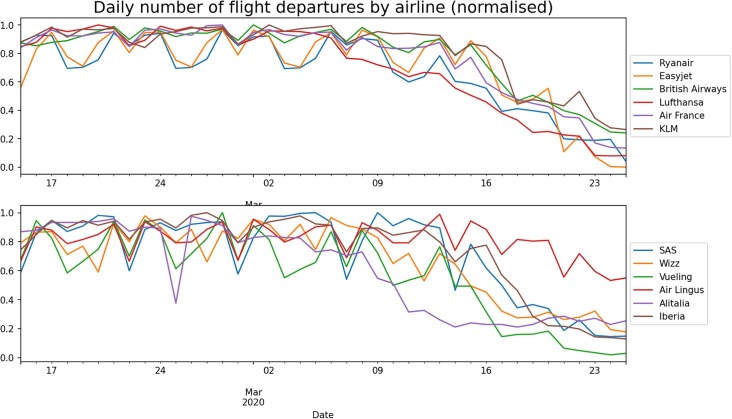
Due to the coronavirus global crisis, most countries have put in place restrictive measures in order to confine the pandemia and contain the number of casualties. Among the restrictive measures, air traffic suspension is certainly quite effective in reducing the mobility on the global scale in the short term but it also has high socio-economic impact on the long and short term. The main focus of this study is to collect and prepare data on air passengers traffic worldwide with the scope of analyze the impact of travel ban on the aviation sector. Based on historical data from January 2010 till October 2019, a forecasting model is implemented in order to set a reference baseline. Making use of airplane movements extracted from online flight tracking platforms and on-line booking systems, this study presents also a first assessment of recent changes in flight activity around the world as a result of the COVID-19 pandemic. To study the effects of air travel ban on aviation and in turn its socio-economic, several scenarios are constructed based on past pandemic crisis and the observed flight volumes. It turns out that, according to these hypothetical scenarios, in the first Quarter of 2020 the impact of aviation losses could have negatively reduced World GDP by 0.02% to 0.12% according to the observed data and, in the worst case scenarios, at the end of 2020 the loss could be as high as 1.41-1.67% and job losses may reach the value of 25-30 millions. Focusing on EU27, the GDP loss may amount to 1.66-1.98% by the end of 2020 and the number of job losses from 4.2 to 5 millions in the worst case scenarios. Some countries will be more affected than others in the short run and most European airlines companies will suffer from the travel ban. We hope that these preliminary results may be of help for informed policy making design of exit strategies from this global crisis.
Keywords: Air passengers data; COVID-19; Coronavirus; Human mobility; Scenario analysis.
© 2020 The Authors.
Figures
References
-
- ATAG, 2018. Aviation benefits beyond borders. https://aviationbenefits.org/media/166711/abbb18_full-report_web.pdf.
-
- Eurocontrol, 2018. Covid-19: latest air traffic situation. https://www.eurocontrol.int/Economics/DailyTrafficVariation-States.html.
-
- Gabrielli L., Deutschmann E., Natale F., Recchi E., Vespe M. Dissecting global air traffic data to discern different types and trends of transnational human mobility. EPJ Data Sci. 2019;8(1):1–24.
-
- Iacus, S.M., Natale, F., Vespe, M., 2020. Flight restrictions from china during the covid-2019 coronavirus outbreak. Technical report, arXiv:2003.03686.
-
- Iacus S.M., Yoshida N. Springer; New York: 2018. Simulation and inference for stochastic processes with YUIMA: a comprehensive R framework for SDEs and other stochastic processes.
LinkOut - more resources
Full Text Sources
Miscellaneous