. 2020 Apr;54(2):98-104.
doi: 10.1007/s13139-020-00636-9. Epub 2020 Apr 15.

Sleep and Neuroimaging

Affiliations

Sleep and Neuroimaging

Kyoungjune Pak et al. Nucl Med Mol Imaging. 2020 Apr.

Erratum in

  • Correction to: Sleep and Neuroimaging.
    Pak K, Kim J, Kim K, Kim SJ, Kim IJ. Pak K, et al. Nucl Med Mol Imaging. 2023 Oct;57(5):256. doi: 10.1007/s13139-023-00807-4. Epub 2023 May 4. Nucl Med Mol Imaging. 2023. PMID: 37720885 Free PMC article.

Abstract

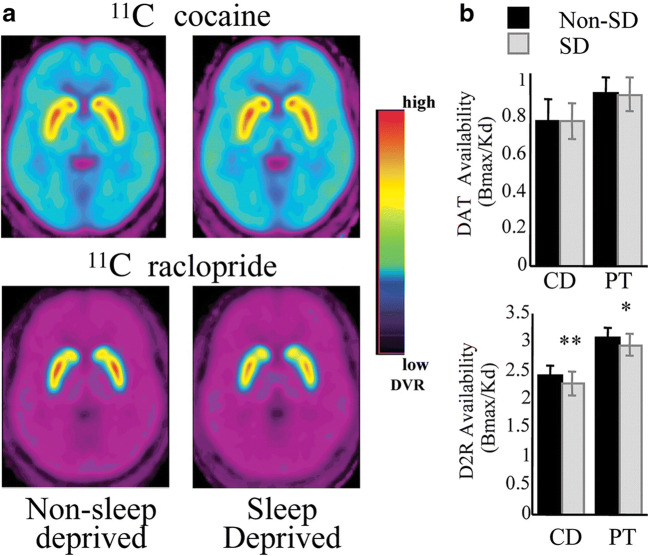
We spend about one-third of our lives either sleeping or attempting to sleep. Therefore, the socioeconomic implications of sleep disorders may be higher than expected. However, the fundamental mechanisms and functions of sleep are not yet fully understood. Neuroimaging has been utilized to reveal the connectivity between sleep and the brain, which is associated with the physiology of sleep. Positron emission tomography (PET) and single-photon emission computed tomography (SPECT) imaging studies have become increasingly common in sleep research. Recently, significant progress has been made in understanding the physiology of sleep through neuroimaging and the use of various radiopharmaceuticals, as the sleep-wake cycle is regulated by multiple neurotransmitters, including dopamine, adenosine, glutamate, and others. In addition, the characteristics of rapid eye and non-rapid eye movement sleep have been investigated by measuring cerebral glucose metabolism. The physiology of sleep has been investigated using PET to study glymphatic function as a means to clear the amyloid burden. However, the basic mechanisms and functions of sleep are not yet fully understood. Further studies are needed to investigate the effects and consequences of chronic sleep deprivation, and the relevance of sleep to other diseases.

Keywords: Brain; Positron emission tomography; Single-photon emission computed tomography; Sleep.


Conflict of interest statement

Conflict of InterestKyoungjune Pak, Jiyoung Kim, Keunyoung Kim, Seong Jang Kim, and In Joo Kom declare that they have no conflict of interest. This research was supported by Basic Science Research Program through the National Research Foundation of Korea (2017R1D1A1B03029352, 2017R1D1A1B03033235).

Figures

Fig. 1
Fig. 1
PET scans at the mid-ventricular level show an overall decrease in the metabolic rate during NREM sleep (a) and right basal ganglia elevation in REM sleep (b) compared with wakefulness (c). Scale bar is in metabolic rate in micromoles glucose/100 g/min. Reprinted from Regional cerebral glucose metabolic rate in human sleep assessed by positron emission tomography, Life Sci. 1989;45(15):1349–56. Buchsbaum et al., with permission from Elsevier
Fig. 2
Fig. 2
Effects of one-night sleep deprivation (SD) on Aβ. a Voxel-wise paired t test between rested-wakefulness (RW) and SD conditions highlighting the hippocampus and other subcortical structures (PFWE < 0.05, cluster-size corrected). b Subject-level changes in florbetaben (FBB) standardized uptake value ratio (SUVr) (in the red cluster identified in a) from RW to SD. There was no significant effect of gender or gender × sleep interaction (p > 0.15). c Association between changes in mood from RW to SD and changes in the FBB SUVr for the cluster identified in a. Mood change was quantified using the principal component of the changes in self-reported measures from RW to SD, which accounted for 35.5% of the variance. Self-reported measures of alert, friendly, happy, social, and energetic significantly decreased, and measures of tiredness and difficulty staying awake significantly increased from RW to SD (p < 0.001, two-tailed). d Average FBB SUVr in the a priori hippocampus region of interest across all subjects. Error bars show the standard deviation. Reprinted from β-amyloid accumulation in the human brain after one night of sleep deprivation, Proc Natl Acad Sci USA. 2018;115(17):4483–4488. Shokri-Kojori et al., with permission from PNAS
Fig. 3
Fig. 3
a Averaged brain images of the distribution volume ratio for 11C-cocaine and 11C-raclopride at the level of the striatum for non-SD and SD conditions. b Bmax/Kd in the caudate (CD) and putamen (PT) for 11C-cocaine (measure of DAT availability) and for 11C-raclopride (measure of D2 receptor availability) for non-SD and SD. Values represent mean ± standard deviation. Comparisons correspond to paired t tests: *p < 0.05; **p < 0.01. Reprinted from sleep deprivation decreases binding of [11C]raclopride to dopamine D2/D3 receptors in the human brain, J Neurosci. 2008;28(34):8454–61. Volkow et al., with permission from J Neurosci
Fig. 4
Fig. 4
Average images of the sleep deprivation group (n = 12) after spatial normalization. a Magnetic resonance imaging. b Parametric image of binding potential (BP2) before sleep deprivation. c Image after sleep deprivation. Reprinted from Sleep deprivation increases A1 adenosine receptor binding in the human brain: A positron emission tomography study, J Neurosci. 2007;27(9):2410–5. Elmenhorst et al., with permission from J Neurosci
Fig. 5
Fig. 5
Axial, sagittal, and coronal views of 11C-ABP688 binding in a representative individual. a Magnetic resonance image template for anatomical reference. b Color-coded normalized volumes of the distribution (Vnorm) of 11C-ABP688 after 9 h of wakefulness (sleep control condition). c Color-coded Vnorm of 11C-ABP688 after 33 h of wakefulness (sleep deprivation condition). The crosshair was placed in the right caudate nucleus. Reprinted from increased metabotropic glutamate receptor subtype 5 availability in human brain after one night without sleep, Biol Psychiatry. 2013;73(2):161–8. Hefti et al., with permission from Elsevier

References

    1. Aminoff MJ, Boller F, Swaab DF. We spend about one-third of our life either sleeping or attempting to do so. Handb Clin Neurol. 2011;98:vii. doi: 10.1016/B978-0-444-52006-7.00047-2. - DOI - PubMed
    1. Feng X, Liu Q, Li Y, Zhao F, Chang H, Lyu J. Longitudinal study of the relationship between sleep duration and hypertension in Chinese adult residents (CHNS 2004-2011) Sleep Med. 2019;58:88–92. doi: 10.1016/j.sleep.2019.01.006. - DOI - PubMed
    1. Sluggett L, Wagner SL, Harris RL. Sleep duration and obesity in children and adolescents. Can J Diabetes. 2019;43:146–152. doi: 10.1016/j.jcjd.2018.06.006. - DOI - PubMed
    1. Cordone S, Annarumma L, Rossini PM, De Gennaro L. Sleep and beta-amyloid deposition in Alzheimer disease: insights on mechanisms and possible innovative treatments. Front Pharmacol. 2019;10:695. doi: 10.3389/fphar.2019.00695. - DOI - PMC - PubMed
    1. Baumann CR. Sleep-wake and circadian disturbances in Parkinson disease: a short clinical guide. J Neural Transm (Vienna). 2019. - PubMed

LinkOut - more resources