. 2020 May 4:6:31.
doi: 10.1038/s41421-020-0168-9. eCollection 2020.

Immune cell profiling of COVID-19 patients in the recovery stage by single-cell sequencing

Affiliations

Immune cell profiling of COVID-19 patients in the recovery stage by single-cell sequencing

Wen Wen et al. Cell Discov. .

Erratum in

Abstract

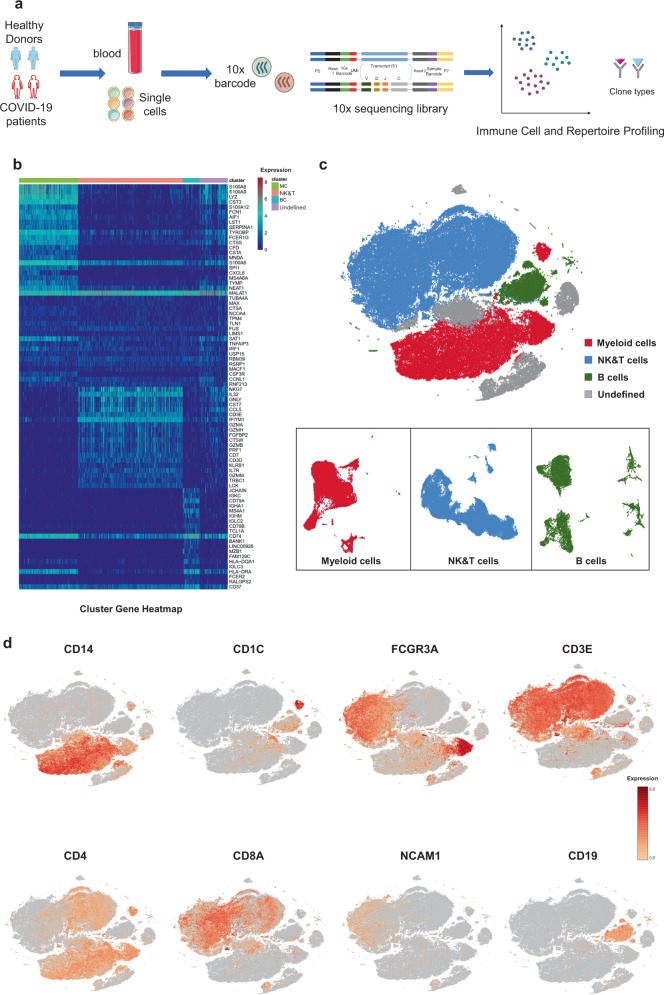
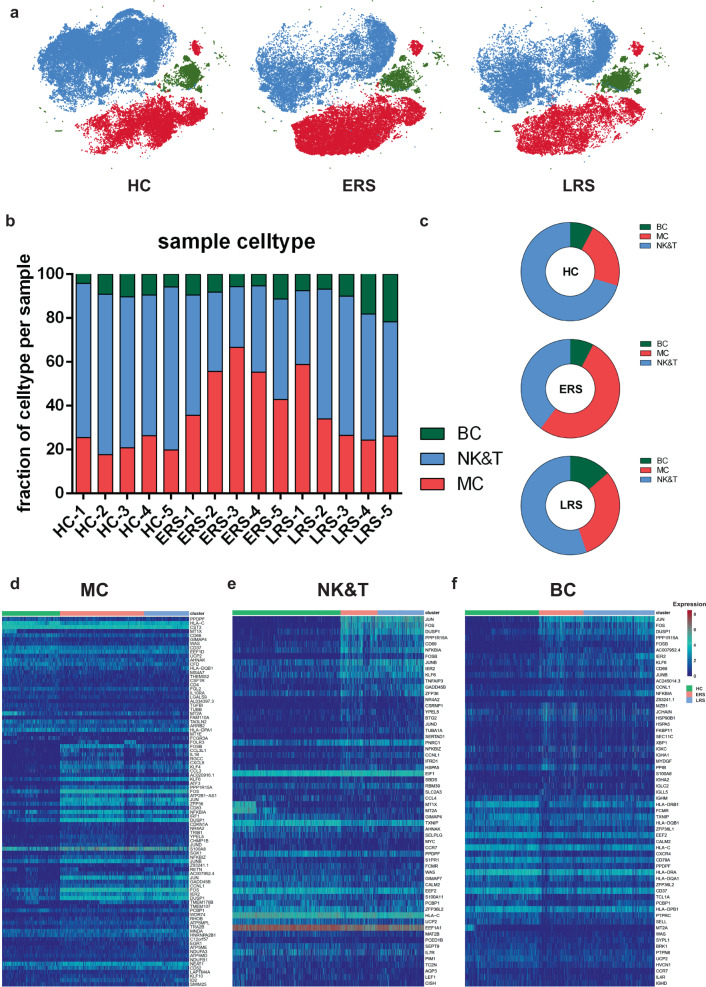
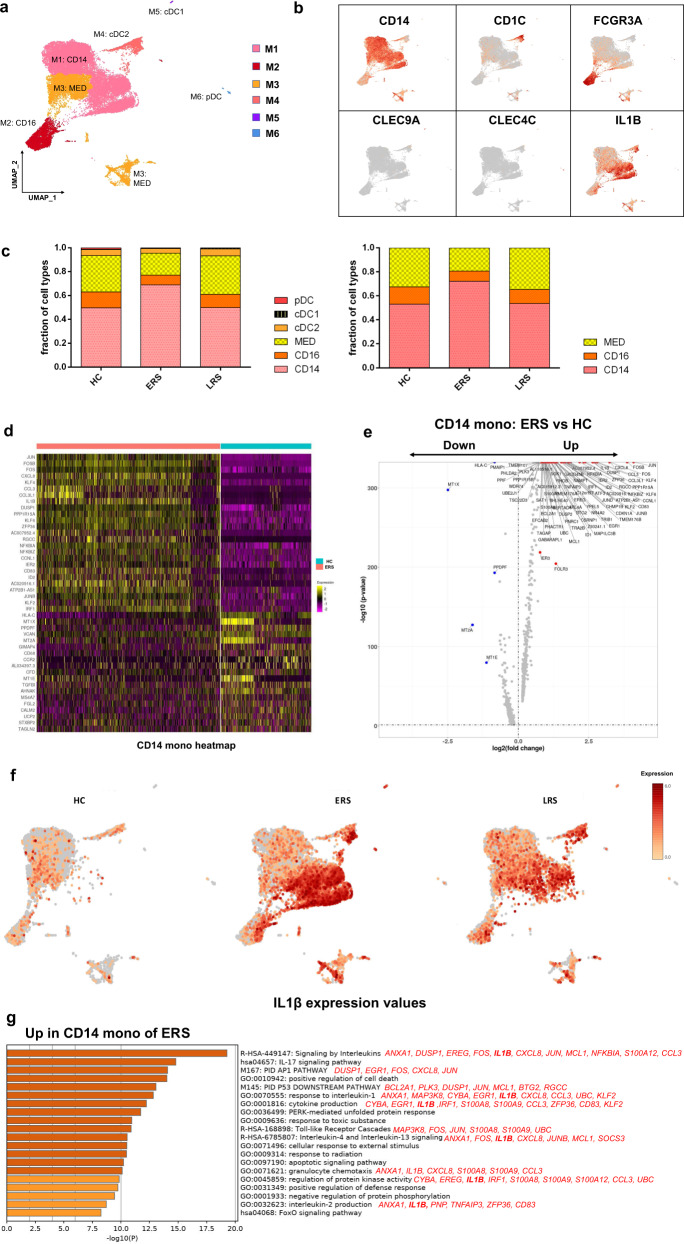
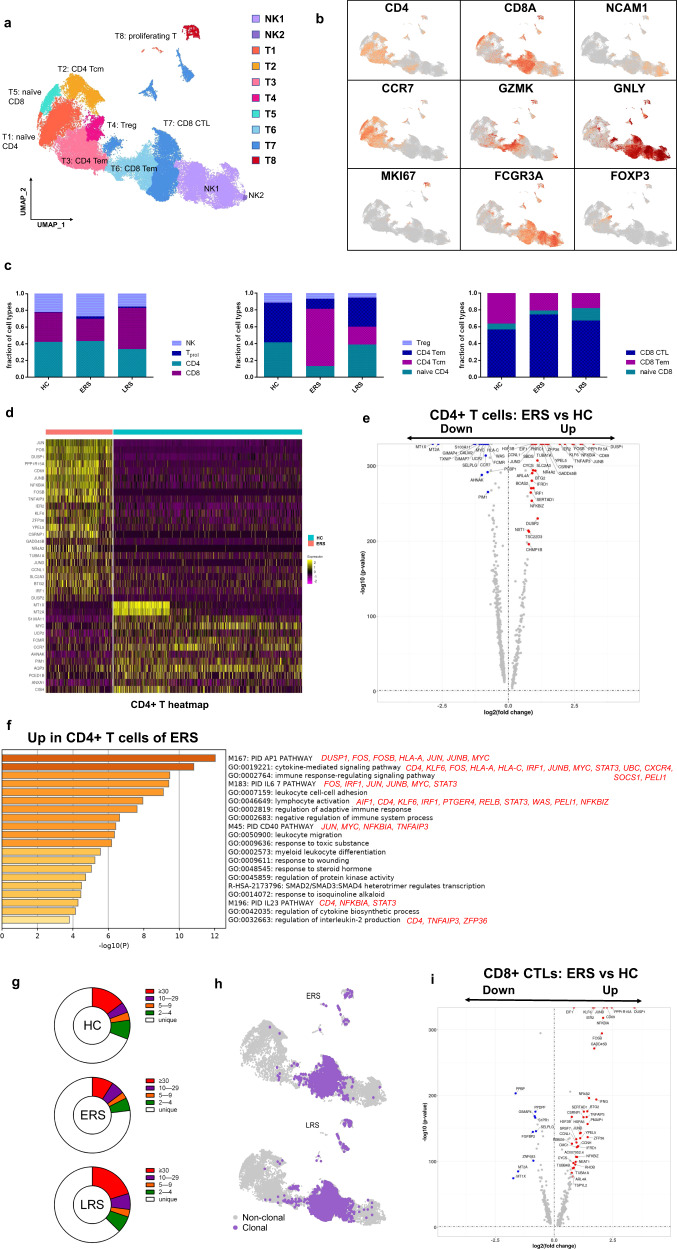
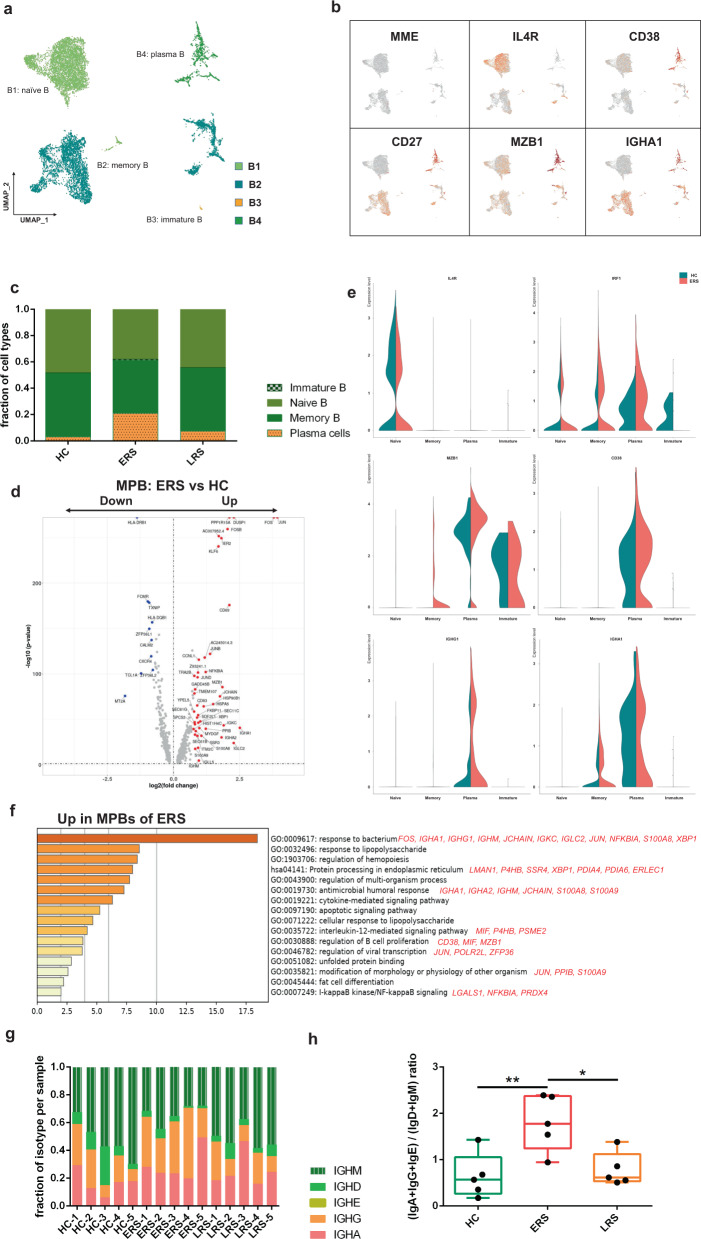
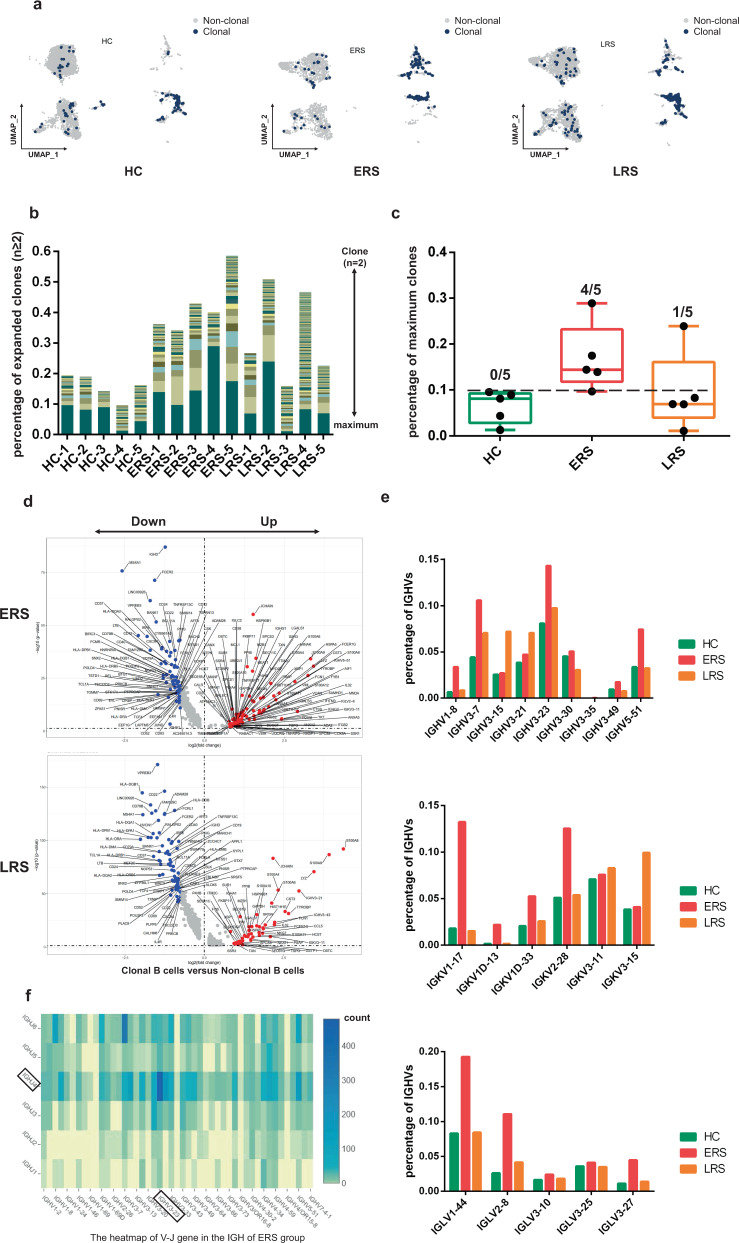
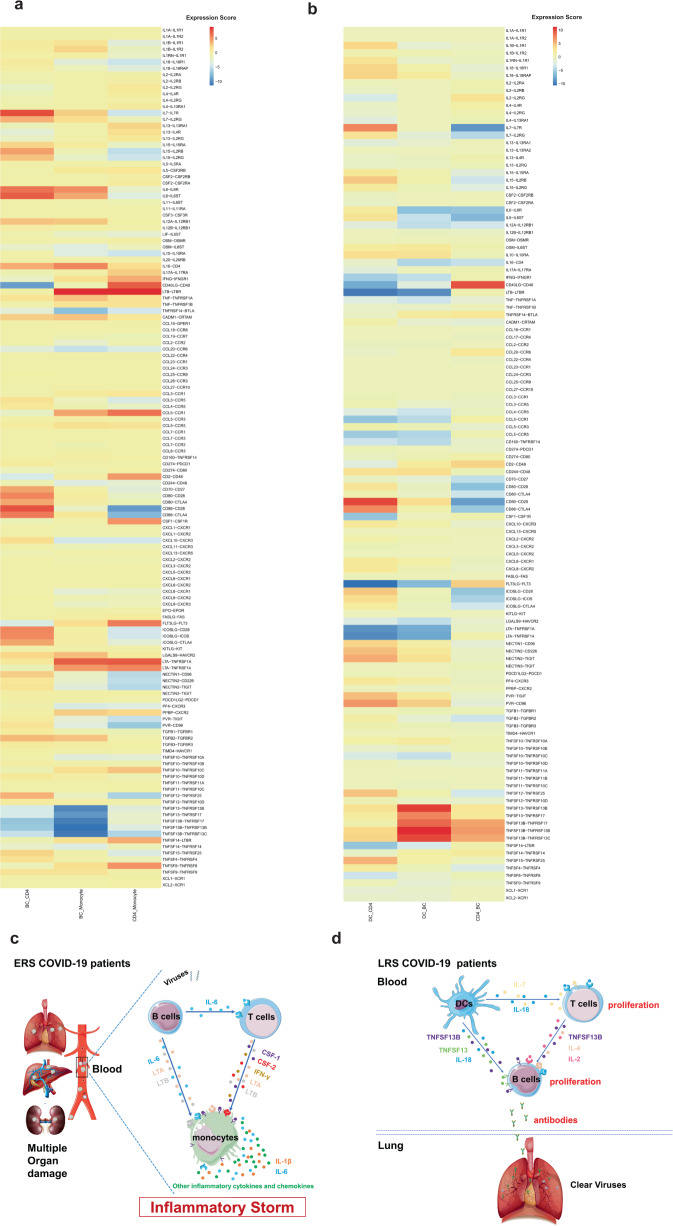
COVID-19, caused by SARS-CoV-2, has recently affected over 1,200,000 people and killed more than 60,000. The key immune cell subsets change and their states during the course of COVID-19 remain unclear. We sought to comprehensively characterize the transcriptional changes in peripheral blood mononuclear cells during the recovery stage of COVID-19 by single-cell RNA sequencing technique. It was found that T cells decreased remarkably, whereas monocytes increased in patients in the early recovery stage (ERS) of COVID-19. There was an increased ratio of classical CD14++ monocytes with high inflammatory gene expression as well as a greater abundance of CD14++IL1β+ monocytes in the ERS. CD4+ T cells and CD8+ T cells decreased significantly and expressed high levels of inflammatory genes in the ERS. Among the B cells, the plasma cells increased remarkably, whereas the naïve B cells decreased. Several novel B cell-receptor (BCR) changes were identified, such as IGHV3-23 and IGHV3-7, and isotypes (IGHV3-15, IGHV3-30, and IGKV3-11) previously used for virus vaccine development were confirmed. The strongest pairing frequencies, IGHV3-23-IGHJ4, indicated a monoclonal state associated with SARS-CoV-2 specificity, which had not been reported yet. Furthermore, integrated analysis predicted that IL-1β and M-CSF may be novel candidate target genes for inflammatory storm and that TNFSF13, IL-18, IL-2, and IL-4 may be beneficial for the recovery of COVID-19 patients. Our study provides the first evidence of an inflammatory immune signature in the ERS, suggesting COVID-19 patients are still vulnerable after hospital discharge. Identification of novel BCR signaling may lead to the development of vaccines and antibodies for the treatment of COVID-19.

Keywords: Immunology; Mechanisms of disease.


Conflict of interest statement

Conflict of interestThe authors declare that they have no conflict of interest.

Figures

Fig. 1
Fig. 1. Study design and analysis of single immune cell profiling in COVID-19 patients.
a Schematics of the experimental design for single-cell RNA (sc-RNA) sequencing. Peripheral blood mononuclear cells (PBMCs) were collected from COVID-19 patients and healthy controls (HCs) and then processed via sc-RNA, sc-BCR, and sc-TCR sequencing using the 10x-Based Genomics platform. b The heatmaps show differentially expressed genes (DEGs) upregulated in myeloid cells, NK and T cells, B cells, and other clusters of PBMCs. c t-distributed stochastic neighbor embedding (t-SNE) plot showing myeloid cells (red), NK and T cells (blue), B cells (green), and other clusters (gray) of PBMCs identified using integrated and classification analysis. d t-SNE projection of canonical markers, including CD14, CD1C, and FCGR3A for myeloid cells; CD3E, CD4, CD8A, and NCAM1 for NK and T cells; andCD19 for B cells as indicated in the legend.
Fig. 2
Fig. 2. An overview of NK and T, B, and myeloid cells in the blood of convalescent patients with COVID-19.
a The t-SNE plot shows a comparison of the clustering distribution across HCs as well as early recovery stage (ERS) and late recovery stage (LRS) patients with COVID-19. b The bar plot shows the relative contributions of myeloid, NK and T, and B cells by individual samples, including five HCs, five ERS patients, and five LRS patients. c The pie chart shows the percentages of myeloid, NK and T, and B cells across HCs as well as ERS and LRS patients with COVID-19. d The heatmap shows the DEGs of myeloid cells among the HCs and the ERS and LRS COVID-19 patients. e The heatmap shows the DEGs of NK and T cells among the HCs and the ERS and LRS COVID-19 patients. f The heatmap shows the DEGs of B cells among the HCs and the ERS and LRS COVID-19 patients.
Fig. 3
Fig. 3. Myeloid cell subsets and their states in the blood of convalescent patients with COVID-19.
a Six clusters of myeloid cells were displayed according to marker gene expression levels. Uniform manifold approximation and projection (UMAP) presentation of the heterogeneous clusters of peripheral myeloid cells. Classical CD14++ monocytes (M1), non-classical CD16++ (FCGR3A) CD14−/+ monocytes (M2), intermediate CD14++ CD16+ monocytes (M3), CD1C+ cDC2 (M4), CLEC9A+ cDC1 (M5), and pDC (CLEC4C+CD123+) (M6). b The UAMP plot shows subtype-specific marker genes of myeloid cells, includingCD14, FCGR3A, CD1C, CLEC9A, CLEC4C, and IL-1β. c Bar chart of the relative frequencies of the six sub-clusters of myeloid cells and three sub-clusters of monocytes across the HCs and the ERS and LRS patients. d The heatmap shows the top DEGs between COVID-19 patients and HCs in CD14++ monocytes. e Volcano plot of fold change between COVID-19 patients and HCs in CD14++ monocytes. P values were calculated using a paired, two-sided Wilcoxon test and FDR corrected using the Benjamini–Hochberg procedure. f The UAMP plot shows that IL-1β was highly expressed in the ERS patients vs. the LRS patients and HCs in myeloid cells. g GO BP enrichment analysis of the DEGs of CD14++ monocytes upregulated in COVID-19 patients. P value was derived by a hypergeometric test.
Fig. 4
Fig. 4. Characterization of T and NK cell responses in the blood of recovered COVID-19 patients.
a Ten sub-clusters of NK and T lymphocytes were identified. The UMAP plot shows the clustering of T and NK cells. CD56+CD16-NK cells (NK1), C56-CD16+ NK cells (NK2), naïve CD4+ T cells (T1), central memory CD4+ T cells (T2), effector memory CD4+ T cells (T3), regulatory T cells (T4), naïve CD8+ T cells (T5), effector memory CD8+ T cells (T6), cytotoxic CD8+ T cells (T7), and proliferating T cells (T8). b UAMP plot showing subtype-specific marker genes of NK and T cells including CD4, CD8A, NCAM1, CCR7, GZMK, GNLY, MKI67, FCGR3A, and IL-1β. c The bar plot shows the percentages of four sub-clusters of NK and T cells, four sub-clusters of CD4+ T cells, and three sub-clusters of CD4+ T cells among the HCs and the ERS and LRS patients. d Heatmap of CD4+ T cells showing the DEGs between the COVID-19 patients and HCs.e The volcano plot shows the DEGs of CD4+ T cells between the COVID-19 patients and HCs. P values were calculated using a paired, two-sided Wilcoxon test and FDR corrected using the Benjamini–Hochberg procedure. f GO BP enrichment analysis of the DEGs of CD4+ T cells upregulated in the COVID-19 patients. P value was derived by a hypergeometric test. g The pie plot shows the TCR clone differences across the HCs and the ERS and LRS patients. h UAMP shows expanded TCR clones (n ≥ 2) in the ERS and LRS patients. i The volcano plot shows the DEGs of CD8+ CTLs between the COVID-19 ERS group and HCs. P values were calculated using a paired, two-sided Wilcoxon test and FDR corrected using the Benjamini–Hochberg procedure.
Fig. 5
Fig. 5. Characterization of single-cell B cells in COVID-19 patients.
a Four clusters of B cells were identified. The UMAP plot shows the clustering of B cells. Naïve B cells (B1), memory B cells (B2), immature B cells (B3), and plasma cells (B4). b UAMP plot showing subtype-specific marker genes of B cells, including MME, IL4R, CD38, CD27, MZB1, and IGHA1. c The bar plot shows the percentages of B clusters across the HCs and the ERS and LRS patients. d The volcano plot shows the DEGs of MPB cells between the COVID-19 patients and HCs. P values were calculated using a paired, two-sided Wilcoxon test and FDR corrected using the Benjamini–Hochberg procedure. e The violin plot shows thatMZB1, IGHG1, andIGHA1 were highly expressed in COVID-19 patients vs. the HCs in the B cell sub-clusters. f GO BP enrichment analysis of the DEGs of MPB cells between the COVID-19 patients vs. the HCs. P value was derived by a hypergeometric test.g The bar plot shows the relative percentage of each isotype by individual sample.h The bar plot shows the ratio of (IgA+IgG+IgE) to (IgD+IgM) among the HCs and the ERS and LRS patients. Statistical analysis used One-Way ANOVA test. Values are mean ± SD. *P < 0.05, **P < 0.01.
Fig. 6
Fig. 6. Expanded BCR clones and biased usage of VDJ genes observed in the COVID-19 patients.
a The UMAP plot shows the B cell expansion status in the HCs and the ERS and LRS COVID-19 patients. b The bar plots show the clonal expansion status of B cells in peripheral blood from each individual sample. The number of color blocks represents the complexity of the clonal states. c Separate analysis of HC, ERS and LRS group by percentages of maximum clones revealed an enrichment of highly expanded clones (defined as comprising 10% or more of all BCR sequences; indicated by dotted line) in each group. None of healthy subjects had a highly expanded clone, versus four out of five patients in ERS, one out of five patients in LRS. Values are mean ± SD. d The volcano plot shows the DEGs of expanded vs. non-expanded B cells in ERS and LRS patients. P values were calculated using a paired, two-sided Wilcoxon test and FDR corrected using the Benjamini–Hochberg procedure. e The bar plots show specific IGHV, IGKV, IGLV usage in the HCs and the ERS and LRS COVID-19 patients. f Heatmap showing IGH rearrangements in peripheral blood samples from ERS group.
Fig. 7
Fig. 7. Cell-to-cell communication among immune cells in the COVID-19 patients.
a T cell-monocyte interactions, B cell-monocyte interactions, B cell-T cell interactions, and monocyte-T cell interactions in the ERS COVID-19 patients. b DC-T cell interactions, DC-B cell interactions, and T cell-B cell interactions in the LRS COVID-19 patients. c, d Schematics illustrating the key innate and adaptive immune cell functional alterations and main differences in cell-cell communications in the ERS (c) and LRS (d) COVID-19 patients.

References

    1. Zhu N, et al. A novel coronavirus from patients with pneumonia in China, 2019. N. Engl. J. Med. 2020;382:727–733. doi: 10.1056/NEJMoa2001017. - DOI - PMC - PubMed
    1. Li, Q. et al. Early transmission dynamics in Wuhan, China, of novel coronavirus-infected pneumonia. N. Engl. J. Med.10.1056/NEJMoa2001316 (2020). - PMC - PubMed
    1. Livingston, E., Bucher, K. Coronavirus disease 2019 (COVID-19) in Italy. JAMA10.1001/jama.2020.4344 (2020). - PubMed
    1. World Health Organization. Statement on the second meeting of the International Health Regulations (2005) Emergency Committee regarding the outbreak of novel coronavirus (2019-nCoV). WHO. https://www.who.int/news-room/detail/30-01-2020-statement-on-the-second-... (2020).
    1. Huang C, et al. Clinical features of patients infected with 2019 novel coronavirus in Wuhan, China. Lancet. 2020;395:497–506. doi: 10.1016/S0140-6736(20)30183-5. - DOI - PMC - PubMed