In vivo imaging of CNS microglial activation/macrophage infiltration with combined [18F]DPA-714-PET and SPIO-MRI in a mouse model of relapsing remitting experimental autoimmune encephalomyelitis
- PMID: 32378022
- PMCID: PMC7835304
- DOI: 10.1007/s00259-020-04842-7
In vivo imaging of CNS microglial activation/macrophage infiltration with combined [18F]DPA-714-PET and SPIO-MRI in a mouse model of relapsing remitting experimental autoimmune encephalomyelitis
Abstract
Purpose: To evaluate the feasibility and sensitivity of multimodality PET/CT and MRI imaging for non-invasive characterization of brain microglial/macrophage activation occurring during the acute phase in a mouse model of relapsing remitting multiple sclerosis (RR-MS) using [18F]DPA-714, a selective radioligand for the 18-kDa translocator protein (TSPO), superparamagnetic iron oxide particles (SPIO), and ex vivo immunohistochemistry.
Methods: Experimental autoimmune encephalomyelitis (EAE) was induced in female SJL/J mice by immunization with PLP139-151. Seven symptomatic EAE mice and five controls underwent both PET/CT and MRI studies between 11 and 14 days post-immunization. SPIO was injected i.v. in the same animals immediately after [18F]DPA-714 and MRI acquisition was performed after 24 h. Regional brain volumes were defined according to a mouse brain atlas on co-registered PET and SPIO-MRI images. [18F]DPA-714 standardized uptake value (SUV) ratios (SUVR), with unaffected neocortex as reference, and SPIO fractional volumes (SPIO-Vol) were generated. Both SUVR and SPIO-Vol values were correlated with the clinical score (CS) and among them. Five EAE and four control mice underwent immunohistochemical analysis with the aim of identifying activated microglia/macrophage and TSPO expressions.
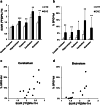
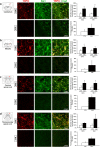
Results: SUVR and SPIO-Vol values were significantly increased in EAE compared with controls in the hippocampus (p < 0.01; p < 0.02, respectively), thalamus (p < 0.02; p < 0.05, respectively), and cerebellum and brainstem (p < 0.02), while only SPIO-Vol was significantly increased in the caudate/putamen (p < 0.05). Both SUVR and SPIO-Vol values were positively significantly correlated with CS and among them in the same regions. TSPO/Iba1 and F4/80/Prussian blue staining immunohistochemistry suggests that increased activated microglia/macrophages underlay TSPO expression and SPIO uptake in symptomatic EAE mice.
Conclusions: These preliminary results suggest that both activated microglia and infiltrated macrophages are present in vulnerable brain regions during the acute phase of PLP-EAE and contribute to disease severity. Both [18F]DPA-714-PET and SPIO-MRI appear suitable modalities for preclinical study of neuroinflammation in MS mice models.
Keywords: EAE; Mice; Multiple sclerosis; Neuroinflammation; SPIO-MRI; TSPO-PET.
Conflict of interest statement
The authors declare that they have no conflict of interest.
Figures


References
-
- Calabrese M, Magliozzi R, Ciccarelli O, Geurts JJ, Reynolds R, Martin R. Exploring the origins of grey matter damage in multiple sclerosis. Nat Rev Neurosci. 2015;16(3):147–158. - PubMed
-
- Hemmer B, Kerschensteiner M, Korn T. Role of the innate and adaptive immune responses in the course of multiple sclerosis. Lancet Neurol. 2015;14(4):406–419. - PubMed
-
- Chu F, Shi M, Zheng C, Shen D, Zhu J, Zheng X, et al. The roles of macrophages and microglia in multiple sclerosis and experimental autoimmune encephalomyelitis. J Neuroimmunol. 2018;318:1–7. - PubMed
-
- Ciccarelli O, Barkhof F, Bodini B, De Stefano N, Golay X, Nicolay K, et al. Pathogenesis of multiple sclerosis: insights from molecular and metabolic imaging. Lancet Neurol. 2014;13(8):807–822. - PubMed
Publication types
MeSH terms
Substances
Grants and funding
LinkOut - more resources
Full Text Sources
Research Materials

