. 2021 Apr;12(2):303-315.
doi: 10.1007/s12975-020-00819-8. Epub 2020 May 6.

Phosphodiesterase 10A Inhibition Leads to Brain Region-Specific Recovery Based on Stroke Type

Affiliations

Phosphodiesterase 10A Inhibition Leads to Brain Region-Specific Recovery Based on Stroke Type

Shirin Z Birjandi et al. Transl Stroke Res. 2021 Apr.

Erratum in

Abstract

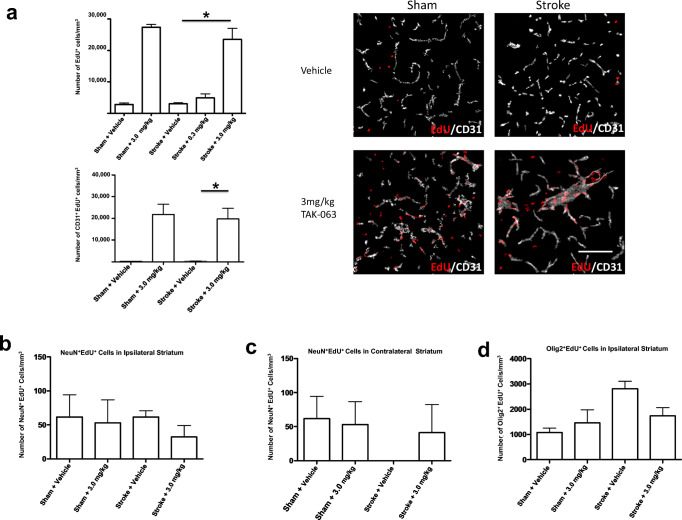
Stroke is the leading cause of adult disability. Recovery of function after stroke involves signaling events that are mediated by cAMP and cGMP pathways, such as axonal sprouting, neurogenesis, and synaptic plasticity. cAMP and cGMP are degraded by phosphodiesterases (PDEs), which are differentially expressed in brain regions. PDE10A is highly expressed in the basal ganglia/striatum. We tested a novel PDE10A inhibitor (TAK-063) for its effects on functional recovery. Stroke was produced in mice in the cortex or the striatum. Behavioral recovery was measured to 9 weeks. Tissue outcome measures included analysis of growth factor levels, angiogenesis, neurogenesis, gliogenesis, and inflammation. TAK-063 improved motor recovery after striatal stroke in a dose-related manner, but not in cortical stroke. Recovery of motor function correlated with increases in striatal brain-derived neurotrophic factor. TAK-063 treatment also increased motor system axonal connections. Stroke affects distinct brain regions, with each comprising different cellular and molecular elements. Inhibition of PDE10A improved recovery of function after striatal but not cortical stroke, consistent with its brain localization. This experiment is the first demonstration of brain region-specific enhanced functional recovery after stroke, and indicates that differential molecular signaling between brain regions can be exploited to improve recovery based on stroke subtype.

Keywords: Angiogenesis; Axonal sprouting; BDNF; Repair; Striatum.


Conflict of interest statement

S Thomas Carmichael has received a research grant from Takeda Pharmaceutical Company Limited. This funder had no role in data analysis or interpretation. Kazunori Suzuki and Haruhide Kimura are employed by Takeda Pharmaceutical Company Limited. As experts in TAK-063, these two authors had a role in experimental design but no role in data analysis or interpretation.

Figures

Fig. 1
Fig. 1
Functional effect of TAK-063 on forelimb use and gait post-striatal and cortical stroke. (a) In post-striatal stroke of the left hemisphere, the Grid-Walking task revealed differences in gait observed for stroke + vehicle versus stroke + 3.0 mg/kg at 6 weeks; *P = 0.04317 and at 9 weeks; *P = 0.03387 in post-striatal stroke. For overall differences between stroke + vehicle versus stroke +3.0 mg/kg, P = 0.0129. (b) In post-cortical stroke of the left hemisphere, the Grid-Walking task revealed no differences in stroke + vehicle versus treatment groups. Error bars represent mean ± SEM for n = 8–10 per group in striatal stroke model and n = 8–11 in cortical stroke model. Data are reported as difference from baseline. Data were analyzed by GLMs with Tukey’s HSD. In (a), z = 2.901 at 6 weeks, z = 2.984 at 9 weeks
Fig. 2
Fig. 2
TAK-063 treatment-mediated alterations in BDNF expression in striatal tissue. BDNF expression levels measured with tissue ELISA showed elevation at 3 weeks post-striatal stroke in striatal tissue, ipsilateral to the infarct. Treatment with TAK-063 resulted in a significant increase in BDNF levels in the stroke + 3.0 mg/kg versus stroke + vehicle group in ipsilateral striatum; P = 0.005, corrected for multiple comparisons (df = 18, t value = 5.982). Error bars represent mean ± SEM for n = 10 per group
Fig. 3
Fig. 3
Motor connections post-striatal stroke. a Image of BDA-labeled connections from the motor cortex of stroke + vehicle and B stroke + 3.0 mg/kg mice. Circles show area measured for axonal fibers in contralateral striatum. Data were normalized to integrated density of the BDA injection site for each treatment group. c Total BDA+ fibers were increased at 6 weeks post-striatal stroke in the contralateral cortical tissue in stroke + 3.0 mg/kg versus stroke + vehicle; *P = 0.0009, F(4, 17) = 10.69. d Ipsilateral striatum showed no differences between groups F(4, 17) = 10.69. Error bars represent mean ± SEM for n = 4–5 per group. Scale bar = 50 μm and applies to all photomicrographs
Fig. 4
Fig. 4
TAK-063 treatment does not alter mature astrocytes, microglia, or vessels in post-striatal stroke tissue. a Quantification of GFAP-positive astrocytes showed no differences between TAK-063 treatment groups in mice post-stroke (t value = 0.2513, df = 11). In each panel, a representative tissue stain is shown to the right. b Glut-1 staining in peri-infarct tissue for quantification of vascular endothelial cells post-striatal stroke revealed no differences between treatment groups (t value = 1.461, df = 11). c Quantification of IBA-1 immunoreactivity for microglia/macrophages showed no significant differences in microglia staining in peri-infarct striatal tissue (t value = 1.718, df = 11). Error bars represent mean ± SEM for n = 8–10 per group. Images are taken from a representative stroke + vehicle condition. Scale bar = 50 μm and applies to all photomicrographs. Inset in the top row is a schematic of coronal section with striatal stroke and box indicates location of tissue photomicrogaphs and measurements
Fig. 5
Fig. 5
Effects of PDE10A inhibition on angiogenesis, neurogenesis, and gliogenesis in post-striatal stroke. a (upper panel) Total EdU+ cells were increased at 6 weeks post-striatal stroke in contralateral striatum in stroke +3.0 mg/kg versus stroke + vehicle; *P < 0.0001 (F(4,15) = 32.6). a (lower panel) EdU+CD31+ cells were increased at 6 weeks post-striatal stroke in striatal tissue contralateral to the infarct. Representative images of EdU+CD31+ cells in contralateral striatum. From top left: sham + vehicle; bottom left: sham + 3.0 mg/kg. Top right: stroke + vehicle; bottom right: stroke +3.0 mg/kg. a (lower panel) Treatment with TAK-063 resulted in a significant increase in EdU+CD31+ cells in the stroke + 3.0 mg/kg versus stroke + vehicle group; *P = 0.0201. No differences were observed in sham +3.0 mg/kg and stroke + 3.0 mg/kg. Error bars represent mean ± SEM for n = 3–5 per group, F(3,9) = 9.700. b, c NeuN+ EdU+ cells showed no differences between groups at 6 weeks post-striatal stroke in contralateral and ipsilateral striatum. Error bars represent mean ± SEM for n = 3 per group, b F(3,8) = 0.3004, c F(3,8) = 0.7663. d Olig2+ EdU+ cells showed no differences between groups in ipsilateral striatum. Error bars represent mean ± SEM for n = 3–4 per group, F(3, 10) = 4.040. Scale bar = 50 μm and applies to all photomicrographs.
Fig. 6
Fig. 6
Degree of infarct size in TAK-063-treated mice. a Top panel shows Nissl-stained brain tissue section from representative stroke + 3.0 mg/kg group at 10 weeks post-stroke. The arrow indicates the core of the infarct. The lower panels quantifies the degree of stroke. The Y-axis indicates the normalized ratio of the ipsilateral stroked hemisphere over the contralateral non-stroked hemisphere. Data shown are measurements at − 0.22 to − 0.82 mm from Bregma. Stroke leads to a loss of tissue volume in the hemisphere ipsilateral to the stroke. Lower values indicate loss of tissue volume. Data show that there was no effect between the treatment groups; however, b stroke + 3.0 mg/kg and stroke + vehicle group shows a significant difference compared to sham + vehicle; *P = 0. 0146; *P = 0.0053; n = 8–10 per group. c The combined stroke groups versus the combined sham control groups (n = 18 and 32, *P = 0.001). All P values corrected for multiple comparisons. Error bars represent mean ± SEM. Scale bar = 50 μm and applies to all photomicrographs

Similar articles

Cited by

References

    1. Writing Group M. Mozaffarian D, Benjamin EJ, Go AS, Arnett DK, Blaha MJ, et al. Heart disease and stroke statistics-2016 update: a report from the American Heart Association. Circulation. 2016;133(4):e38–360. doi: 10.1161/CIR.0000000000000350. - DOI - PubMed
    1. Pollock A, Baer G, Campbell P, Choo PL, Forster A, Morris J, Pomeroy VM, Langhorne P, Cochrane Stroke Group Physical rehabilitation approaches for the recovery of function and mobility following stroke. Cochrane Database Syst Rev. 2014;4:CD001920. doi: 10.1002/14651858.CD001920.pub3. - DOI - PMC - PubMed
    1. Sofroniew MV. Molecular dissection of reactive astrogliosis and glial scar formation. Trends Neurosci. 2009;32(12):638–647. doi: 10.1016/j.tins.2009.08.002. - DOI - PMC - PubMed
    1. Clarkson AN, Overman JJ, Zhong S, Mueller R, Lynch G, Carmichael ST. AMPA receptor-induced local brain-derived neurotrophic factor signaling mediates motor recovery after stroke. J Neurosci. 2011;31(10):3766–3775. doi: 10.1523/JNEUROSCI.5780-10.2011. - DOI - PMC - PubMed
    1. Clarkson AN, Huang BS, Macisaac SE, Mody I, Carmichael ST. Reducing excessive GABA-mediated tonic inhibition promotes functional recovery after stroke. Nature. 2010;468(7321):305–309. doi: 10.1038/nature09511. - DOI - PMC - PubMed

Publication types

Substances