Observational Study
. 2020 May 7:9:e49206.
doi: 10.7554/eLife.49206.

Quantifying antibiotic impact on within-patient dynamics of extended-spectrum beta-lactamase resistance

Affiliations
Observational Study

Quantifying antibiotic impact on within-patient dynamics of extended-spectrum beta-lactamase resistance

Rene Niehus et al. Elife. .

Abstract

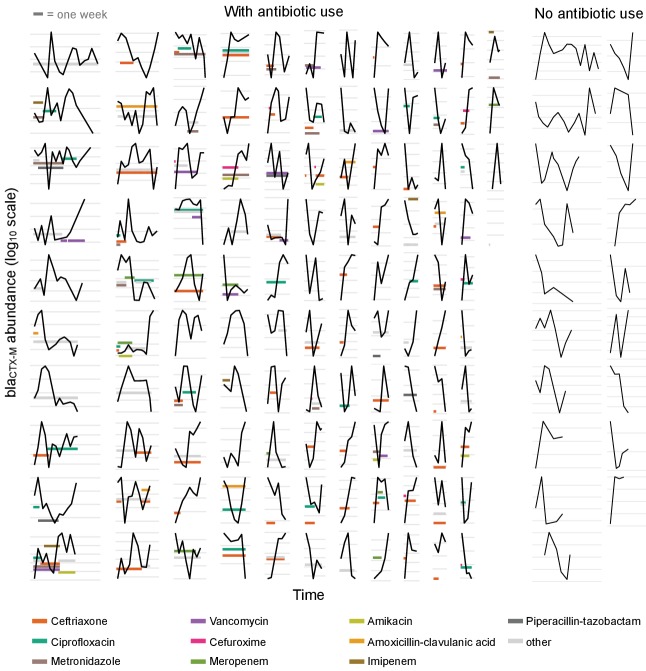
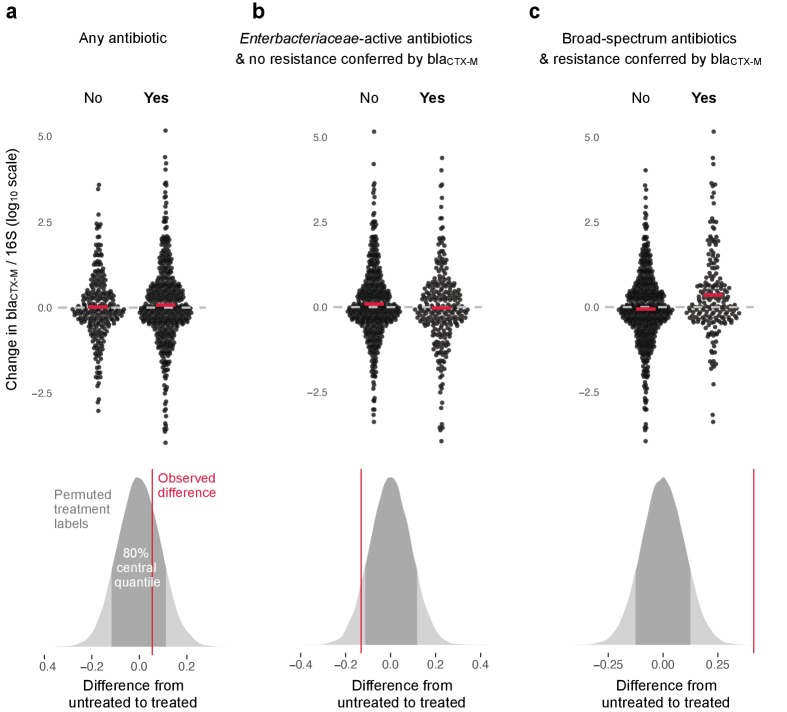
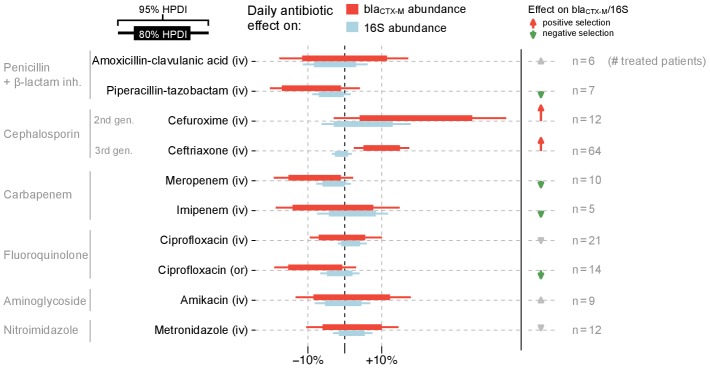
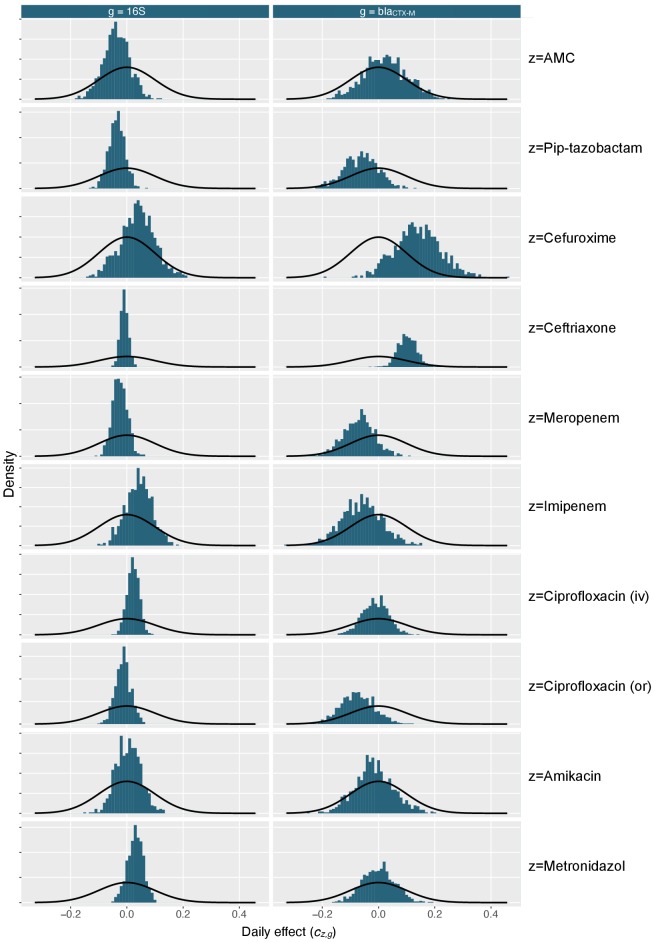
Antibiotic-induced perturbation of the human gut flora is expected to play an important role in mediating the relationship between antibiotic use and the population prevalence of antibiotic resistance in bacteria, but little is known about how antibiotics affect within-host resistance dynamics. Here we develop a data-driven model of the within-host dynamics of extended-spectrum beta-lactamase (ESBL) producing Enterobacteriaceae. We use blaCTX-M (the most widespread ESBL gene family) and 16S rRNA (a proxy for bacterial load) abundance data from 833 rectal swabs from 133 ESBL-positive patients followed up in a prospective cohort study in three European hospitals. We find that cefuroxime and ceftriaxone are associated with increased blaCTX-M abundance during treatment (21% and 10% daily increase, respectively), while treatment with meropenem, piperacillin-tazobactam, and oral ciprofloxacin is associated with decreased blaCTX-M (8% daily decrease for all). The model predicts that typical antibiotic exposures can have substantial long-term effects on blaCTX-M carriage duration.

Trial registration: ClinicalTrials.gov NCT01208519.

Keywords: antibiotic resistance; epidemiology; extended-spectrum beta-lactamase; global health; gut microbiota; human; infectious disease; microbiology; resistance carriage; state-space model; within-host dynamics.

Plain language summary

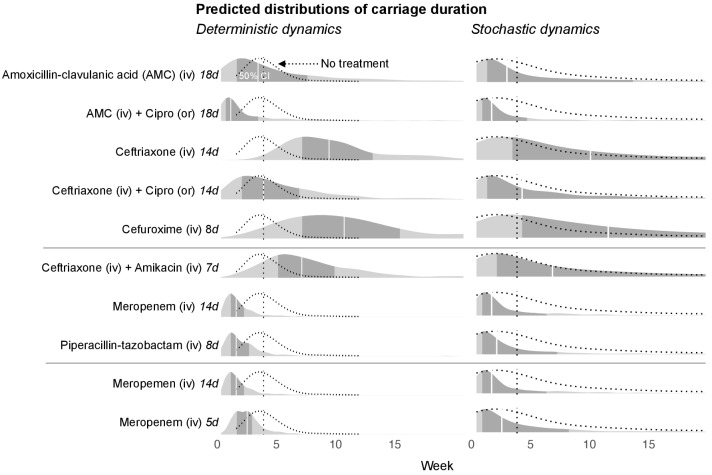
Bacteria that are resistant to antibiotics are a growing global health crisis. One type of antibiotic resistance arises when certain bacteria that can produce enzymes called extended-spectrum beta-lactamases (or ESBLs for short) become more common in the gut. These enzymes stop important antibiotics, like penicillin, from working. However, exactly which antibiotics and treatment durations contribute to the emergence of this antibiotic resistance remain unknown. Now, Niehus et al. find certain antibiotics that are associated with an increase in the number of gut bacteria carrying antibiotic resistance genes for ESBL enzymes. First, rectal swabs collected from 133 patients from three European hospitals were analysed to measure the total gut bacteria and the number of genes for ESBL enzymes. These samples had been collected at several time points including when the patient was first admitted to hospital, then every two to three days during their stay, and finally when they were discharged. Combining the analysis of the samples with details of the patients’ charts showed that treatment with two antibiotics: cefuroxime and ceftriaxone, was linked to an increase in ESBL genes in the gut bacteria. Other antibiotics – namely, meropenem, piperacillin-tazobactam and oral ciprofloxacin – were associated with a decrease in the number of bacteria with ESBL genes. Niehus et al. then performed further analysis to see if different treatment regimens affected how long patients were carrying gut bacteria with ESBL genes. This predicted that a longer course of meropenem, 14 days rather than 5 days, would shorten the length of time patients carried ESBL-resistant bacteria in their guts by 70%, although this effect will likely depend on the location of the hospital and the local prevalence of other types of antibiotic resistance. This analysis reveals new details about how antibiotic treatment can affect ESBL resistance genes. More studies are needed to understand how antibiotics affect other antibiotic resistance genes and how resistant bacteria spread. This will help scientists understand how much specific antibiotic regimens contribute to antibiotic resistance. It may also help scientists develop new antibiotic treatment strategies that reduce antibiotic resistance.


Conflict of interest statement

RN, Ev, YM, AT, CL, YC, HG, ET, BC, LP, SM No competing interests declared, BC Reviewing Editor, eLife

Figures

Figure 1.
Figure 1.. Time series plots demonstrating the diverse range of dynamical patterns of blaCTX-M resistance gene abundance across the 132 patients with two or more samples.
The x-axis scale is identical across panels, the length of one week is given for scale in the top-left corner. Timelines are ordered by length. The y-axis scale differs between panels, with the space between vertical grey lines representing a 10-fold change in the absolute blaCTX-M gene abundance (measured in copy numbers). The left-hand side shows patients who received antibiotic treatment (n = 113), and the two right-hand side columns are patients without antibiotic treatment (n = 19). For clarity, we show only the twelve most frequently used antibiotics in distinct colours and other antibiotics in light grey.
Figure 1—figure supplement 1.
Figure 1—figure supplement 1.. Exploration of autocorrelation and different sources of data variability.
Autocorrelation and sources of variability in qPCR time series data. First-order autocorrelation averaged across all patients with more than five time points for 16S (a) and blaCTX-M (b) abundance data (red vertical line). This is compared to a histogram of the mean autocorrelation from 10,000 replicates of simulated serially uncorrelated ‘white noise’ time series, simulated using the same number of observations per patient as in the real data and the same per patient mean and variance as in the observed blaCTX-M and 16S rRNA data. The shift toward negative autocorrelation in the simulations is an artefact due to short time series, and, thus, it is the position of the observed value relative to the simulated distribution that is of interest. Both blaCTX-M and 16S data show a clear autocorrelation signal, though autocorrelation is substantially stronger for the blaCTX-M data. Panel (c) shows Bayesian estimates of the sources of variability in the measurements, given as proportion of total variability. Thick bars show the 80% credible intervals, thinner bars show the 95% credible intervals.
Figure 2.
Figure 2.. Variability of 16S abundance and blaCTX-M abundance within and between patient time series using a Bayesian hierarchical model.
In this model, abundance is distributed around individual patient intercepts, which are distributed around a common population intercept. The plot shows individual patient intercepts given as mean posterior estimates (coloured dots) together with posterior predictions for sequence abundance for each patient (grey bars show 80% central quantiles).
Figure 2—figure supplement 1.
Figure 2—figure supplement 1.. Diagnostic plots of MCMC samples.
Diagnostic visualisation of posterior samples of the standard deviation parameters in the Bayesian models given in Equation 1 (a) and in Equation 2 (b) using rank plots.
Figure 3.
Figure 3.. Association of antibiotic use with change in relative resistance (abundance of blaCTX-M divided by abundance of 16S rRNA).
The upper panels show the change in relative resistance between all neighbouring timepoints (black dots), dashed horizontal lines in grey indicate the region of no change. Pairs of violin scatter plots (with the mean values shown as red bars) contrast different treatment that occurred between those timepoints. ‘Yes’ indicates treatment with specified antibiotics and ‘No’ means treatment with other antibiotics or no treatment. The lower three panels show the distribution of mean differences of the change in relative resistance between treatment groups generated through treatment-label permutation (areas in darker grey show 80% central quantiles). The distributions are overlaid with the observed difference (red vertical line). Panel (a) compares treatment with any antibiotic versus no antibiotic (number of intervals without treatment/number of intervals with treatment are 251(N)/449(Y)). Panel (b) compares treatment with antibiotics with activity against Enterobacteriaceae and to which blaCTX-M does not confer resistance (colistin, meropenem, ertapenem, imipenem, amoxicillin-clavulanic acid, ampicillin-sulbactam, piperacillin-tazobactam, gentamicin, amikacin, ciprofloxacin, ofloxacin, levofloxacin, tigecycline, doxicycline) with all other treatment, including no treatment (445(N)/255(Y)). Finally, in panel (c) we consider antibiotics with broad-spectrum activity but to which blaCTX-M does confer resistance (cefepime, ceftazidime, ceftriaxone, cefotaxime, cefuroxime, amoxicillin, ampicillin) (513(N)/187(Y)).
Figure 4.
Figure 4.. Estimated effects of different antibiotics on within-host dynamics from a multivariable model.
The bars show estimated daily effects of individual antibiotics on the absolute blaCTX-M abundance (red) and 16S rRNA abundance (light blue) indicating the 80% and 95% highest posterior density intervals (thick and thin horizontal bars, respectively). The model also gives the antibiotic effect on the blaCTX-M/16S relative resistance shown as arrows on the right-hand side. Arrows are in grey for antibiotics with mean effect estimates between −10% and +10%, otherwise they are coloured red (positive selection) and green (negative selection). Route of antibiotic administration (intravenous, iv; oral, or) is indicated in parenthesis.
Figure 4—figure supplement 1.
Figure 4—figure supplement 1.. Variability of replicate qPCR runs across the qPCR scale.
Variability in replicate qPCR runs. The standard deviation of repeat qPCR machine runs versus their mean for 16S (red) and blaCTX-M (turquoise) after logarithmic transformation. The red line represents a smooth spline fit to the data with five degrees of freedom.
Figure 4—figure supplement 2.
Figure 4—figure supplement 2.. Marginal posterior distributions for antibiotic effect parameters.
Marginal distribution of antibiotic effect parameters cz,g (blue histograms) shows together with density distribution of the prior (black curves). AMC stands for amoxicillin-clavulanic acid, iv for intravenous, and or for oral route.
Figure 4—figure supplement 3.
Figure 4—figure supplement 3.. Diagnostic plots of MCMC samples.
Diagnostic rank plots of posterior samples of the effect parameters c of the Bayesian model given in model definition 4. AMC stands for amoxicillin-clavulanic acid, iv for intravenous, and or for oral route.
Figure 5.
Figure 5.. Simulated predictions of blaCTX-M carriage duration under different antibiotic treatments.
The distributions on the left-hand side shows model predictions with parameter uncertainty, but assuming deterministic dynamics. The right-hand side shows the predictions with parameter uncertainty as well as Markov process uncertainty. The darker grey areas shows the 50% credible intervals and the white lines show the median predictions. Each density distribution is overlaid with the density line of the no treatment case (dotted line) and its median prediction (dotted vertical line). In the first five rows, we compare predictions for treatment with amoxicillin-clavulanic acid (18 days) and ceftriaxone (14 days), and each in combination treatment with ciprofloxacin. In the next three rows, we compare treatment with ceftriaxone plus amikacin (7 days), meropenem (14 days), and piperacillin-tazobactam (8 days). In the final two rows, we compare a 14 day course of meropenem with a shortened course (5 days). AMC stands for amoxicillin-clavulanic acid.

References

    1. Arcilla MS, van Hattem JM, Haverkate MR, Bootsma MCJ, van Genderen PJJ, Goorhuis A, Grobusch MP, Lashof AMO, Molhoek N, Schultsz C, Stobberingh EE, Verbrugh HA, de Jong MD, Melles DC, Penders J. Import and spread of extended-spectrum β-lactamase-producing Enterobacteriaceae by international travellers (COMBAT study): a prospective, multicentre cohort study. The Lancet Infectious Diseases. 2017;17:78–85. doi: 10.1016/S1473-3099(16)30319-X. - DOI - PubMed
    1. Balaban NQ, Helaine S, Lewis K, Ackermann M, Aldridge B, Andersson DI, Brynildsen MP, Bumann D, Camilli A, Collins JJ, Dehio C, Fortune S, Ghigo JM, Hardt WD, Harms A, Heinemann M, Hung DT, Jenal U, Levin BR, Michiels J, Storz G, Tan MW, Tenson T, Van Melderen L, Zinkernagel A. Definitions and guidelines for research on antibiotic persistence. Nature Reviews Microbiology. 2019;17:441–448. doi: 10.1038/s41579-019-0196-3. - DOI - PMC - PubMed
    1. Blanquart F. Evolutionary epidemiology models to predict the dynamics of antibiotic resistance. Evolutionary Applications. 2019;12:365–383. doi: 10.1111/eva.12753. - DOI - PMC - PubMed
    1. Bonnet R. Growing group of Extended-Spectrum -Lactamases: the CTX-M Enzymes. Antimicrobial Agents and Chemotherapy. 2004;48:1–14. doi: 10.1128/AAC.48.1.1-14.2004. - DOI - PMC - PubMed
    1. Buelow E, Gonzalez TB, Versluis D, Oostdijk EA, Ogilvie LA, van Mourik MS, Oosterink E, van Passel MW, Smidt H, D'Andrea MM, de Been M, Jones BV, Willems RJ, Bonten MJ, van Schaik W. Effects of selective digestive decontamination (SDD) on the gut resistome. Journal of Antimicrobial Chemotherapy. 2014;69:2215–2223. doi: 10.1093/jac/dku092. - DOI - PubMed

MeSH terms

Associated data