

Quantifying Protein-Protein Interactions in Molecular Simulations
- PMID: 32379446
- PMCID: PMC7294537
- DOI: 10.1021/acs.jpcb.9b11802
Quantifying Protein-Protein Interactions in Molecular Simulations
Abstract
Interactions among proteins, nucleic acids, and other macromolecules are essential for their biological functions and shape the physicochemcial properties of the crowded environments inside living cells. Binding interactions are commonly quantified by dissociation constants Kd, and both binding and nonbinding interactions are quantified by second osmotic virial coefficients B2. As a measure of nonspecific binding and stickiness, B2 is receiving renewed attention in the context of so-called liquid-liquid phase separation in protein and nucleic acid solutions. We show that Kd is fully determined by B2 and the fraction of the dimer observed in molecular simulations of two proteins in a box. We derive two methods to calculate B2. From molecular dynamics or Monte Carlo simulations using implicit solvents, we can determine B2 from insertion and removal energies by applying Bennett's acceptance ratio (BAR) method or the (binless) weighted histogram analysis method (WHAM). From simulations using implicit or explicit solvents, one can estimate B2 from the probability that the two molecules are within a volume large enough to cover their range of interactions. We validate these methods for coarse-grained Monte Carlo simulations of three weakly binding proteins. Our estimates for Kd and B2 allow us to separate out the contributions of nonbinding interactions to B2. Comparison of calculated and measured values of Kd and B2 can be used to (re-)parameterize and improve molecular force fields by calibrating specific affinities, overall stickiness, and nonbinding interactions. The accuracy and efficiency of Kd and B2 calculations make them well suited for high-throughput studies of large interactomes.
Conflict of interest statement
The authors declare no competing financial interest.
Figures
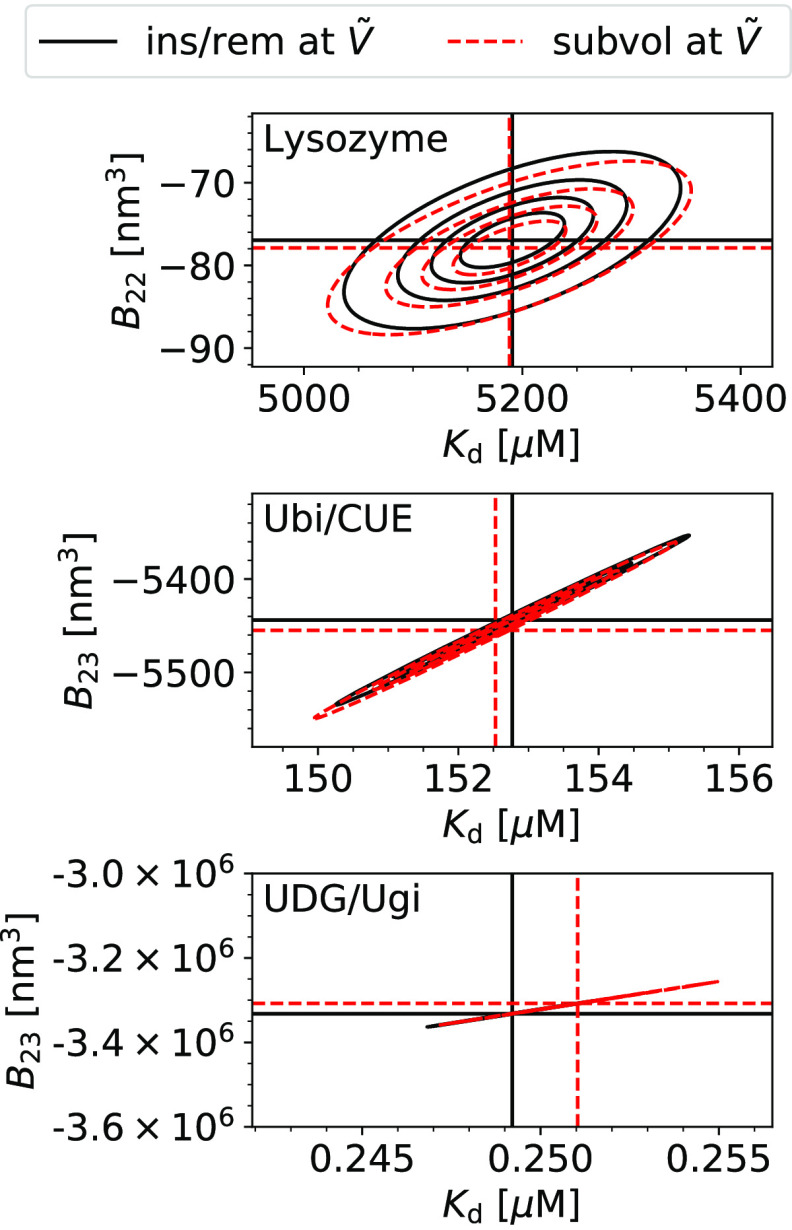
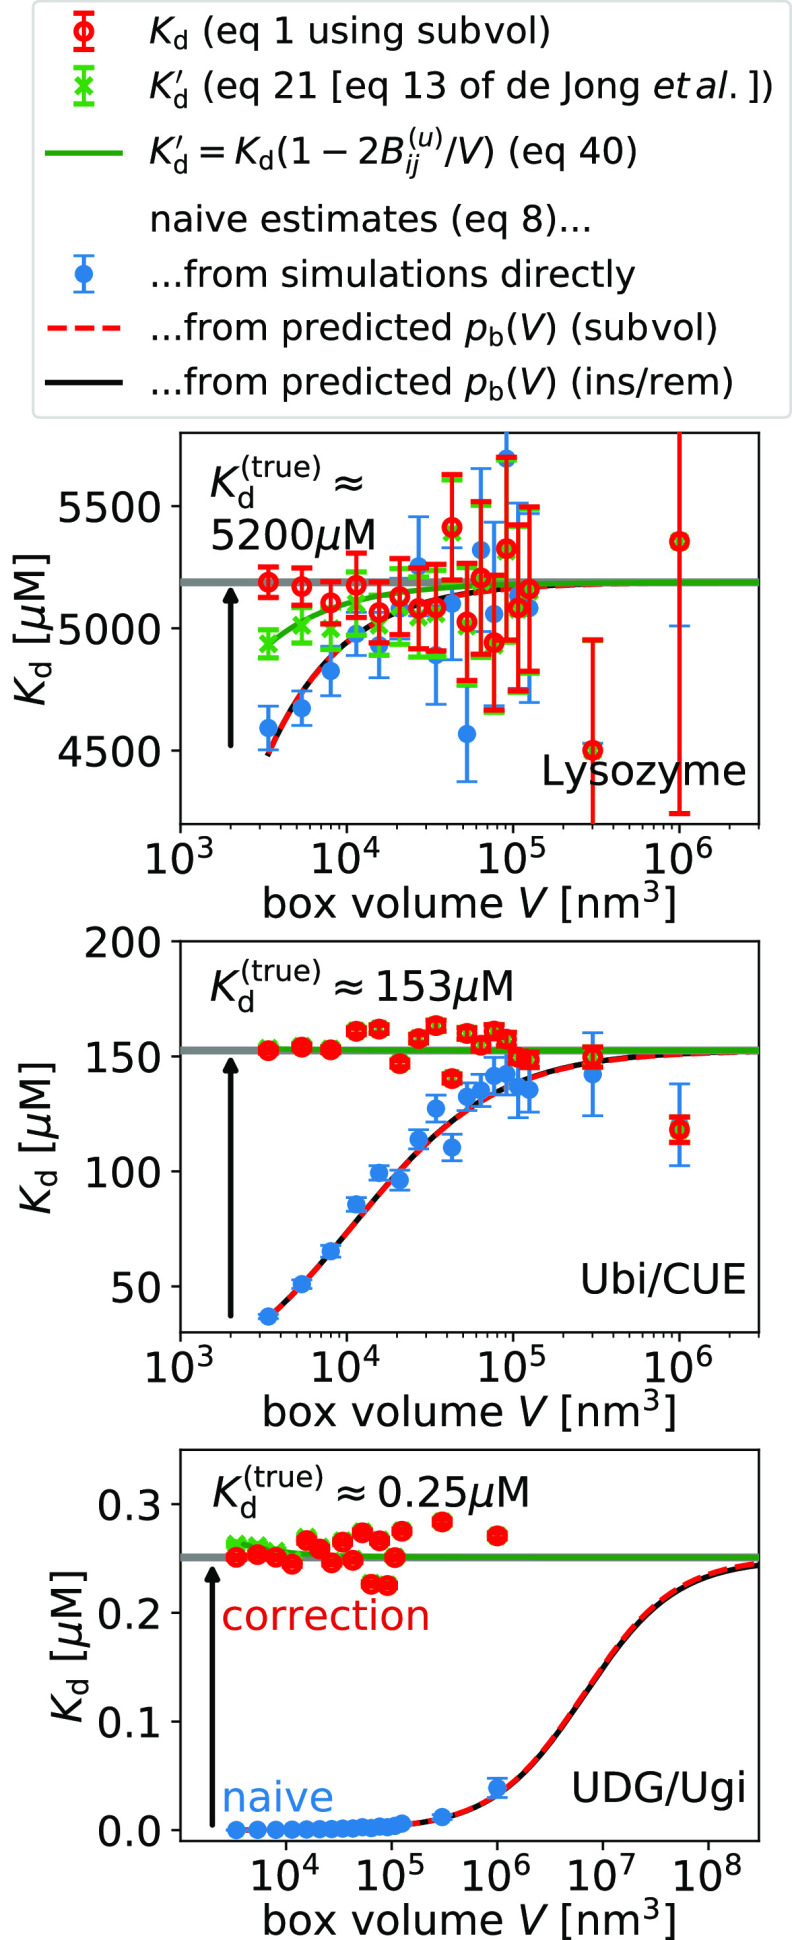
 = 3375 nm3 (magenta vertical
line) using the insertion/removal method (black, solid lines) and
the subvolume method (red, dashed lines).
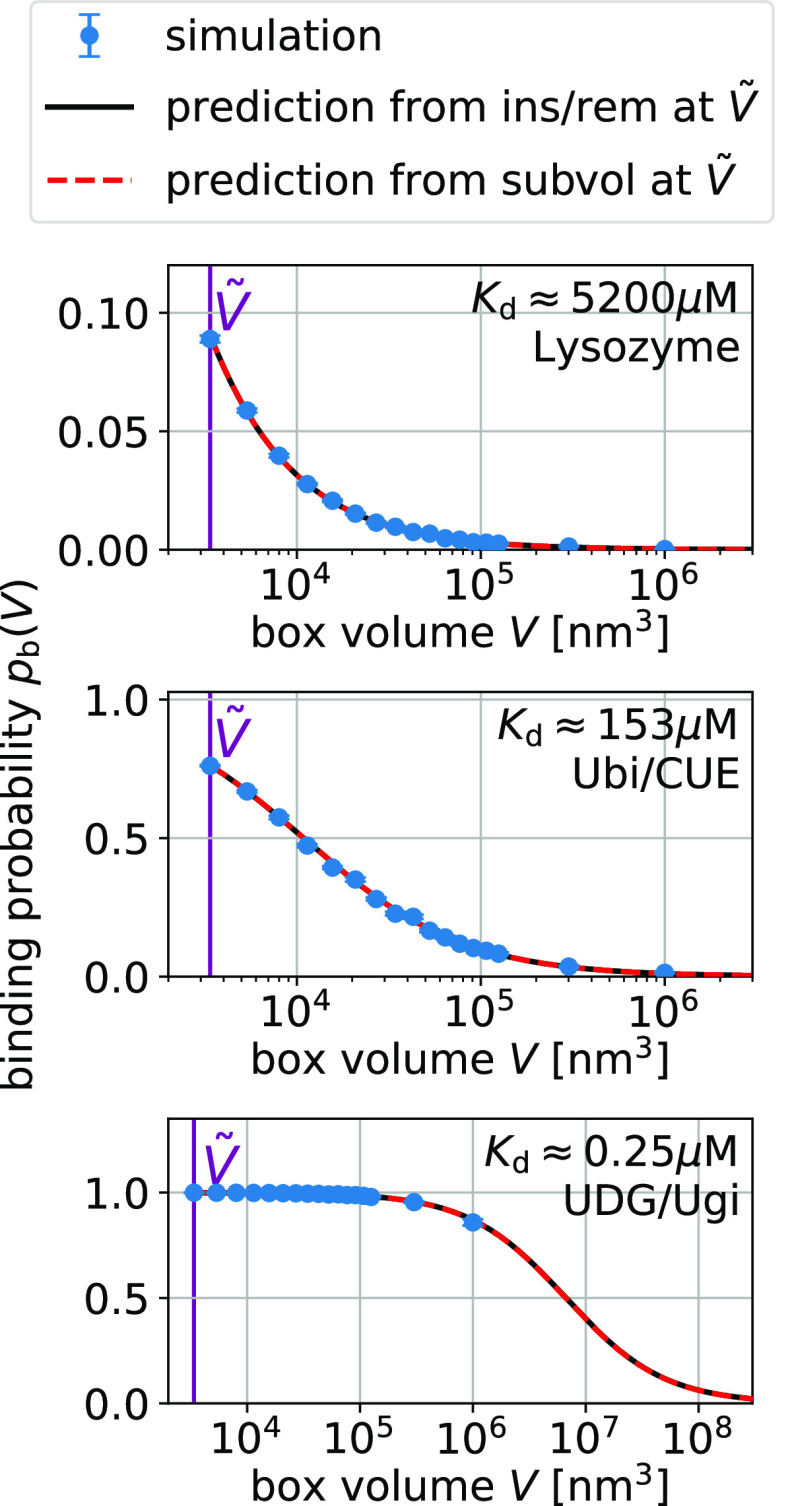
= 3375 nm3 (magenta vertical
line) using the insertion/removal method (black, solid lines) and
the subvolume method (red, dashed lines).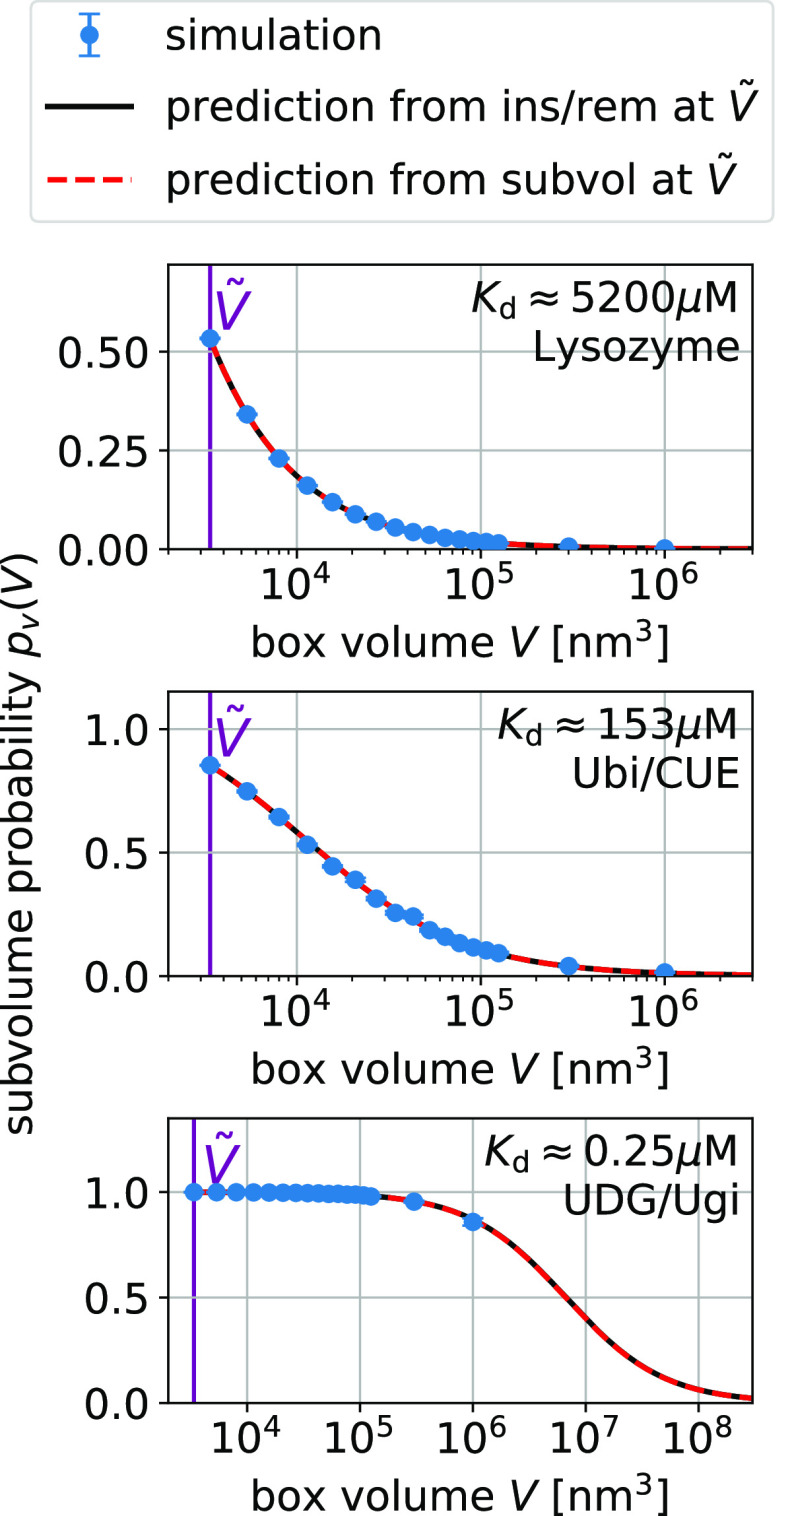
 = 3375 nm3 (magenta vertical
line) using the insertion/removal method (black, solid lines) and
the subvolume method (red, dashed lines).
= 3375 nm3 (magenta vertical
line) using the insertion/removal method (black, solid lines) and
the subvolume method (red, dashed lines).
References
-
- McMillan W. G.; Mayer J. E. The Statistical Thermodynamics of Multicomponent Systems. J. Chem. Phys. 1945, 13, 276–305. 10.1063/1.1724036. - DOI
Publication types
MeSH terms
Substances
LinkOut - more resources
Full Text Sources
