Review
. 2020 May 6;106(3):369-387.
doi: 10.1016/j.neuron.2020.03.004.

Whole-Brain Profiling of Cells and Circuits in Mammals by Tissue Clearing and Light-Sheet Microscopy

Affiliations
Review

Whole-Brain Profiling of Cells and Circuits in Mammals by Tissue Clearing and Light-Sheet Microscopy

Hiroki R Ueda et al. Neuron. .

Abstract

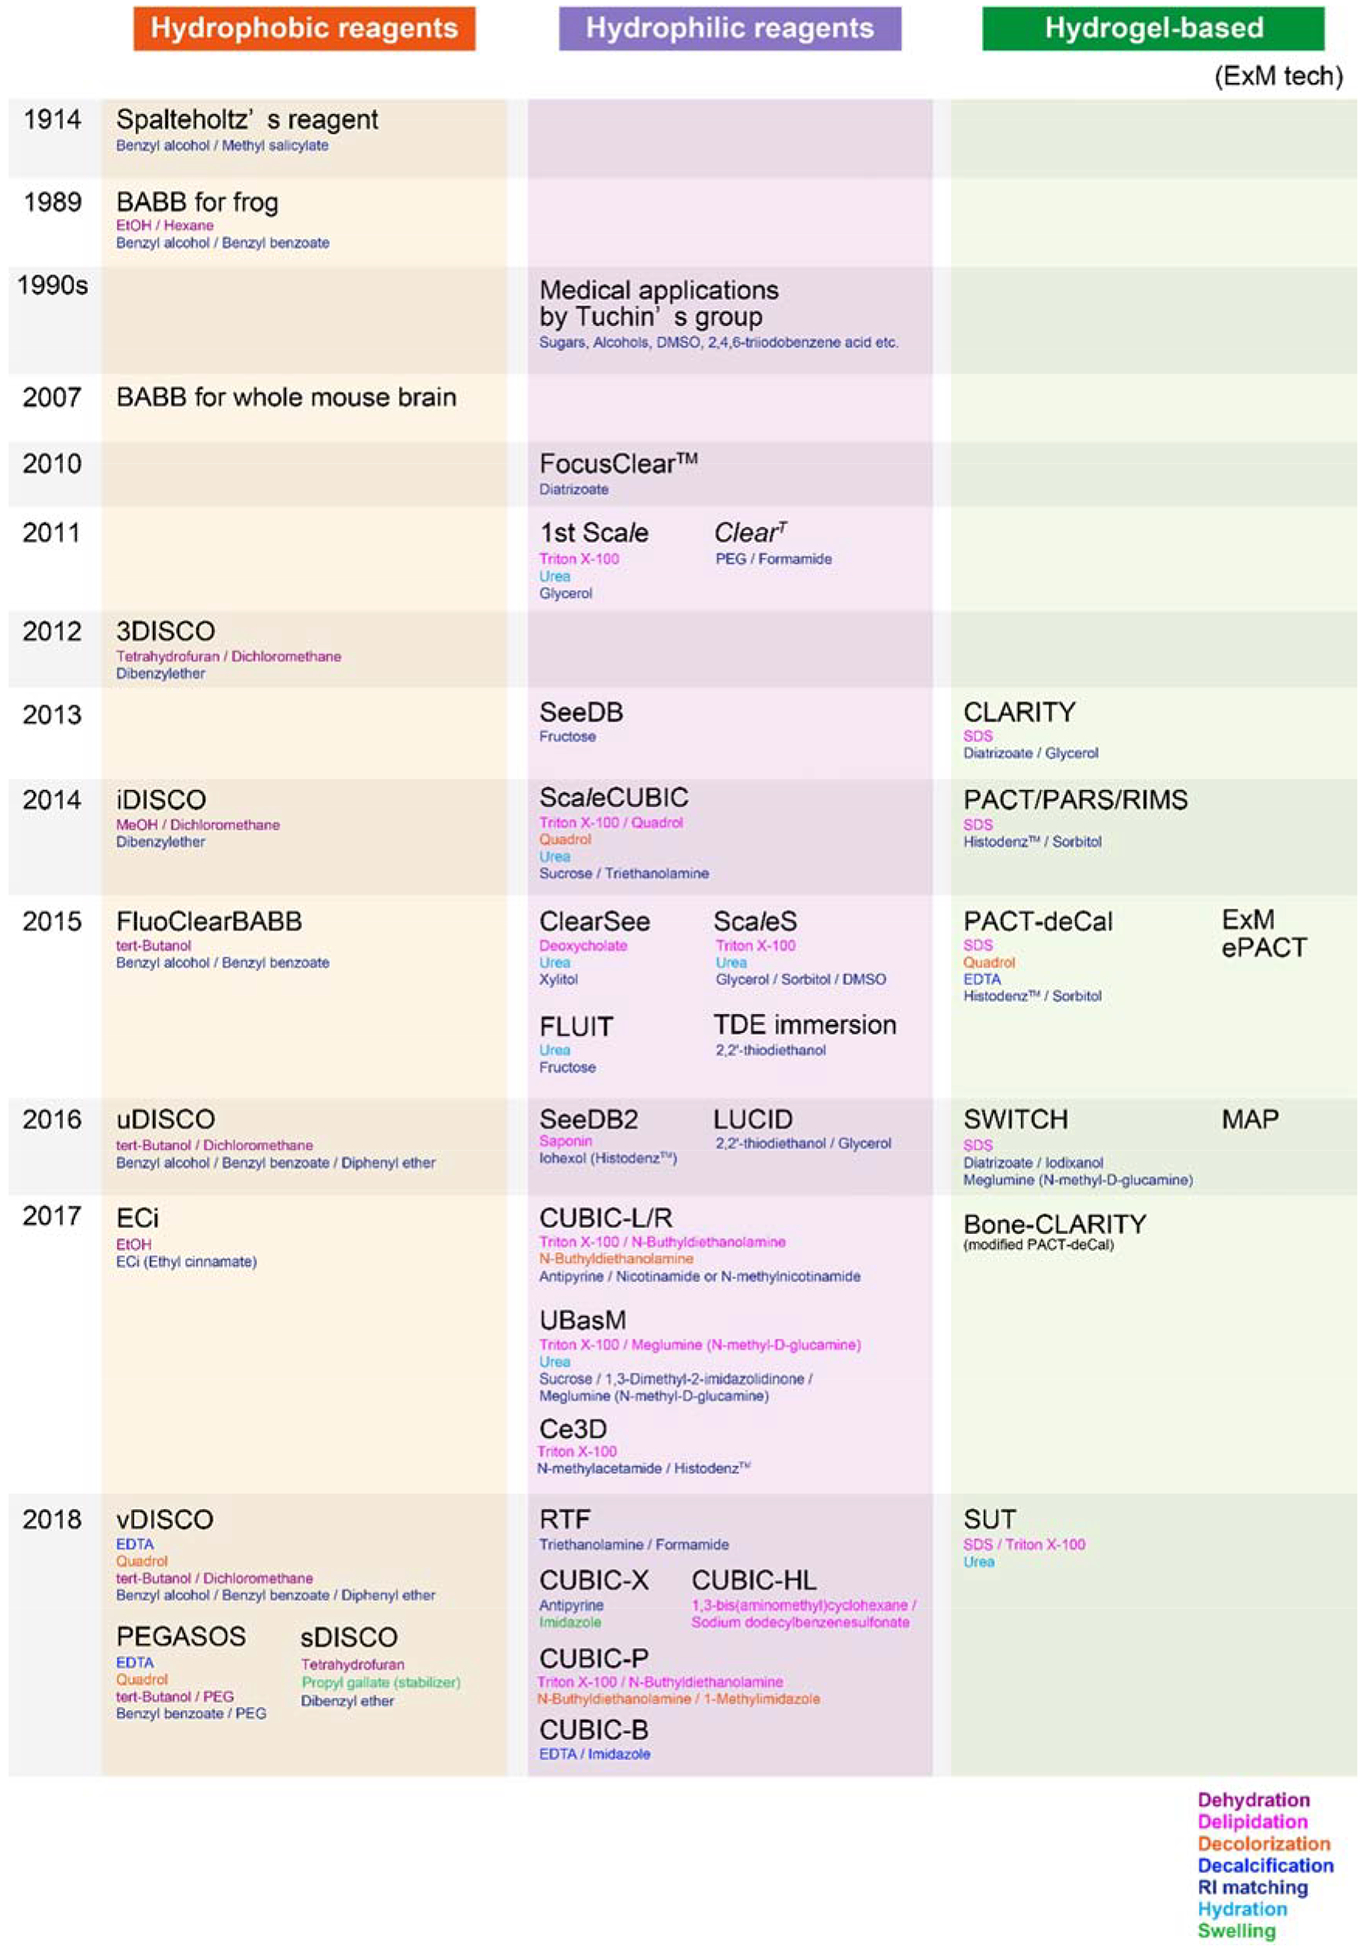
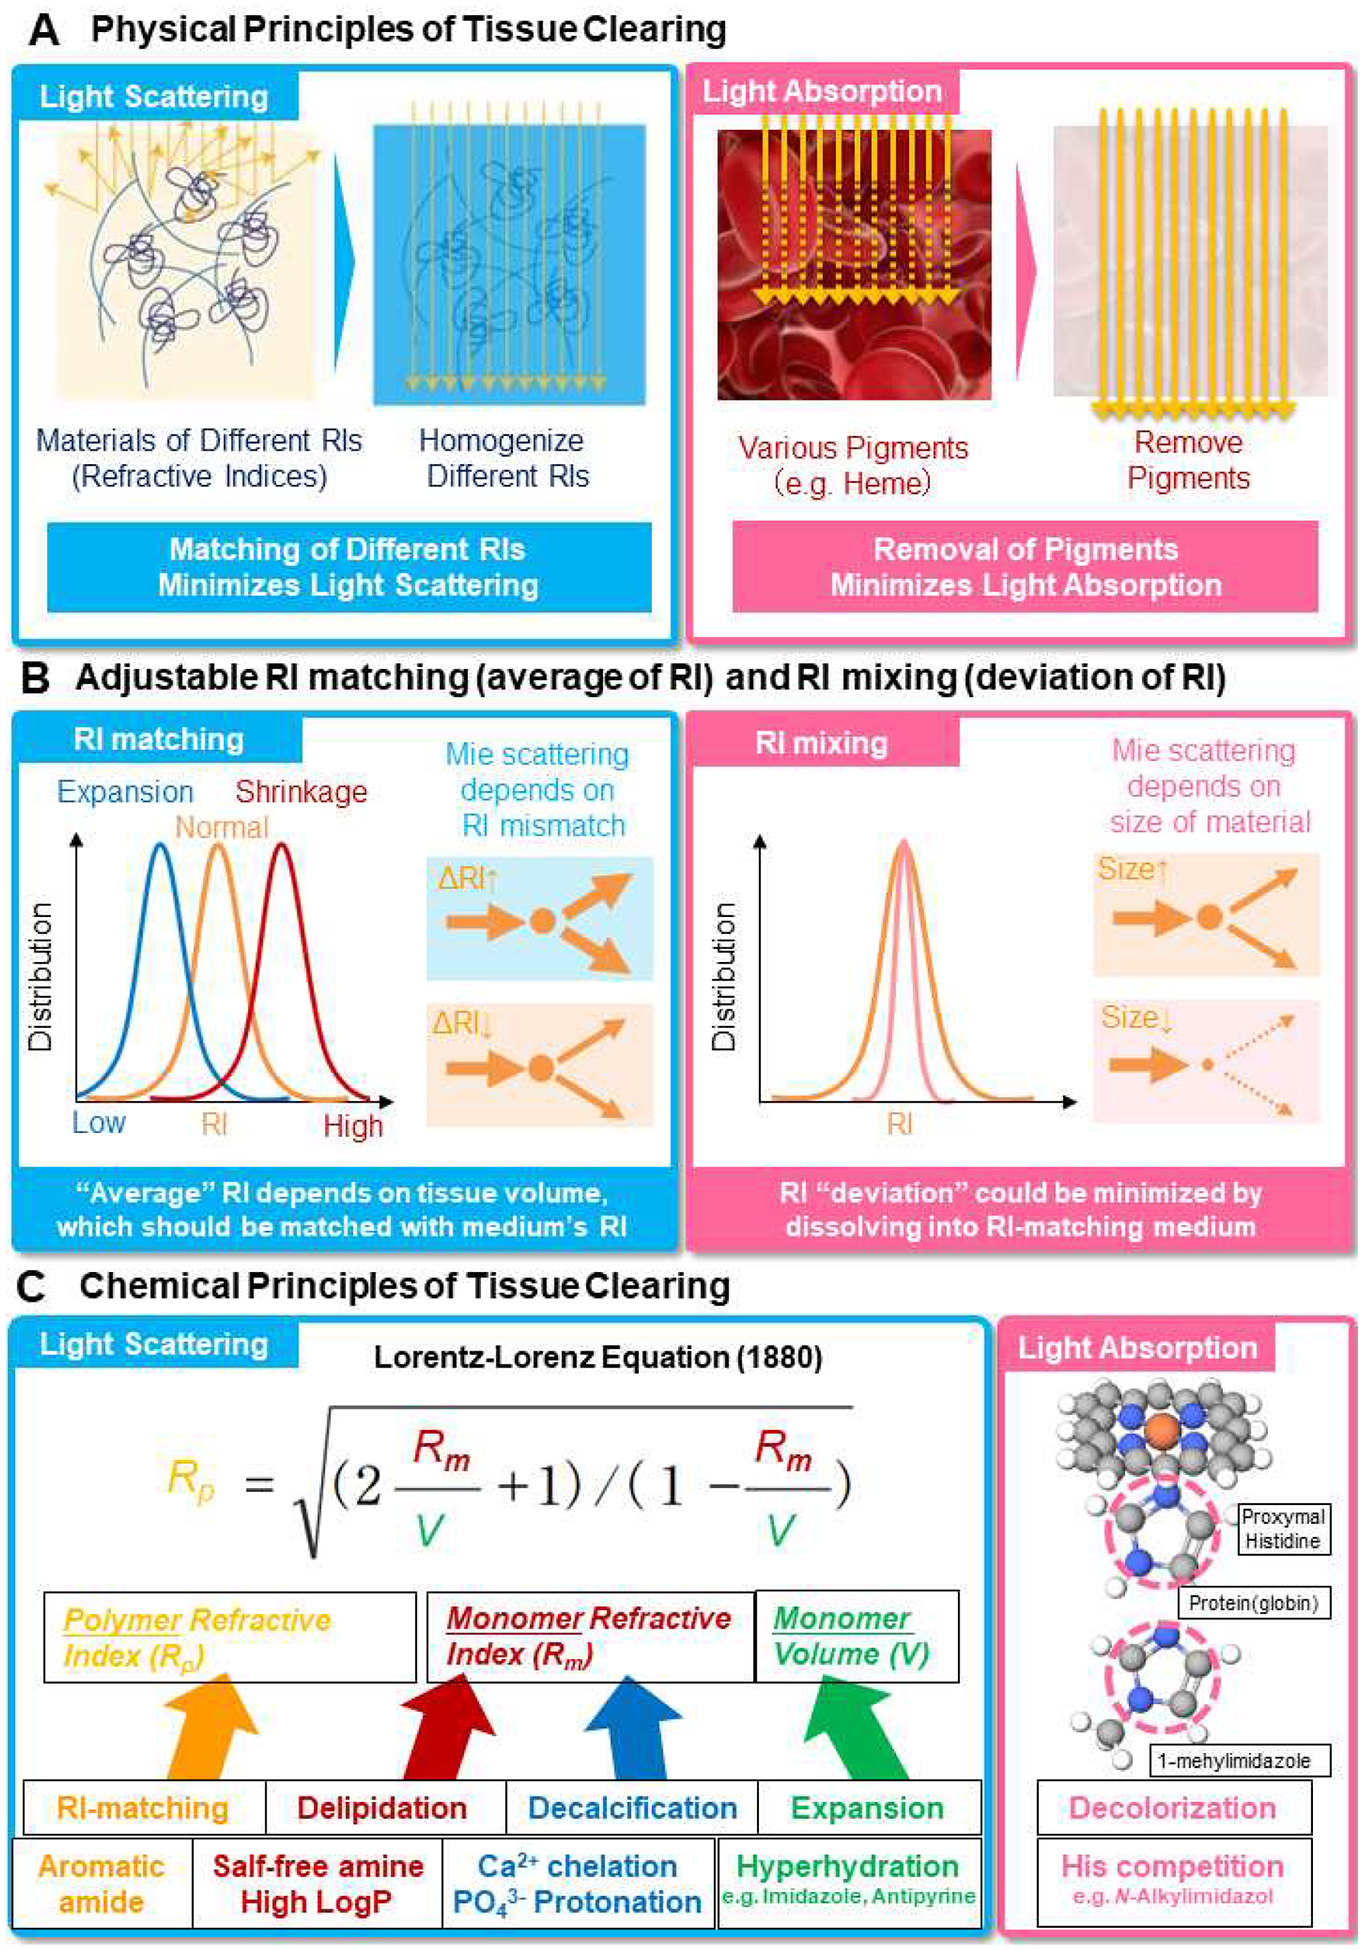
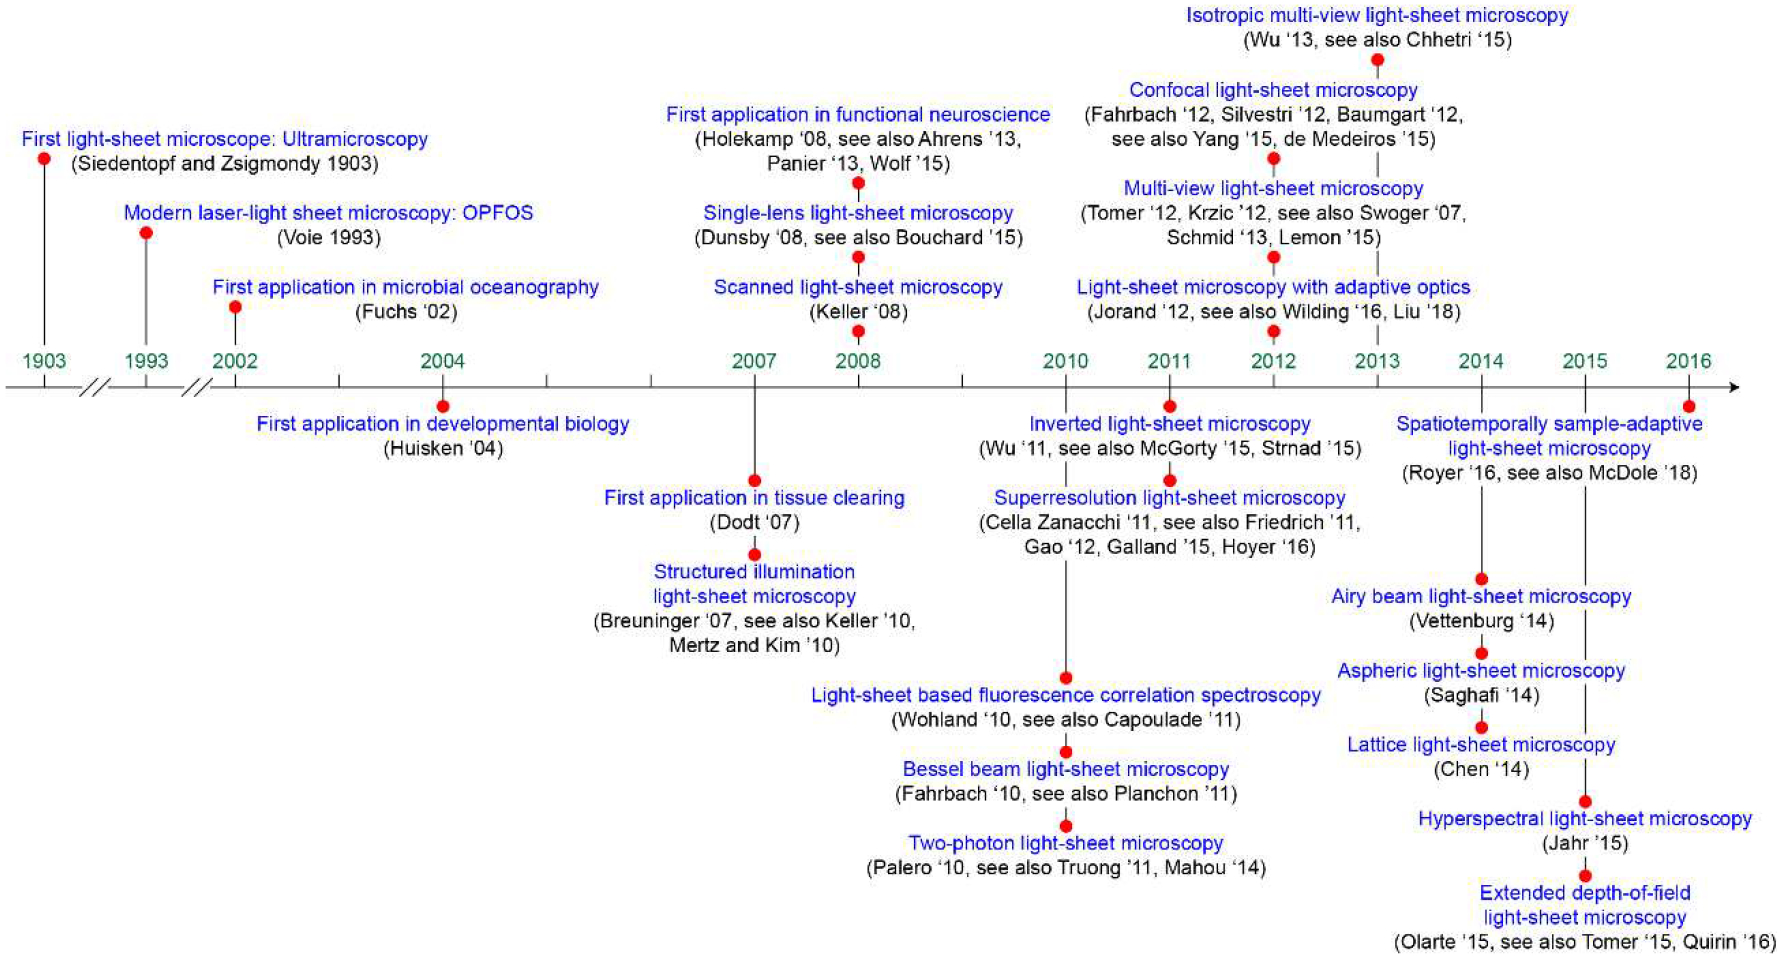
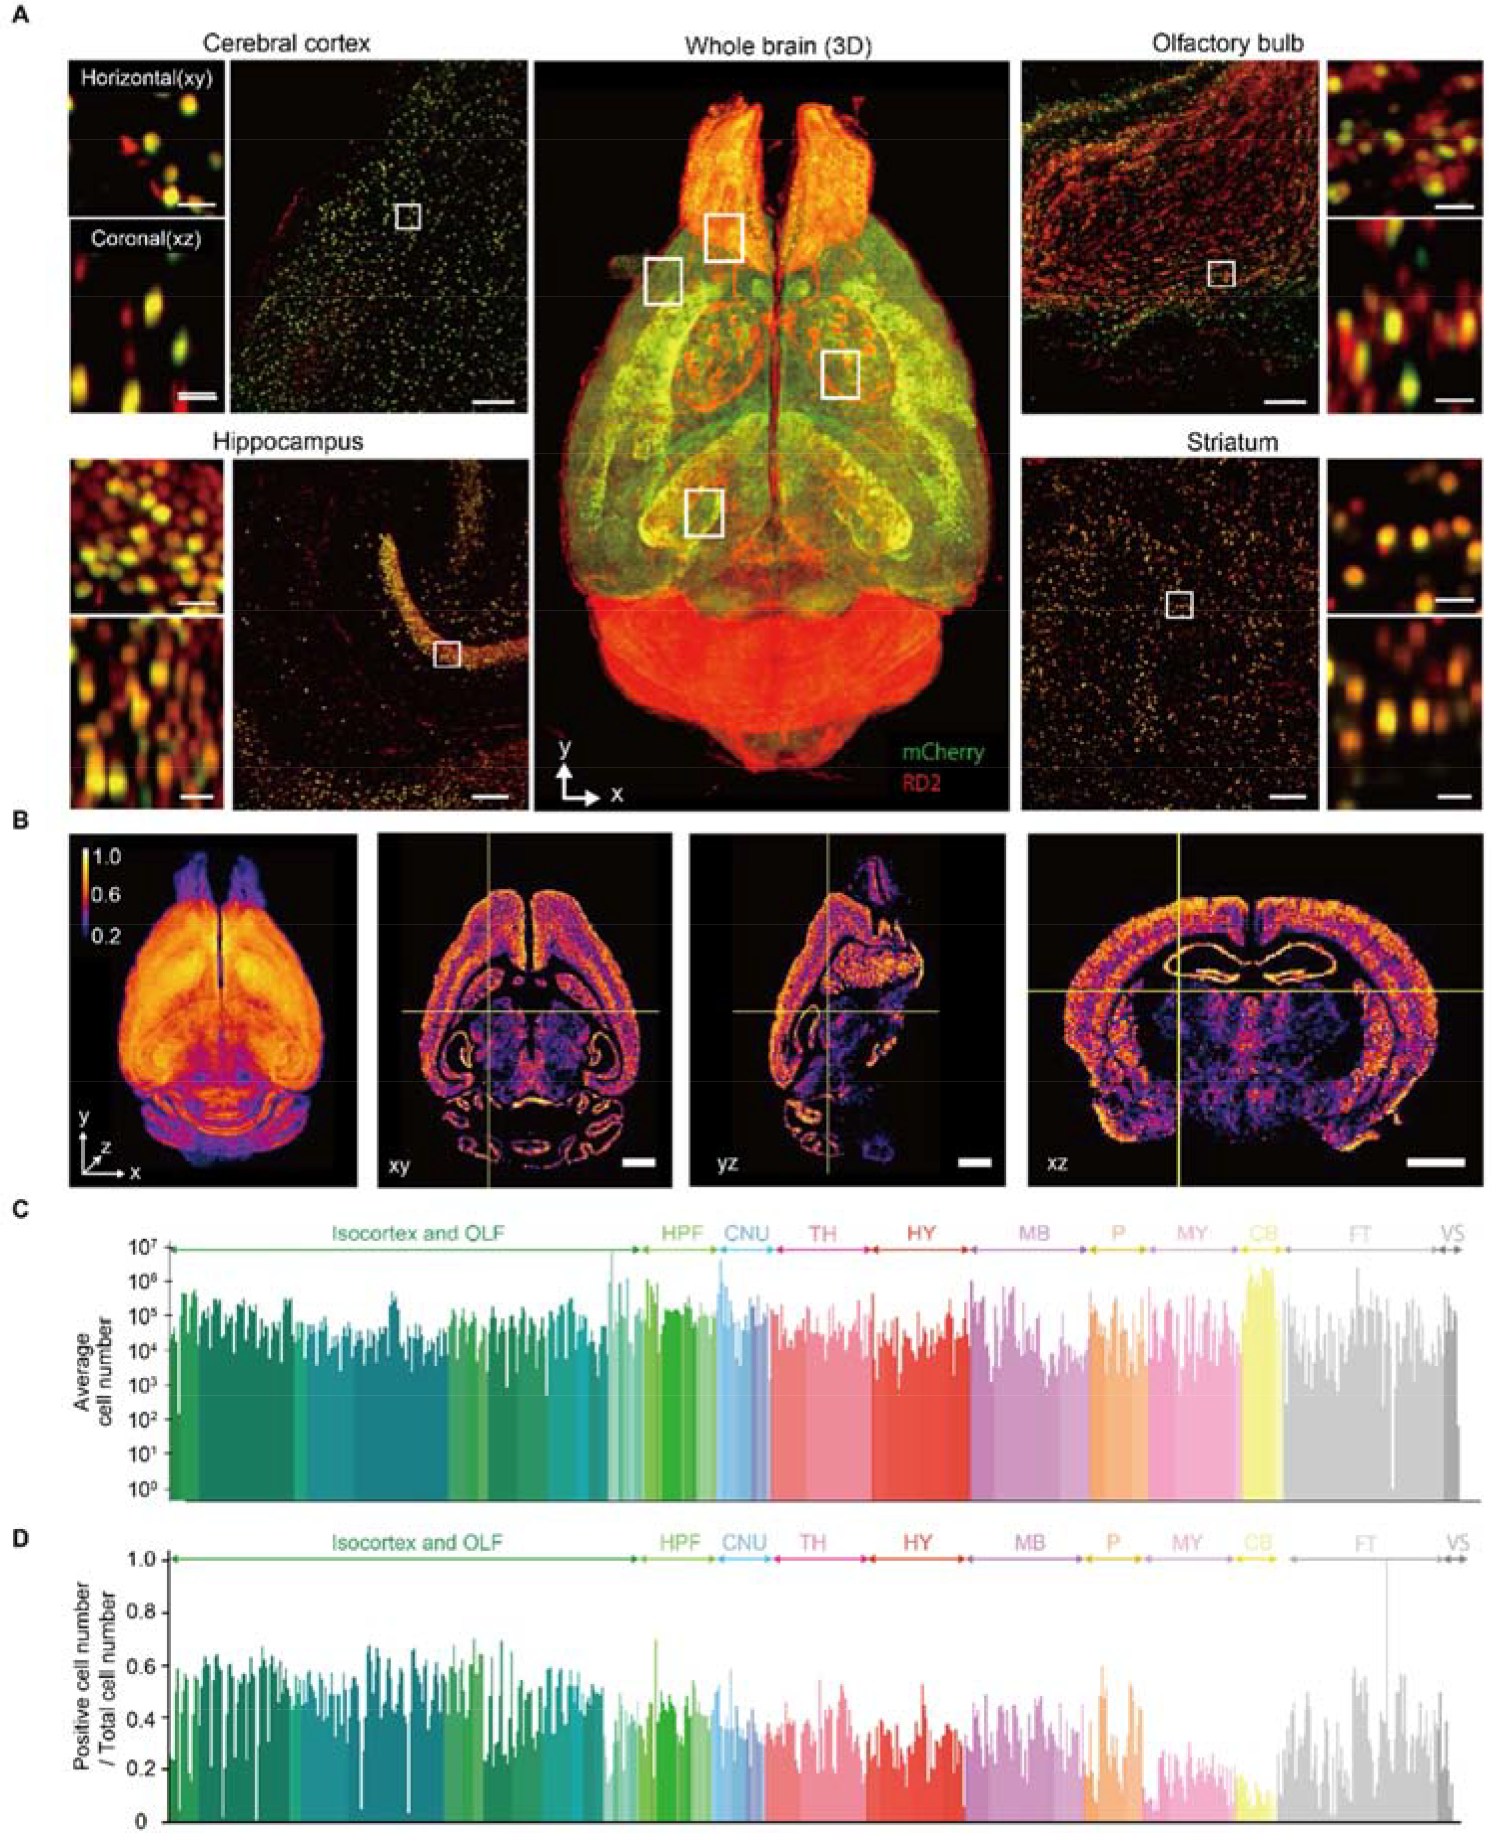
Tissue clearing and light-sheet microscopy have a 100-year-plus history, yet these fields have been combined only recently to facilitate novel experiments and measurements in neuroscience. Since tissue-clearing methods were first combined with modernized light-sheet microscopy a decade ago, the performance of both technologies has rapidly improved, broadening their applications. Here, we review the state of the art of tissue-clearing methods and light-sheet microscopy and discuss applications of these techniques in profiling cells and circuits in mice. We examine outstanding challenges and future opportunities for expanding these techniques to achieve brain-wide profiling of cells and circuits in primates and humans. Such integration will help provide a systems-level understanding of the physiology and pathology of our central nervous system.


Conflict of interest statement

Declaration of Interests H.R.U. is a co-inventor on patent applications covering the CUBIC reagents and a cofounder of CUBICStars Inc. P.J.K. is a co-inventor on patents and patent applications covering multi-view and adaptive light-sheet microscopy. P.O. is a cofounder of Certerra Inc. and Certego Therapeutics Inc.

Figures

Figure 1.
Figure 1.
Timeline of Advances in Tissue Clearing Methods.
Figure 2.
Figure 2.. Physical and Chemical Principles of Tissue Clearing.
(A) Classical Physical principles of tissue clearing proposed in 1911 by Spalteholz. Light scattering can be minimized by homogenization of RIs of materials whereas light absorption can be minimized by removing pigments. (B) adjustable RI matching (matching the tissue-size-dependent average RI of biological samples with RI-matching medium) and RI mixing (dissolving light-scattering materials into RI-matching medium to minimize RI deviation) proposed in this review. The “average” RI of biological samples depends on the size of tissues, which often expands in hydrophilic and hydrogel-based tissue-clearing methods and shrinks in hydrophobic tissue-clearing methods, and should be matched by RI-matching medium because Mie scattering depends on the RI mismatch between those of light-scattering materials and medium. For adjustable setpoint of average RI, see also Lorentz-Lorenz equation in Figure 2C. RI-deviation problem could be solved by “RI-mixing” by dissolving light-scattering materials (i.e. materials of deviation of RIs from the average RI) into the RI-matching medium since light scattering since Mie scattering depends also on the “size” of light-scattering materials. (C) Chemical principles of tissue clearing. Delipidation, decalcification and expansion processes contribute to the composite RI of biological samples (calculated by Lorentz-Lorenz Equation), which should be matched by RI-matching medium. Decolorization of heme can be achieved by competitive binding of 1-methylimidazole or other amines to iron-containing heme instead of histidine in globin. Each tissue-clearing chemical process are associated with characteristic chemical nature of tissue-clearing chemicals.
Figure 3.
Figure 3.
Timeline of Advances in Light-Sheet Microscopy.
Figure 4.
Figure 4.. Whole-Brain Profiling of Cells by Light-Sheet Fluorescent Microscopy.
(A) Volume-rendered and single plane images of a brain transduced with AAV-PHP.eB:NSE-H2B-mCherry (mCherry, green) counterstained by RD2 (red) which is cleared by CUBIC-L/R+. Overlapped signals are shown in yellow. A volume-rendered image is shown in the center. Single plane and magnified images are shown for cerebral cortex, hippocampus, olfactory bulb and striatum. Both horizontal (x-y) and coronal (x-z) views are also shown. Scale bar, 200 μm (single plane image) and 25μm (magnified image). (B) 3D and cross-section images of the positive cell number ratio map of AAV-PHP.eB (NSE-H2B-mCherry) infected whole mouse brain. Voxel size, 80 μm. Scale bar, 2 mm. Scale bar, 50 μm. (C) Average cell number of all anatomical region in three 8-week-old C57BL/6N mouse brain. Only the edge region (i.e. having no child region) are shown. OLF, olfactory areas; HPF, hippocampal formation; CNU, cerebral nuclei; HY, Hypothalamus; MB, midbrain; P, pons; MY, medulla; CB, cerebellum; FT, fiber tract; VS, ventricular system. (D) Positive cell number ratio of each anatomical region in AAV-PHP.eB (NSE-H2B-mCherry) infected mouse brain.
Figure 5.
Figure 5.. Whole-Brain Profiling of Circuits.
Single-neuron reconstruction reveals structured connectivity patterns. (A) Left, Anterograde tracing of a population of neurons in a source brain region can reveal regions of the brain to which the source connects (i.e. regions A, B, and D, but not C and E). Middle, single-cell axonal reconstruction reveals where individual neurons connect. Right, From single-neuron reconstructions, classes of neurons with similar connectivity can be identified and structured patterns of connectivity across a population can be determined. (B) Top left, Single-neuron reconstructions of projection neurons in the subiculum (boxed region). Top right, Axonal reconstructions reveal distinct brain-wide patterns of connectivity (color-coded) (Cembrowski et al., 2018; Winnubst et al., 2019). Bottom left, Single-neuron reconstructions of pyramidal tract neurons in the motor cortex (boxed region). Bottom right, Axonal reconstructions reveal two distinct types of pyramidal tract neurons based on their brain-wide connectivity (green, magenta) (Economo et al., 2018).

References

    1. Ahrens MB, Orger MB, Robson DN, Li JM, and Keller PJ (2013). Whole-brain functional imaging at cellular resolution using light-sheet microscopy. Nat Methods 10, 413–420. - PubMed
    1. Amiya T, and Tanaka T (1987). Phase transitions in crosslinked gels of natural polymers. Macromolecules 20, 1162–1164.
    1. Antonio A (1949). Quantitative researches on the optical properties of human bone. Nature 163, 604. - PubMed
    1. Aoyagi Y, Kawakami R, Osanai H, Hibi T, and Nemoto T (2015). A rapid optical clearing protocol using 2,2’-thiodiethanol for microscopic observation of fixed mouse brain. PLoS ONE 10, e0116280. - PMC - PubMed
    1. Ariel P (2017). A beginner’s guide to tissue clearing. The international journal of biochemistry & cell biology 84, 35–39. - PMC - PubMed

Publication types

LinkOut - more resources