. 2020 May 5;21(9):3266.
doi: 10.3390/ijms21093266.

Aberrant Mitochondrial Morphology and Function in the BTBR Mouse Model of Autism Is Improved by Two Weeks of Ketogenic Diet

Affiliations

Aberrant Mitochondrial Morphology and Function in the BTBR Mouse Model of Autism Is Improved by Two Weeks of Ketogenic Diet

Younghee Ahn et al. Int J Mol Sci. .

Abstract

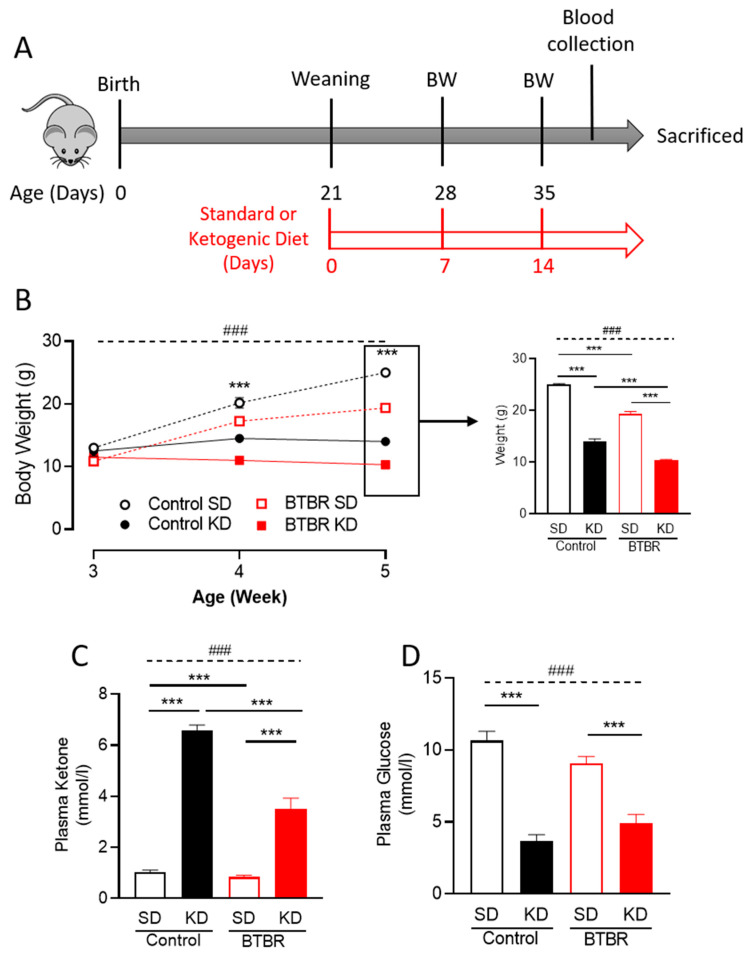
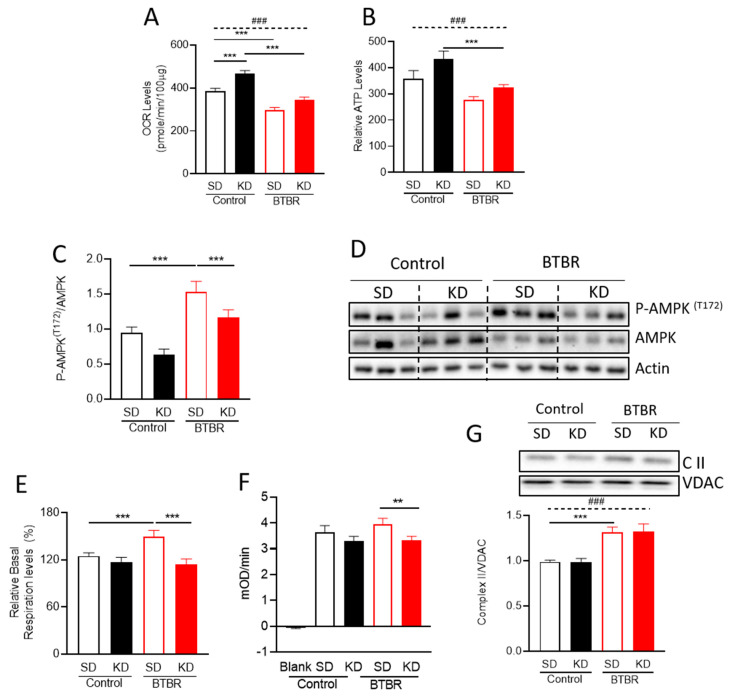
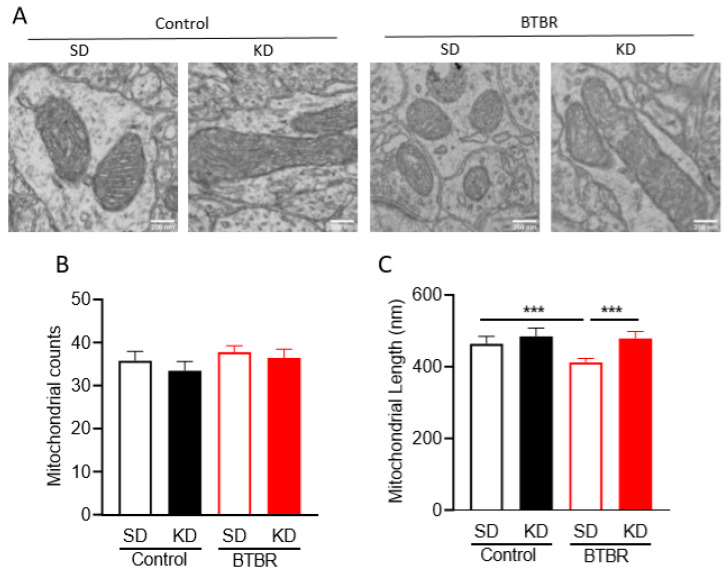
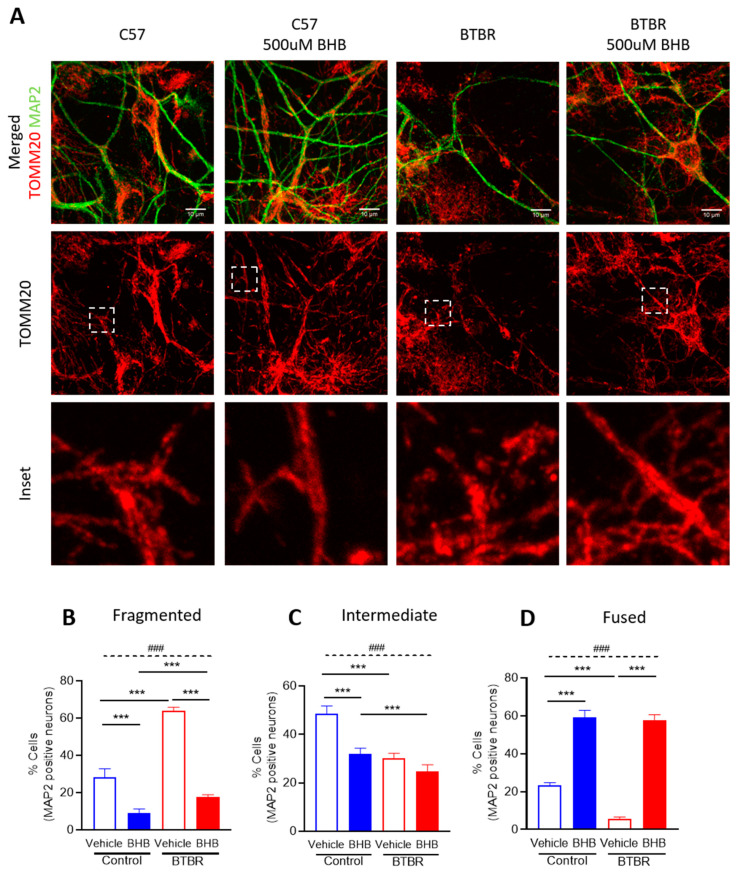
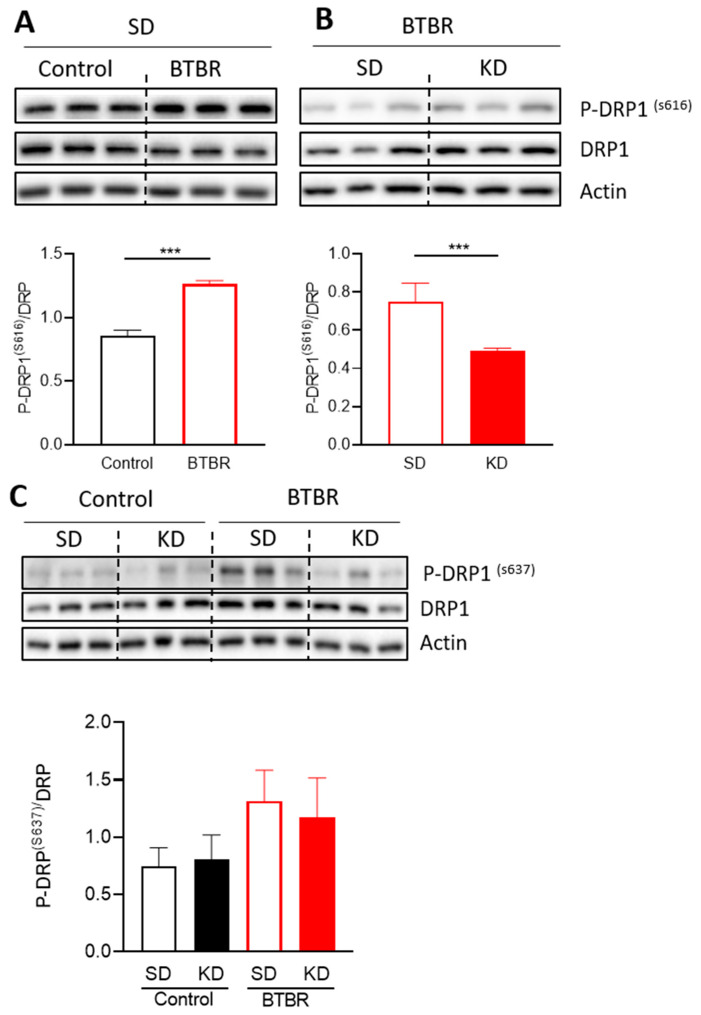
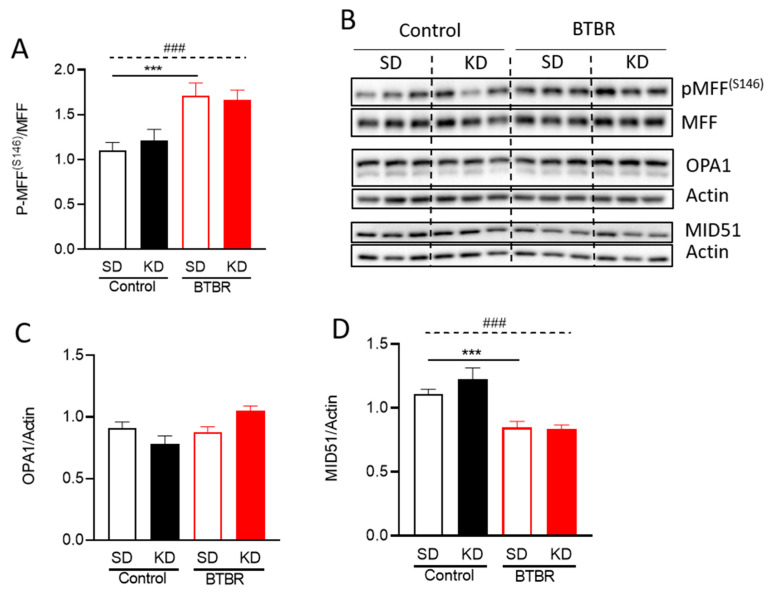
Autism spectrum disorder (ASD) is a highly prevalent neurodevelopmental disorder that exhibits a common set of behavioral and cognitive impairments. Although the etiology of ASD remains unclear, mitochondrial dysfunction has recently emerged as a possible causative factor underlying ASD. The ketogenic diet (KD) is a high-fat, low-carbohydrate diet that augments mitochondrial function, and has been shown to reduce autistic behaviors in both humans and in rodent models of ASD. The aim of the current study was to examine mitochondrial bioenergetics in the BTBR mouse model of ASD and to determine whether the KD improves mitochondrial function. We also investigated changes in mitochondrial morphology, which can directly influence mitochondrial function. We found that BTBR mice had altered mitochondrial function and exhibited smaller more fragmented mitochondria compared to C57BL/6J controls, and that supplementation with the KD improved both mitochondrial function and morphology. We also identified activating phosphorylation of two fission proteins, pDRP1S616 and pMFFS146, in BTBR mice, consistent with the increased mitochondrial fragmentation that we observed. Intriguingly, we found that the KD decreased pDRP1S616 levels in BTBR mice, likely contributing to the restoration of mitochondrial morphology. Overall, these data suggest that impaired mitochondrial bioenergetics and mitochondrial fragmentation may contribute to the etiology of ASD and that these alterations can be reversed with KD treatment.

Keywords: BTBR mouse; autism spectrum disorder; fission; fusion; ketogenic diet; mitochondria; mitochondrial dynamics; mitochondrial function.


Conflict of interest statement

The authors declare no conflict of interests.

Figures

Figure 1
Figure 1
The ketogenic diet (KD) reduces body weight and induces ketosis in both control and BTBR mice. (A) Schematic drawing of the experimental protocol; after birth of control or BTBR mice, they were kept with their parents with a standard diet. After weaning at postnatal day 21 (PD21), the mice were placed on either a standard or a ketogenic diet. Body weight was measured after 7 and 14 days of diet (PD28 and PD35 weeks of age). Blood was collected to analyze for glucose and circulating ketone bodies. All mice were sacrificed at PD35 (after 2 weeks of diet intervention). (B) Average body weight trajectory of each group in response to the indicated diet (left panel). Data are shown as mean ± SEM, n = 4–8 per group. Data were analyzed by repeated two-way ANOVA. The significant effects (main effects from two-way ANOVA) are presented as: ### p < 0.001. Further, the significant differences between groups in each timepoint revealed by the post-hoc analysis are presented as *** p < 0.001. To explore the body weight changes at PD35 (after two-week diet intervention), single timepoint body weight difference data is presented (right panel). (C) Blood ketone and (D) glucose levels were measured in both control and BTBR mice sacrificed following the two-week diet intervention. Data are shown as mean ± SEM, n = 4–6 per group. Data were analyzed by two-way ANOVA. The significant effects (main effects from two-way ANOVA) are presented as ### p < 0.001. Further, the significant differences between groups revealed by the post-hoc analysis are presented as *** p < 0.001. BW: body weight and SD: standard diet.
Figure 2
Figure 2
The ketogenic diet (KD) reverses alterations in mitochondrial bioenergetics in BTBR mice. Isolated mitochondria were used for mitochondrial bioenergetics assays with a Seahorse XF24 analyzer. (A) The bar graphs depict the oxygen consumption rates (OCR) under basal conditions and (B) relative ATP production using pyruvate and malate as substrates. (C) Densitometry analysis of P-AMPK T172. (D) Representative blots for the densitometry analysis in Figure 2C. (E) Relative basal respiration levels via Complex II, after the addition of ADP (after subtraction of antimycin A-insensitive OCR (non-mitochondrial respiration)). The enzyme activity (F) and protein expression levels (G) of electron transport chain Complex II. Data are shown as mean±SEM, n = 6 per group. Data were analyzed by two-way ANOVA. The significant effects (main effects from two-way ANOVA) are presented as: ### p<0.001. Further, the significant differences between groups revealed by the post-hoc analysis, are presented as: *** p<0.001; ** p<0.01.
Figure 3
Figure 3
Transmission electron microscopy (TEM) data of neocortical tissue sections from BTBR and control mice. (A) Representative TEM images from control and BTBR mice fed SD or KD. Scale bars represents 200 nm. (B) Mitochondrial counts from micrographs of neocortical tissue sections from control and BTBR mice with/without the KD. (C) Mitochondrial length (nm) in TEM micrographs. Data are shown as mean ± SEM, n = 3 per group. Data were analyzed by two-way ANOVA. The significant differences between groups revealed by the post-hoc analysis are presented as *** p < 0.001.
Figure 4
Figure 4
Mitochondrial morphology analysis in primary neuronal cultures from control and BTBR mice. (A) Representative confocal images of cortical neuronal cultures stained with antibodies against MAP2 (neurons, green) and TOMM20 (mitochondria, red). Dashed box highlights mitochondrial network in neurites (dendrites). Quantification of mitochondrial morphology (B) fragmented, (C) intermediate, and (D) fused in neurites in control and BTBR cultures from three independent replicates, treated as indicated. Data are shown as mean ± SEM. Data were analyzed by two-way ANOVA. The significant effects (main effects from two-way ANOVA) are presented as ### p < 0.001. Further, the significant differences between groups revealed by the post-hoc analysis are presented as *** p < 0.001.
Figure 5
Figure 5
Changes in mitochondrial proteins responsible for mitochondrial fission and fusion due to the KD. Densitometry analysis and representative blots of P-DRP1 S616, (A) comparing control and BTBR mouse under SD and (B) comparing BTBR mouse with or without KD. Data were analyzed by using a t-test; the significant differences between the groups are presented as *** p < 0.001. (C) Densitometry analysis and representative blots of P-DRP1 S637. Data are shown as mean ± SEM, n = 6 per group. Data were analyzed by two-way ANOVA. The significant effects (main effects from two-way ANOVA) are presented as ### p < 0.001. Further, the significant differences between groups revealed by the post-hoc analysis are presented as *** p < 0.001.
Figure 6
Figure 6
Changes in mitochondrial dynamic proteins due to KD. Densitometry analysis of (A) P-MFF S146, (C) OPA1, and (D) MID51. (B) Representative blots for the densitometry analysis in (A,C,D). Data are shown as mean ± SEM, n = 6 per group. Data were analyzed by two-way ANOVA. The significant effects (main effects from two-way ANOVA) are presented as ### p < 0.001. Further, the significant differences between groups revealed by the post-hoc analysis are presented as *** p < 0.001.

References

    1. Mefford H.C., Batshaw M.L., Hoffman E.P. Genomics, intellectual disability, and autism. N. Engl. J. Med. 2012;366:733–743. doi: 10.1056/NEJMra1114194. - DOI - PMC - PubMed
    1. Haas R.H. Autism and mitochondrial disease. Dev. Disabil. Res. Rev. 2010;16:144–153. doi: 10.1002/ddrr.112. - DOI - PubMed
    1. Veenstra-VanderWeele J., Blakely R.D. Networking in autism: Leveraging genetic, biomarker and model system findings in the search for new treatments. Neuropsychopharmacol. Off. Publ. Am. Coll. Neuropsychopharmacol. 2012;37:196–212. doi: 10.1038/npp.2011.185. - DOI - PMC - PubMed
    1. Lord C., Brugha T.S., Charman T., Cusack J., Dumas G., Frazier T., Jones E.J., Jones R.M., Pickles A., State M.W. Autism spectrum disorder. Nat. Rev. Dis. Primers. 2020;6:1–23. doi: 10.1038/s41572-019-0138-4. - DOI - PMC - PubMed
    1. Zablotsky B., Black L.I., Maenner M.J., Schieve L.A., Danielson M.L., Bitsko R.H., Blumberg S.J., Kogan M.D., Boyle C.A. Prevalence and Trends of Developmental Disabilities among Children in the United States: 2009–2017. Pediatrics. 2019;144:e20190811. doi: 10.1542/peds.2019-0811. - DOI - PMC - PubMed

MeSH terms