. 2020 May 7;21(1):179.
doi: 10.1186/s12859-020-3493-y.

Self-analysis of repeat proteins reveals evolutionarily conserved patterns

Affiliations

Self-analysis of repeat proteins reveals evolutionarily conserved patterns

Matthew Merski et al. BMC Bioinformatics. .

Abstract

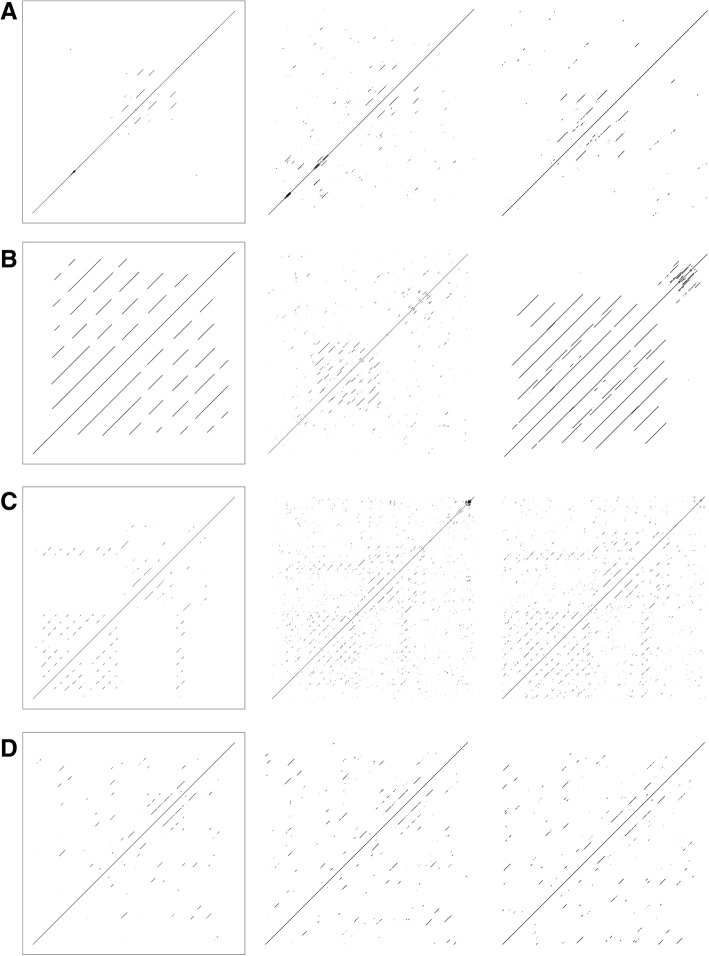
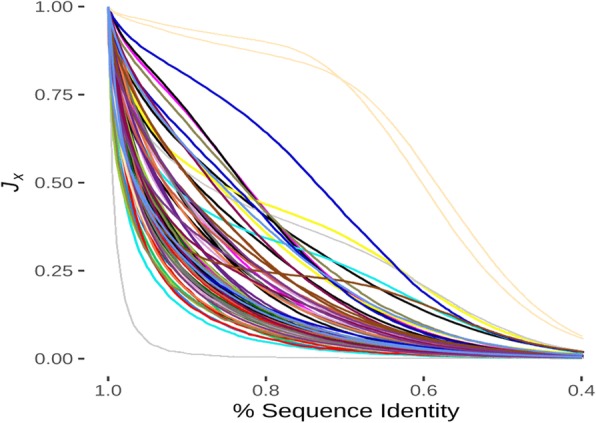
Background: Protein repeats can confound sequence analyses because the repetitiveness of their amino acid sequences lead to difficulties in identifying whether similar repeats are due to convergent or divergent evolution. We noted that the patterns derived from traditional "dot plot" protein sequence self-similarity analysis tended to be conserved in sets of related repeat proteins and this conservation could be quantitated using a Jaccard metric.

Results: Comparison of these dot plots obviated the issues due to sequence similarity for analysis of repeat proteins. A high Jaccard similarity score was suggestive of a conserved relationship between closely related repeat proteins. The dot plot patterns decayed quickly in the absence of selective pressure with an expected loss of 50% of Jaccard similarity due to a loss of 8.2% sequence identity. To perform method testing, we assembled a standard set of 79 repeat proteins representing all the subgroups in RepeatsDB. Comparison of known repeat and non-repeat proteins from the PDB suggested that the information content in dot plots could be used to identify repeat proteins from pure sequence with no requirement for structural information. Analysis of the UniRef90 database suggested that 16.9% of all known proteins could be classified as repeat proteins. These 13.3 million putative repeat protein chains were clustered and a significant amount (82.9%) of clusters containing between 5 and 200 members were of a single functional type.

Conclusions: Dot plot analysis of repeat proteins attempts to obviate issues that arise due to the sequence degeneracy of repeat proteins. These results show that this kind of analysis can efficiently be applied to analyze repeat proteins on a large scale.

Keywords: Protein evolution; Protein repeat; Repeat identification; Structural bioinformatics.


Conflict of interest statement

The authors declare that they have no competing interests.

Figures

Fig. 1
Fig. 1
Illustration of the methodological analysis of repeat proteins. a A repeat protein fingerprint (red) “sliding” over a second one (blue). At each point, JX is calculated to find the optimal overlap between the two proteins. The center black line is the self identity line. The length of the repeating sequence and gaps between them are indicated by line length and gap length respectively. The spacing between a colored line and the black identity line indicates the distance between the pairs of repeating sequences. b Highlighting of repeats in the seven-bladed human regulator of chromosome condensation protein (PDB ID:1a12) detected by the fingerprint method using a multiple sequence alignment. The protein is colored grey while the putative repeats are indicated in red and blue (alternating). The five residues before the first repeat and after the last repeat are indicated in yellow. Black dashed lines serve as a visual aids to help identify the 7 propeller blades. c Deconvolution of the dot plots by reading the indices (red) of each residue also allows reconstruction of the repeats
Fig. 2
Fig. 2
Dot plot patterns are maintained over evolutionary time in repeat proteins. For all sets of images, the leftmost figure is the consensus figure made from a set of related proteins. Black pixels indicate a DOTTER score of ≥31. A) An arrow like structure is evident in the consensus (left) and homologs of the plant RAP protein (no structure currently but reported to contain OPR repeats) among the vascular plants from the flowering plant (S. tuberosum, center) and is also evident in the earlier diverged species such as the byrophyte mosses (P. patens, right, 41.7% group sequence similarity, JX = 0.072). B) The slow sequence changes in the regulator of chromosome condensation (RCC, RepeatsDB class 4.8, consensus left) protein with its 7-bladed propeller repeat structure maintains a fairly simple, regular pattern along with a more complex one closer to the C-terminus as demonstrated by proteins from the black cottonwood tree (P. trichocarpa, center) and the obligate marine actinomycete (S. arenicola, right) despite only 23.6% group sequence similarity (JX = 0.053). C) A very complex dot plot pattern is evident among the DSCA proteins (RepeatsDB class 5.5, consensus left) in animals with examples given from the mammalian (H. glaber, center) and avian lineages (C. anna, right) with overall group 57.5% sequence similarity, JX = 0.118). D) Similarity among the vertebrate CDC23 (RepeatsDB class 3.3, consensus left) proteins is also high and the protein maintains a complex dot plot demonstrated in both the fish (N. korthausae, center) and duck (A. platyrhynchos, right) homologs (83.1% group sequence similarity, JX = 0.217). Larger versions of these panels are given as SI Fig. 9
Fig. 3
Fig. 3
Decay of JX under random mutation. The set of standard proteins was subjected to repeated rounds of in silico mutation, then the average JX between the mutant and the initial was plotted. 64 of 79 protein chains (84%) demonstrated a simple exponential decay with an R2 ≥ 0.98 (see SI Fig. 3 for full figure key)
Fig. 4
Fig. 4
Permuted repeat protein sequences. Changing an entire protein sequence while maintaining the repeat pattern does not destroy the dot pattern. a dot plot of P. marinus kinesin light chain and b) the dot plot of its mutated (no sequence identity) analog. c Histogram of the distribution of the Jaccard similarity (JX) between the proteins of the standard set and their permuted analogs
Fig. 5
Fig. 5
The CLANS plot of the clustering of repeat proteins discovered in UniRef90. Dot plots for every protein chain in UniRef90 (downloaded Sept 17, 2018, N = 78915455 chains) were calculated and those proteins with significant signal were collected (nPROT = 13297656) and all possible pairwise Jaccard comparisons were made. These were then clustered using MCL and the medioid point was calculated for every cluster with 5 or more members (nCLUST = 10205) and the inter-medoid distances were used to generate the CLANS figure. Clusters are colored according to the frequency of low complexity regions (LCR) with more intense red indicating the presence of a higher fraction of chains with one or more LCR. Notably, these LCR tend to cluster in the same region of the CLANS plot. This is a 2D representation of a 3D CLANS plot

References

    1. Kidera A, Konishi Y, Ooi T, Scheraga HA. Relation between sequence similarity and structural similarity in proteins - role of important properties of amino-acids. J Protein Chem. 1985;4(5):265–297.
    1. Krissinel E. On the relationship between sequence and structure similarities in proteomics. Bioinformatics. 2007;23(6):717–723. - PubMed
    1. Uversky VN. Intrinsically disordered proteins and their “mysterious” (meta)physics. Front Phys-Lausanne. 2019;7:10.
    1. Rado-Trilla N, Alba MM. Dissecting the role of low-complexity regions in the evolution of vertebrate proteins. BMC Evol Biol. 2012;12:155. - PMC - PubMed
    1. Chen JW, Romero P, Uversky VN, Dunker AK. Conservation of intrinsic disorder in protein domains and families: I. a database of conserved predicted disordered regions. J Proteome Res. 2006;5(4):879–887. - PMC - PubMed