

CT differential diagnosis of COVID-19 and non-COVID-19 in symptomatic suspects: a practical scoring method
- PMID: 32381057
- PMCID: PMC7203713
- DOI: 10.1186/s12890-020-1170-6
CT differential diagnosis of COVID-19 and non-COVID-19 in symptomatic suspects: a practical scoring method
Abstract
Background: Although typical and atypical CT image findings of COVID-19 are reported in current studies, the CT image features of COVID-19 overlap with those of viral pneumonia and other respiratory diseases. Hence, it is difficult to make an exclusive diagnosis.
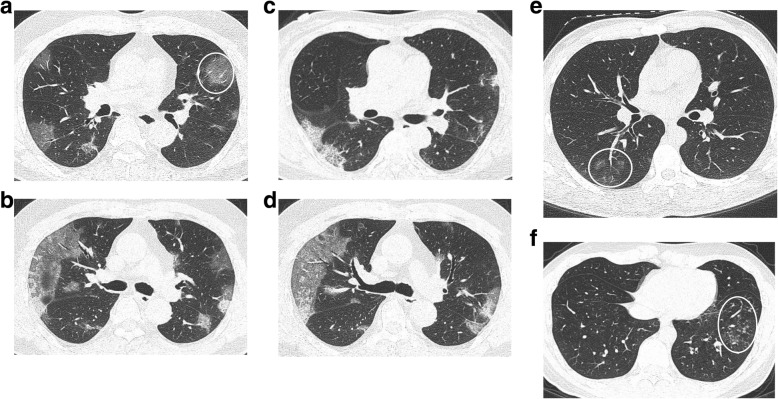
Methods: Thirty confirmed cases of COVID-19 and forty-three cases of other aetiology or clinically confirmed non-COVID-19 in a general hospital were included. The clinical data including age, sex, exposure history, laboratory parameters and aetiological diagnosis of all patients were collected. Seven positive signs (posterior part/lower lobe predilection, bilateral involvement, rounded GGO, subpleural bandlike GGO, crazy-paving pattern, peripheral distribution, and GGO +/- consolidation) from significant COVID-19 CT image features and four negative signs (only one lobe involvement, only central distribution, tree-in-bud sign, and bronchial wall thickening) from other non-COVID-19 pneumonia were used. The scoring analysis of CT features was compared between the two groups (COVID-19 and non-COVID-19).
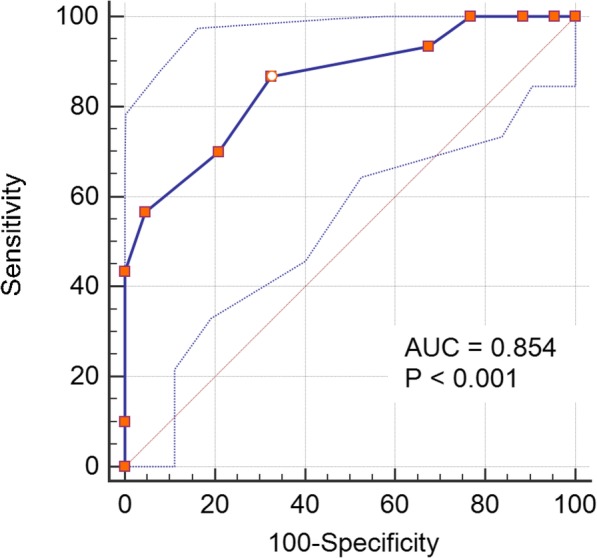
Results: Older age, symptoms of diarrhoea, exposure history related to Wuhan, and a lower white blood cell and lymphocyte count were significantly suggestive of COVID-19 rather than non-COVID-19 (p < 0.05). The receiver operating characteristic (ROC) curve of the combined CT image features analysis revealed that the area under the curve (AUC) of the scoring system was 0.854. These cut-off values yielded a sensitivity of 56.67% and a specificity of 95.35% for a score > 4, a sensitivity of 100% and a specificity of 23.26% for a score > 0, and a sensitivity of 86.67% and a specificity of 67.44% for a score > 2.
Conclusions: With a simple and practical scoring system based on CT imaging features, we can make a hierarchical diagnosis of COVID-19 and non-COVID-19 with different management suggestions.
Keywords: Coronavirus infections; Lung diseases; Pneumonia; Tomography, x-ray computed.
Conflict of interest statement
The authors declare that they have no competing interests.
Figures
References
-
- Authority MAaH. Guidlines for the diagnosis and treatment of coronavirus 2019 (COVID-19) infection by the national health commission (trial version 7). National Health Commision of the People’s Republic of China website. 2020. http://en.nhc.gov.cn/2020-03/29/c_78469.htm. Accessed 3 Mar 2020.
MeSH terms
Grants and funding
LinkOut - more resources
Full Text Sources
