Performance Characteristics of the Abbott Architect SARS-CoV-2 IgG Assay and Seroprevalence in Boise, Idaho
- PMID: 32381641
- PMCID: PMC7383515
- DOI: 10.1128/JCM.00941-20
Performance Characteristics of the Abbott Architect SARS-CoV-2 IgG Assay and Seroprevalence in Boise, Idaho
Abstract
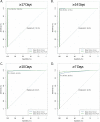
Coronavirus disease 2019 (COVID-19), the novel respiratory illness caused by severe acute respiratory syndrome coronavirus 2 (SARS-CoV-2), is associated with severe morbidity and mortality. The rollout of diagnostic testing in the United States was slow, leading to numerous cases that were not tested for SARS-CoV-2 in February and March 2020 and necessitating the use of serological testing to determine past infections. Here, we evaluated the Abbott SARS-CoV-2 IgG test for detection of anti-SARS-CoV-2 IgG antibodies by testing 3 distinct patient populations. We tested 1,020 serum specimens collected prior to SARS-CoV-2 circulation in the United States and found one false positive, indicating a specificity of 99.90%. We tested 125 patients who tested reverse transcription-PCR (RT-PCR) positive for SARS-CoV-2 for whom 689 excess serum specimens were available and found that sensitivity reached 100% at day 17 after symptom onset and day 13 after PCR positivity. Alternative index value thresholds for positivity resulted in 100% sensitivity and 100% specificity in this cohort. We tested specimens from 4,856 individuals from Boise, ID, collected over 1 week in April 2020 as part of the Crush the Curve initiative and detected 87 positives for a positivity rate of 1.79%. These data demonstrate excellent analytical performance of the Abbott SARS-CoV-2 IgG test as well as the limited circulation of the virus in the western United States. We expect that the availability of high-quality serological testing will be a key tool in the fight against SARS-CoV-2.
Keywords: Abbott; COVID; COVID-19; Idaho; SARS; SARS-CoV-2; coronavirus; serology.
Copyright © 2020 Bryan et al.
Figures


References
-
- Zhu N, China Novel Coronavirus Investigating and Research Team, Zhang D, Wang W, Li X, Yang B, Song J, Zhao X, Huang B, Shi W, Lu R, Niu P, Zhan F, Ma X, Wang D, Xu W, Wu G, Gao GF, Tan W. 2020. A novel coronavirus from patients with pneumonia in China, 2019. N Engl J Med 382:727–733. doi: 10.1056/NEJMoa2001017. - DOI - PMC - PubMed
-
- Yang X, Yu Y, Xu J, Shu H, Xia J, Liu H, Wu Y, Zhang L, Yu Z, Fang M, Yu T, Wang Y, Pan S, Zou X, Yuan S, Shang Y. 2020. Clinical course and outcomes of critically ill patients with SARS-CoV-2 pneumonia in Wuhan, China: a single-centered, retrospective, observational study. Lancet Respir Med 8:475–481. doi: 10.1016/S2213-2600(20)30079-5. - DOI - PMC - PubMed
Publication types
MeSH terms
Substances
LinkOut - more resources
Full Text Sources
Other Literature Sources
Medical
Miscellaneous

