. 2020 Aug;69(8):1692-1707.
doi: 10.2337/db19-0725. Epub 2020 May 7.

Dextran Sulfate Protects Pancreatic β-Cells, Reduces Autoimmunity, and Ameliorates Type 1 Diabetes

Affiliations

Dextran Sulfate Protects Pancreatic β-Cells, Reduces Autoimmunity, and Ameliorates Type 1 Diabetes

Geming Lu et al. Diabetes. 2020 Aug.

Abstract

A failure in self-tolerance leads to autoimmune destruction of pancreatic β-cells and type 1 diabetes (T1D). Low-molecular-weight dextran sulfate (DS) is a sulfated semisynthetic polysaccharide with demonstrated cytoprotective and immunomodulatory properties in vitro. However, whether DS can protect pancreatic β-cells, reduce autoimmunity, and ameliorate T1D is unknown. In this study, we report that DS, but not dextran, protects human β-cells against cytokine-mediated cytotoxicity in vitro. DS also protects mitochondrial function and glucose-stimulated insulin secretion and reduces chemokine expression in human islets in a proinflammatory environment. Interestingly, daily treatment with DS significantly reduces diabetes incidence in prediabetic NOD mice and, most importantly, reverses diabetes in early-onset diabetic NOD mice. DS decreases β-cell death, enhances islet heparan sulfate (HS)/HS proteoglycan expression, and preserves β-cell mass and plasma insulin in these mice. DS administration also increases the expression of the inhibitory costimulatory molecule programmed death-1 (PD-1) in T cells, reduces interferon-γ+CD4+ and CD8+ T cells, and enhances the number of FoxP3+ cells. Collectively, these studies demonstrate that the action of one single molecule, DS, on β-cell protection, extracellular matrix preservation, and immunomodulation can reverse diabetes in NOD mice, highlighting its therapeutic potential for the treatment of T1D.


Figures

Figure 1
Figure 1
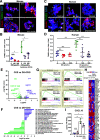
Protective effect of DS on cytokine-induced β-cell death and inflammatory and chemokine gene expression. A: Representative photomicrographs of dispersed mouse islet cells treated with cytokines (CKS) and/or DS for 24 h and stained for DAPI (blue), insulin (red), and TUNEL (green). Arrows represent TUNEL+ β-cells. B: Quantification of TUNEL+ β-cells in mouse islet cells treated with 100 and 500 µmol/L DS and/or cytokines (100 units/mL IL-1β, 1,000 units/mL TNF-α, and 1,000 units/mL IFN-γ) for 24 h. Values are mean ± SEM of three different experiments in triplicate. *P < 0.05 by one-way ANOVA with Tukey multiple-comparison test. C: Representative photomicrographs of dispersed human islet cells treated with cytokines and/or DS for 24 h and stained for DAPI (blue), insulin (red), and TUNEL (green). Arrows represent TUNEL+ β-cells. D: Quantification of TUNEL+ β-cells in six independent experiments in triplicate with human islet cells treated with DS and/or cytokines as above for 24 h. Values are mean ± SEM of six different human islet preparations in triplicate. **P < 0.01, ***P < 0.001 by one-way ANOVA with Tukey multiple-comparison test. E: Volcano plot of human islets treated with DS plus cytokines (DS+CKS) as compared with cytokines alone, with genes that are significantly (P < 0.05) upregulated more than twofold (in purple) or downregulated by >50% (in green). F: Gene ontology (GO) analysis shows significant changes in mitochondrial bioenergetics, cell death, and inflammation processes. G: GSEA of differentially expressed genes shows a decrease induced by DS in the enrichment of genes involved in inflammation response, apoptosis, and TNF-α and IFN-γ signaling in human islets treated with cytokines. H: RNA-sequencing data demonstrating levels of several cytokines, chemokines, and chemokine receptors in human islets treated with cytokines or with cytokines and 100 µmol/L DS (CKS+DS100). Values were calculated from three different experiments with three different human islet preparations. I: Quantification of CXCL10 levels in medium from human islets treated with cytokines and/or 100 µmol/L DS for 24 h. Values are normalized per number of islets and are means ± SEM of three different experiments performed with three different human islet preparations. *P < 0.05, **P < 0.01 by one-way ANOVA with Tukey multiple-comparison test. Scale bars, 10 μm. FC, fold change; FDR, false discovery rate; Ins, insulin; NES, normalized enrichment score.
Figure 2
Figure 2
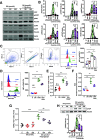
DS reduces proinflammatory- and stress-induced cell death pathways in human islets. Representative Western blots (A) and quantification (B) of Jak2, pStat1, pJNK, p-p65, p-p38, iNOS, and housekeeping protein α-tubulin in human islets exposed for 24 h to the cocktail of proinflammatory cytokines (CKS) and/or increasing DS concentrations. Values are means ± SEM of four independent human islet preparations. *P < 0.05, **P < 0.01. C: Representative flow cytometry plots and quantification of pSTAT1 in human β-cells (live C-peptide+ cells) after incubation of human islets with cytokines and/or 100 µmol/L DS. Values are means ± SEM of three experiments. *P < 0.05, ****P < 0.0001. D: Representative experiment on the left and quantification on the right of intracellular NO levels measured by incubation of human islets with the cytokine cocktail as above and 100 μmol/L DS with 4-amino-5-methylamino-2′,7′-difluorofluorescein (DAF-FM) diacetate, a cell-permeable fluorescent probe for the detection of NO. Values are means ± SEM of three independent human islet preparations. *P < 0.05, **P < 0.01. E: Quantification of TUNEL+ β-cells in four independent experiments in triplicate with human islet cells treated with DS and/or 40 µmol/L SNAP for 24 h. *P < 0.05, **P < 0.01, ***P < 0.001. F: Quantification of intracellular ROS levels in human islets treated with the cytokine cocktail and/or 100 µmol/L DS for 24 h. Values are means ± SEM of three independent human islet preparations. *P < 0.05, **P < 0.01. G: Quantification of the percentage of TUNEL+ β-cells in human islet cells treated with DS and 500 nmol/L thapsigargin for 24 h. Values are means ± SEM of four independent human islet preparations. *P < 0.05, **P < 0.01, ***P < 0.001. H (top): Representative Western blot of CHOP expression in human islets exposed for 24 h to 500 nmol/L thapsigargin and increasing DS concentrations. H (bottom): Quantification of CHOP expression in three independent experiments. Individual values and means ± SEM are represented for every experimental group. *P < 0.05. Statistical analysis of all of the data was performed by one-way ANOVA with Tukey multiple-comparison test. CON, control; DCFDA, 2′,7′-dichlorodihydrofluorescein diacetate; FSC-A, forward scatter area; FSC-H, forward scatter height; Ins, insulin; MFI, mean fluorescence intensity; SSC-A, side scatter area.
Figure 3
Figure 3
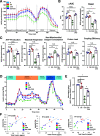
DS improves mitochondrial bioenergetics and GSIS in human islets treated with cytokines. A: Seahorse analysis of oxidative phosphorylation. OCRs of human islets treated with 100 µmol/L DS and/or the cytokine cocktail (CKS) for 24 h were measured in real time under basal conditions and in response to glucose or mitochondrial inhibitors and normalized to insulin content. B: Average of basal OCR for the first 30 min and area under the curve (AUC) for the whole experiment performed as described above. C: Mitochondrial functions (ATP production, maximal respiration, proton leak, nonmitochondrial oxygen consumption, and coupling efficiency [%]) were analyzed as indicated by the manufacturer. Mean ± SEM of three different experiments with three different human islet preparations. *P < 0.05, **P < 0.01. D: Effects of cytokines and DS on GSIS in perifused human islets. Representative experiment depicting the effect of 24-h incubation with the cytokine cocktail indicated above with or without DS in human islet GSIS. Islets were perifused in parallel microchambers with Krebs-Ringer buffer medium containing 2 or 20 mmol/L glucose for the duration depicted in the graph to examine the effects of cytokines and DS on GSIS. All channels were challenged by 30 mmol/L KCl for 10 min to confirm the viability of the islets. Secretion was normalized by DNA content. E: Quantification of the average of stimulation index (secretion at 20 mmol/L/secretion at 2 mmol/L) of human islets treated as indicated in A. Mean ± SEM of three different experiments with three different human islet preparations. *P < 0.05. F: Correlation between gene expression analysis of PDX1, MAFA, and PAX6 by real-time PCR and insulin content in human islets treated with cytokines and 100 µmol/L DS. Dots represent individual human islet preparations: blue, vehicle-treated; green, cytokine-treated; red, DS-treated; and purple, DS+CKS-treated islets. Statistical analysis of all of the data was performed by one-way ANOVA with Tukey multiple-comparison test. FCCP, carbonyl cyanide-4-(trifluoromethoxy) phenylhydrazone.
Figure 4
Figure 4
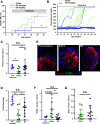
DS treatment of prediabetic NOD female mice. A: Percentage of diabetic mice (blood glucose >250 mg/dL) during 11 weeks of continuous treatment (gray-shaded area) with 10 mg/kg DS (DS10; n = 10), 2 mg/kg DS (n = 10), or saline (n = 10). B: Individual weekly blood glucose levels of the mice treated with DS10 or saline for 11 weeks. C: Plasma insulin levels of prediabetic 10-week-old mice (n = 4) and saline- or DS10-treated mice at the end of the 11-week treatment. D: Corresponding β-cell mass of mice in which plasma insulin levels were analyzed in C. E: Representative images of TUNEL (green), DAPI (blue), and insulin (red) staining performed in pancreatic sections of prediabetic and saline- and DS10-treated mice. F: Quantification of the percentage of TUNEL+ β-cells of prediabetic 10-week-old mice and saline- or DS10-treated mice at the end of the 11-week treatment. G: Percentage of BrdU+ β-cells in pancreatic sections of mice treated for 11 weeks with saline or DS10. Individual values and means ± SEM are represented for every experimental group. *P < 0.05, **P < 0.01 by log-rank (Mantel-Cox) or Gehan-Breslow-Wilcoxon tests for A and one-way ANOVA with Tukey multiple-comparison test for B–G. Scale bars, 10 μm.
Figure 5
Figure 5
DS treatment of diabetic NOD female mice. A: Percentage of diabetic mice (blood glucose >250 mg/dL) during 10 weeks of therapeutic treatment with DS (n = 10) or saline (n = 10). When treatment was initiated (time 0), all of the mice had levels >250 mg/dL. B: Individual weekly blood glucose levels of mice treated with saline or DS with a blood glucose level at onset between 250 and 350 mg/dL. Initiation of treatment is marked with a vertical dotted line, and blood glucose of 250 mg/dL is marked with a horizontal dashed line. C: Plasma insulin levels at the end of treatment in mice treated with saline or DS. D: β-Cell mass determined in pancreatic sections of mice treated with saline or DS. Individual values and means ± SEM are represented for every experimental group. *P < 0.05 by log-rank (Mantel-Cox) or Gehan-Breslow-Wilcoxon tests for A and two-group comparison using the two-tailed unpaired Student t test for B–F. Representative images of immunostaining for insulin (red) and DAPI (blue) (E), and insulin (green), CD3 (white), CD45R/B220 (purple), and DAPI (blue) (F) of saline- and DS-treated mice. Scale bars, 10 μm.
Figure 6
Figure 6
DS effects on immune cell populations in vivo. mRNA expression by real-time PCR of multiple genes involved in immune activation and regulation in spleen cells (A) and Il-1β, Tnf-α, Cxcl9, and Cxcl10 genes in whole pancreas (B) from prediabetic NOD mice treated for 4 weeks with saline (n = 5) or 10 mg/kg DS (n = 5). Flow cytometry analysis of the percentage of PD-1+CD4+ and PD-1+CD8+ cells (C) and IFN-γ+CD4+ and IFN-γ+CD8+ cells (D) from single-cell suspensions of the spleen (SPL) and PLN from prediabetic NOD mice treated for 4 weeks with saline (n = 5) or DS (n = 5) and stimulated in vitro with anti-CD3 and anti-CD28. E: Effect of blocking PD-L1 in prediabetic NOD female mice treated with DS. Percentage of diabetic mice after i.p. injection of a blocking anti–PD-L1 antibody in mice treated with saline (Sal; n = 5) or DS (n = 5). Another set of mice was only treated with saline (n = 5) or DS (n = 5). F: Percentage of FoxP3+CD25+CD4+ cells in the immune compartments of saline- or DS-treated mice indicated in C and D. Individual values and means ± SEM are represented for every experimental group. *P < 0.05, **P < 0.01, ***P < 0.001 by two-group comparison using the two-tailed unpaired Student t test.

Similar articles

Cited by

References

    1. Coppieters KT, von Herrath MG, Homann D. Autoimmunity and autoimmune diseases. In Fundamental Immunology. 7th ed. Paul W, Ed. Philadelphia, Lippincott Williams & Wilkins, 2013
    1. Atkinson MA, Eisenbarth GS, Michels AW. Type 1 diabetes. Lancet 2014;383:69–82 - PMC - PubMed
    1. Haskins K. Pathogenic T-cell clones in autoimmune diabetes: more lessons from the NOD mouse. Adv Immunol 2005;87:123–162 - PubMed
    1. Herold KC, Vignali DA, Cooke A, Bluestone JA. Type 1 diabetes: translating mechanistic observations into effective clinical outcomes. Nat Rev Immunol 2013;13:243–256 - PMC - PubMed
    1. Roep BO, Tree TIM. Immune modulation in humans: implications for type 1 diabetes mellitus. Nat Rev Endocrinol 2014;10:229–242 - PubMed

Publication types

MeSH terms