. 2020 May 7;11(5):325.
doi: 10.1038/s41419-020-2522-0.

PKCθ-JunB axis via upregulation of VEGFR3 expression mediates hypoxia-induced pathological retinal neovascularization

Affiliations

PKCθ-JunB axis via upregulation of VEGFR3 expression mediates hypoxia-induced pathological retinal neovascularization

Raj Kumar et al. Cell Death Dis. .

Abstract

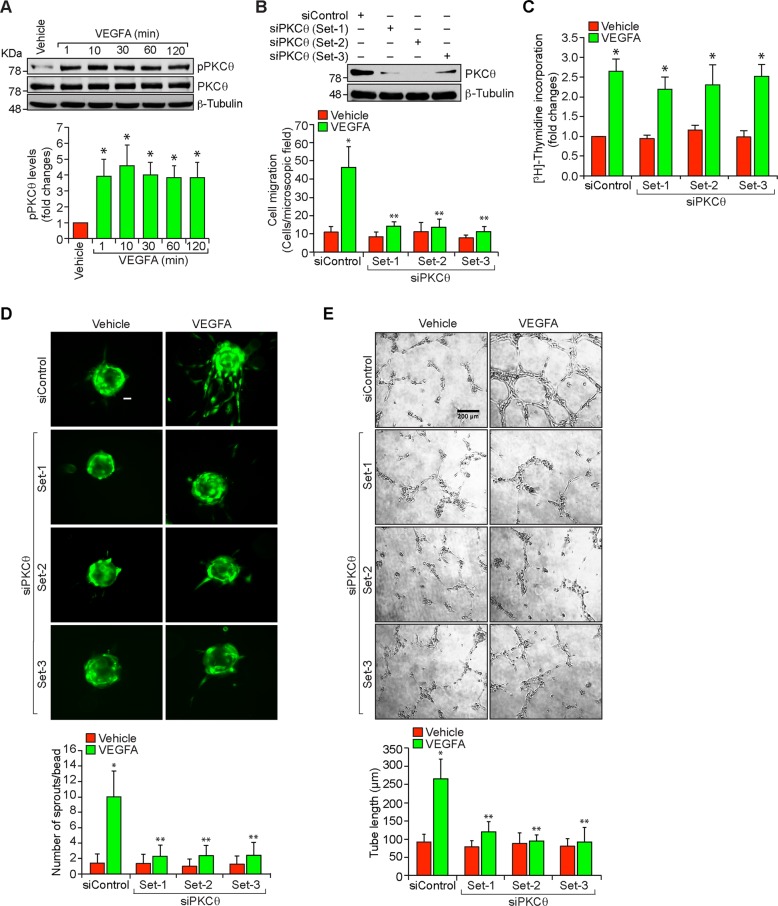
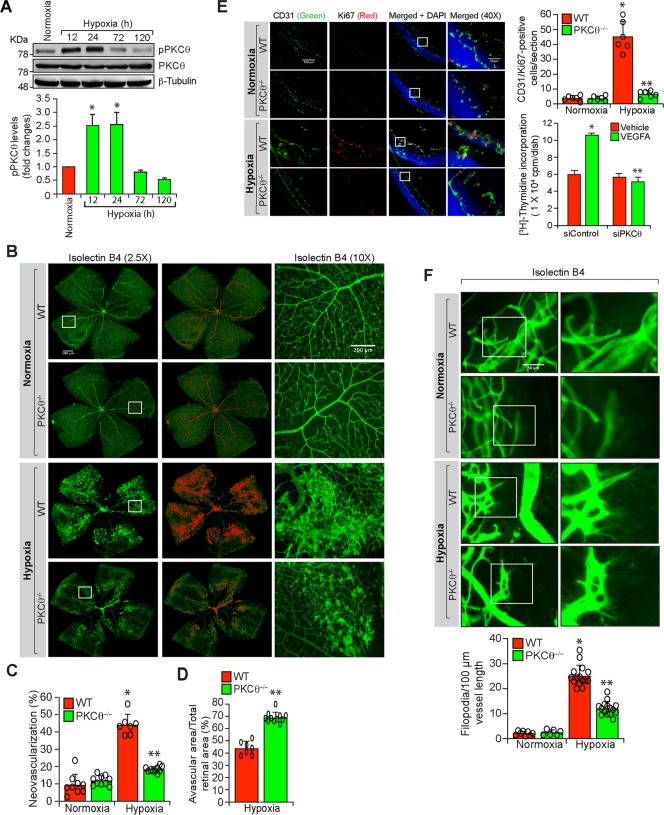
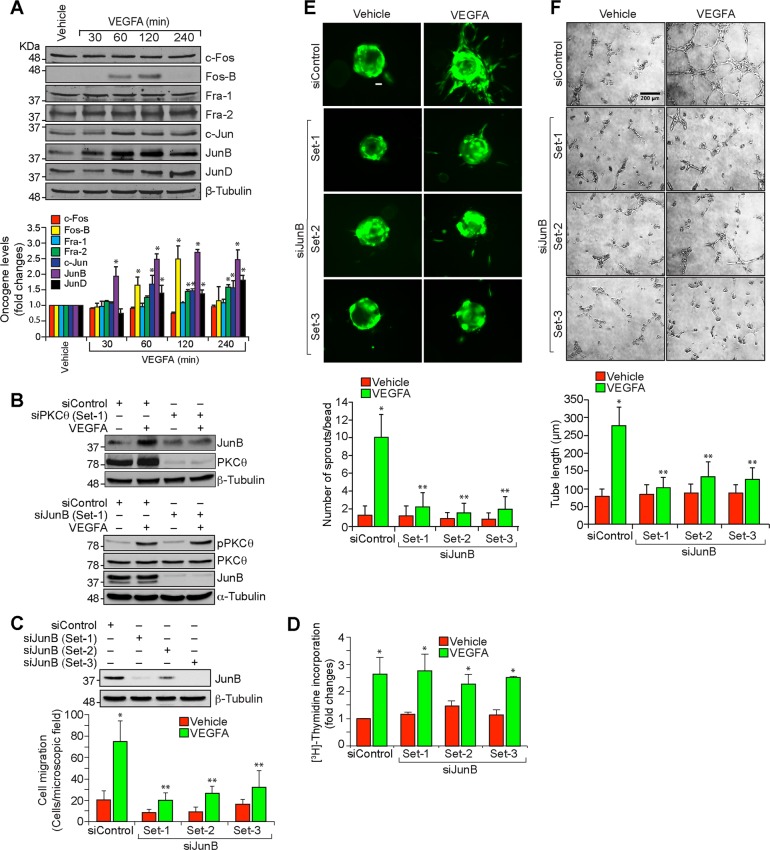
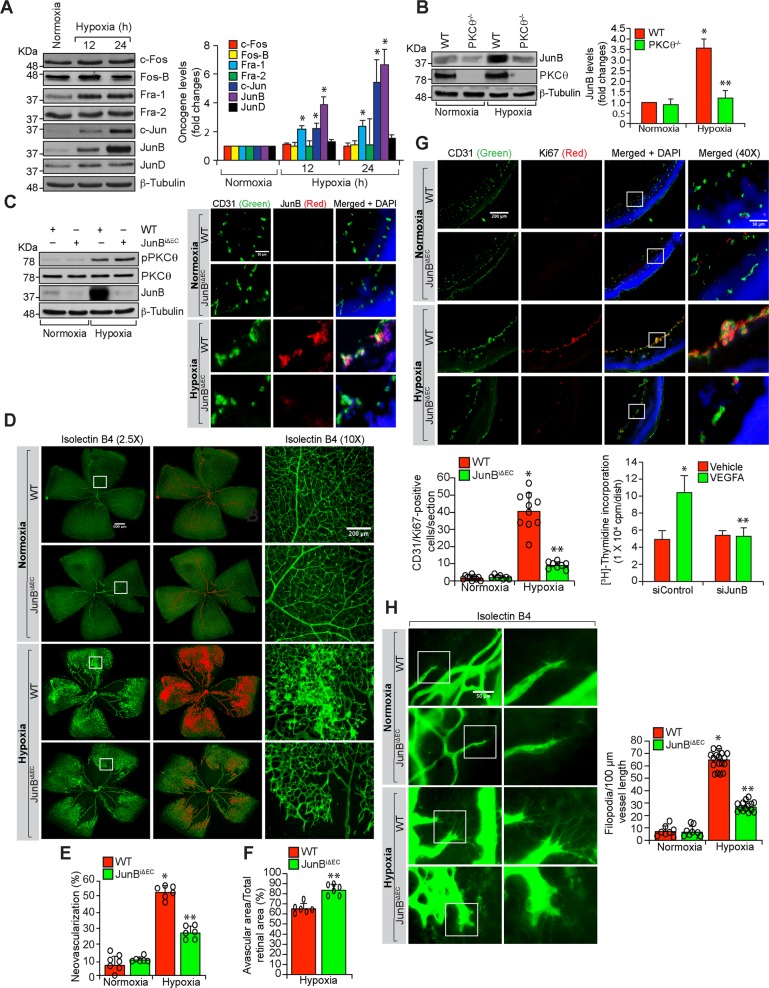
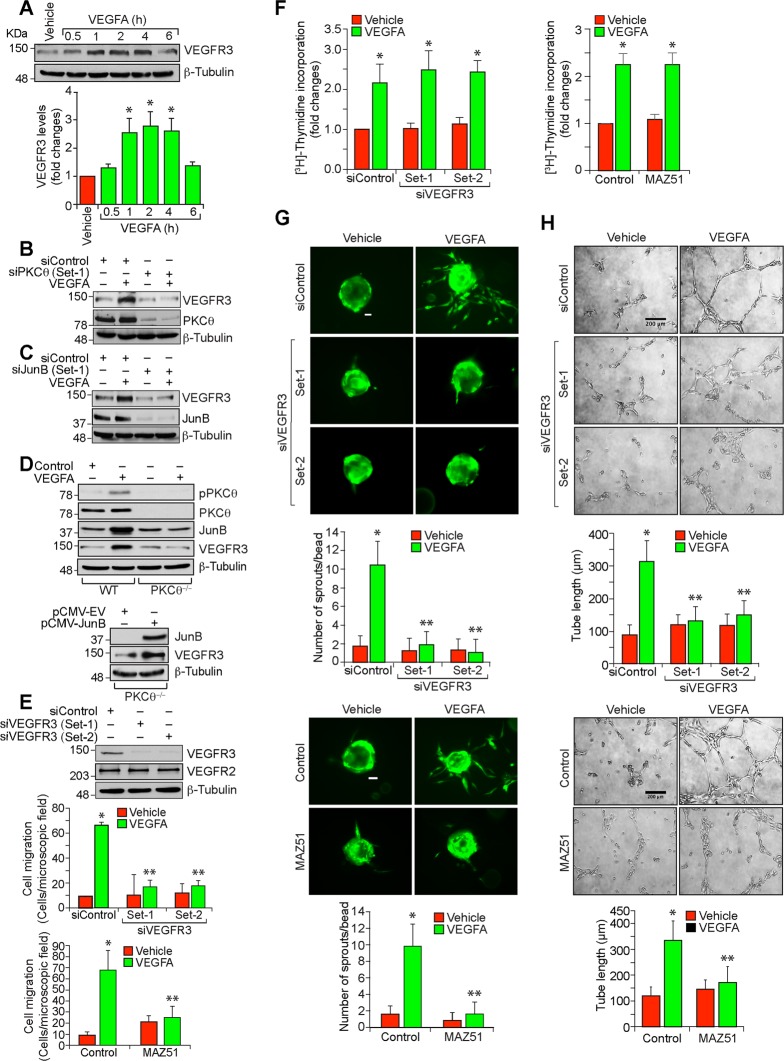
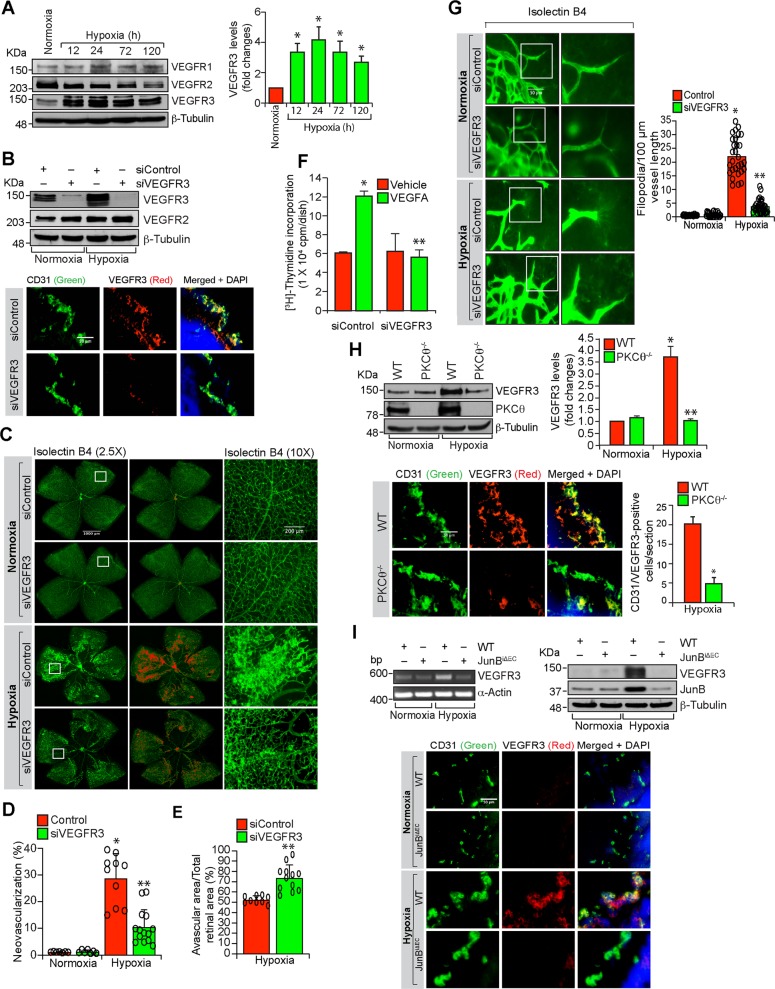
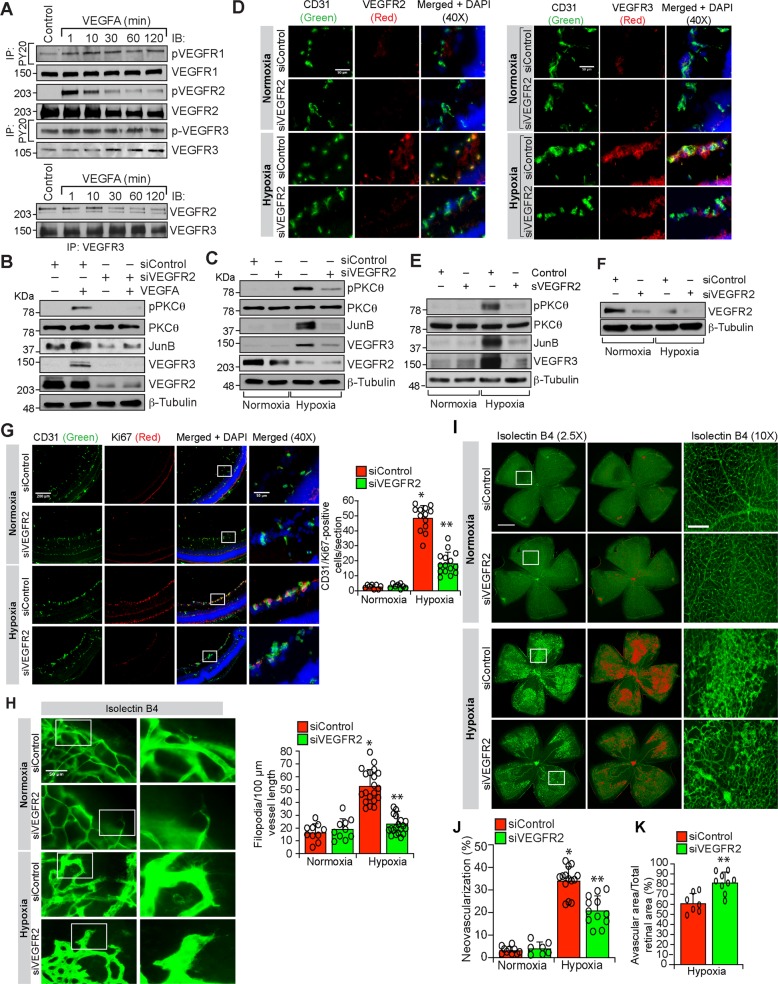
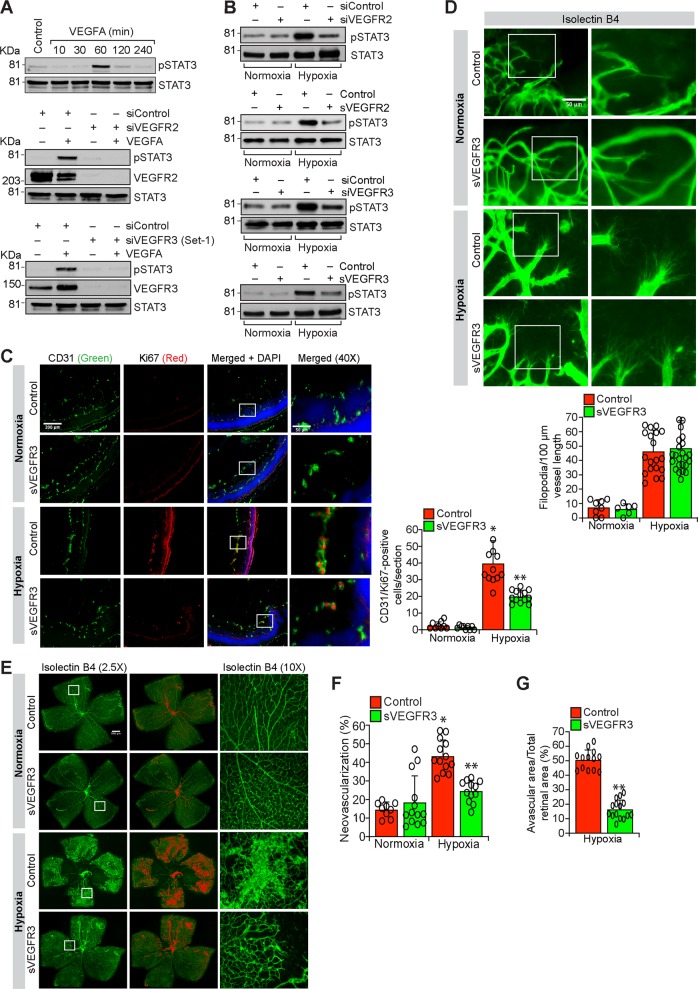
Pathological retinal neovascularization is the most common cause of vision loss. PKCθ has been shown to play a role in type 2 diabetes, which is linked to retinal neovascularization. Based on these clues, we have studied the role of PKCθ and its downstream target genes JunB and VEGFR3 in retinal neovascularization using global and tissue-specific knockout mouse models along with molecular biological approaches. Here, we show that vascular endothelial growth factor A (VEGFA) induces PKCθ phosphorylation in human retinal microvascular endothelial cells (HRMVECs) and downregulation of its levels attenuates VEGFA-induced HRMVECs migration, sprouting and tube formation. Furthermore, the whole body deletion of PKCθ or EC-specific deletion of its target gene JunB inhibited hypoxia-induced retinal EC proliferation, tip cell formation and neovascularization. VEGFA also induced VEGFR3 expression via JunB downstream to PKCθ in the regulation of HRMVEC migration, sprouting, and tube formation in vitro and OIR-induced retinal EC proliferation, tip cell formation and neovascularization in vivo. In addition, VEGFA-induced VEGFR3 expression requires VEGFR2 activation upstream to PKCθ-JunB axis both in vitro and in vivo. Depletion of VEGFR2 or VEGFR3 levels attenuated VEGFA-induced HRMVEC migration, sprouting and tube formation in vitro and retinal neovascularization in vivo and it appears that these events were dependent on STAT3 activation. Furthermore, the observations using soluble VEGFR3 indicate that VEGFR3 mediates its effects on retinal neovascularization in a ligand dependent and independent manner downstream to VEGFR2. Together, these observations suggest that PKCθ-dependent JunB-mediated VEGFR3 expression targeting STAT3 activation is required for VEGFA/VEGFR2-induced retinal neovascularization.


Conflict of interest statement

The authors declare that they have no conflict of interest.

Figures

Fig. 1
Fig. 1. PKCθ mediates VEGFA-induced angiogenic events in HRMVECs.
a Western blot analysis of control and various time periods of VEGFA (40 ng/ml)-treated HRMVECs for phosphorylated PKCθ levels. The blot was normalized to total PKCθ levels and β-tubulin. b Upper panel: Western blot analysis of PKCθ and β-tubulin levels to show the specificity and efficacy of siControl and siPKCθ (100 nM) in HRMVECs. Bottom panel: The effect of siControl and siPKCθ on VEGFA (40 ng/ml)-induced HRMVEC migration using Boyden chamber assay. ce All the conditions were same as in (b) except that cells were treated with and without VEGFA (40 ng/ml) and DNA synthesis (c), sprouting (d) or tube formation (e) were measured. The bar graphs represent quantitative analysis of three independent experiments. The values are presented as mean ± SD. *p < 0.01 vs vehicle control or siControl; **p < 0.01 vs siControl + VEGFA. Scale bars in (d) and (e) are 50 and 200 μm, respectively.
Fig. 2
Fig. 2. PKCθ mediates hypoxia-induced retinal neovascularization.
a Western blot analysis of retinal extracts of control and the indicated time periods of hypoxic C57BL/6 (WT) mice pups for phosphorylated PKCθ levels. The blot was normalized to total PKCθ levels and β-tubulin. b Isolectin B4 staining of retinal flat mounts of normoxic and 5 days of hypoxic WT and PKCθ−/− mice pups. Retinal vascularization is shown in the first column at 2.5× magnification (scale bar, 500 μm). Neovascularization is highlighted in red in the second column. The third column shows the selected rectangular areas of the images in the first column at 10× magnification (scale bar, 200 μm). c,d Retinal neovascularization (c) and avascular area (d) were determined as described in “Materials and Methods.” e Left panel: Double immunofluorescence staining of retinal cross sections of normoxic and 3 days of hypoxic WT and PKCθ−/− mice pups for CD31 and Ki67. The extreme right column shows 40× magnification of the areas selected by rectangular boxes in the immediate left column images (scale bars in the far left and far right columns are 200 and 50 μm, respectively). Retinal EC proliferation was measured by counting CD31 and Ki67-positive cells that extended anterior to the inner limiting membrane in each section (n = 6 eyes, 3 sections/eye). Upper right panel: Quantitative analysis of CD31 and Ki67-positive cells. Bottom right panel: The effect of siControl and siPKCθ on VEGFA (40 ng/ml)-induced DNA synthesis in MRMVECs. f Upper panel: All the conditions were the same as in (b) except that the retinal flat mounts were examined for EC filopodia at 40× magnification (scale bar, 50 μm). Bottom panel: Quantitative analysis of number of filopodia/unit vessel length. The bar graphs represent quantitative analysis of three blots or 6 retinas. The values are presented as mean ± SD. *p < 0.01 vs normoxia or siControl; **p < 0.01 vs WT hypoxia or siControl + VEGFA.
Fig. 3
Fig. 3. JunB mediates VEGFA-induced angiogenic events in HRMVECs.
a Western blot analysis of control and various time periods of VEGFA (40 ng/ml)-treated HRMVECs for the indicated proteins. b The effect of siControl, siPKCθ and siJunB (100 nM) on VEGFA (40 ng/ml)-induced JunB expression at 2 h and PKCθ phosphorylation at 10 min. The blot was sequentially reprobed for PKCθ, JunB, β-tubulin and α-tubulin levels to show the specificity and efficacy of the siRNA on its target and off target molecules. c Upper panel: Western blot analysis of JunB and β-tubulin levels to show the specificity and efficacy of siControl and siJunB (100 nM) in HRMVECs. Bottom panel: The effect of siControl and siJunB on VEGFA (40 ng/ml)-induced HRMVEC migration. df All the conditions were same as in (c) except that cells were treated with and without VEGFA (40 ng/ml) and DNA synthesis (d), sprouting (e) or tube formation (f) were measured. The bar graphs represent quantitative analysis of three independent experiments. The values are presented as mean ± SD. *p < 0.01 vs vehicle control or siControl; **p < 0.01 vs siControl + VEGFA. Scale bars in (e) and (f) are 50 and 200 μm, respectively.
Fig. 4
Fig. 4. Endothelial-specific deletion of JunB negates hypoxia-induced retinal neovascularization.
a Western blot analysis of retinal extracts of normoxic and 12 h and 24 h of hypoxic WT mice pups for the indicated proteins. b Western blot analysis of retinal extracts of normoxic and 24 h of hypoxic WT and PKCθ−/− mice pups for JunB levels. The blot was subsequently reprobed for PKCθ and β-tubulin levels. c Left panel: Normoxic or hyperoxic JunBflox/flox:Cdh5-CreERT2 mice pups at P10 and P11 were injected with 100 μg tamoxifen intraperitoneally, and normoxic and 24 h of hypoxic (P13) pup retinal extracts were prepared and analyzed by western blotting for phospho and total PKCθ, JunB and β-tubulin levels. Right panel: All the conditions were the same as in the left panel except that eyes from normoxic and 72 h of hypoxic pups were enucleated, fixed, sections were made and co-immunostained for CD31 and JunB. d All the conditions are same as in right (c) except that eyes were enucleated from normoxic and 120 h of hypoxic pups, fixed, retinas isolated, stained with isolectin B4, flat mounts were made and retinal vascularization and neovascularization were measured. Retinal vascularization is sown in the first column at 2.5× magnification (scale bar 500 μm) and neovascularization is highlighted in red in the second column. The third column shows the selected rectangular areas of the images in the first column at 10× magnification (scale bar, 200 μm). e,f Retinal neovascularization (e) and avascular area (f) were determined as described in “Materials and Methods”. g Upper panel: All the conditions were the same as in left (c) except that sections were co-immunostained for CD31 and Ki67. The extreme right column shows 40× magnification of the areas selected by rectangular boxes in the immediate left column images (scale bars in the far left and far right columns are 200 and 50 μm, respectively). Retinal EC proliferation was measured by counting CD31 and Ki67-positive cells from the inner limiting membrane to the extended region in each section (n = 6 eyes, 3 sections/eye). Bottom left panel: Quantitative analysis of CD31 and Ki67-positive cells. Bottom right panel: The effect of siControl and siJunB on VEGFA (40 ng/ml)-induced DNA synthesis in MRMVECs. h All the conditions were the same as in (d) except that the retinal flat mounts were examined for filopodia at 40× magnification (scale bar, 50 μm). The bar graphs represent quantitative analysis of three blots or 7 retinas. The values are presented as mean ± SD. *p < 0.01 vs normoxia or WT normoxia or siControl; **p < 0.01 vs WT hypoxia, siControl + hypoxia or siControl + VEGFA.
Fig. 5
Fig. 5. VEGFR3 mediates VEGFA-induced angiogenic events in HRMVECs.
a Western blot analysis of control and the indicated time periods of VEGFA (40 ng/ml)-treated HRMVECs for VEGFR3 and β-tubulin levels. b,c The effect of siControl, siPKCθ and siJunB (100 nM) on VEGFA (40 ng/ml)-induced (2 h) VEGFR3 levels. The blots were sequentially reprobed for PKCθ and β-tubulin levels or JunB and β-tubulin levels to show the specificity and efficacy of siRNA on its target and off target molecules. d Upper panel: Retinal ECs were isolated from WT and PKCθ−/− mice and tested for the effect of VEGFA on PKCθ phosphorylation and JunB and VEGFR3 expression. Lower panel: Retinal ECs from PKCθ−/− mice were transfected with empty vector or JunB expression vector and two days later cell extracts were prepared and analyzed by western blotting for JunB, VEGFR3 and β-tubulin levels. e Upper panel: western blot analysis of VEGFR2, VEGFR3 and β-tubulin levels to show the specificity and efficacy of siControl and siVEGFR3 (100 nM) in HRMVECs. Bottom panel: The effect of siControl, siVEGFR3 and MAZ51 (5 μM) on VEGFA (40 ng/ml)-induced HRMVEC migration. fh All the conditions were same as in (e) except that cells were treated with and without VEGFA (40 ng/ml) and DNA synthesis (f), sprouting (g) or tube formation (h) were measured. The bar graphs represent quantitative analysis of three independent experiments. The values are presented as mean ± SD. *p < 0.01 vs vehicle control or siControl; **p < 0.01 vs siControl + VEGFA. Scale bars in (g) and (h) are 50 and 200 μm, respectively.
Fig. 6
Fig. 6. VEGFR3 mediates hypoxia-induced retinal neovascularization.
a Western blot analysis of retinal extracts of normoxic and the indicated time periods of hypoxic WT mice pups for VEGFR1, VEGFR2, VEGFR3 and β-tubulin levels. b Upper panel: Mice pups were injected intravitreally with 1 μg/0.5 μl/eye of siControl or siVEGFR3 at P11 and P12 and at P13, retinal extracts were prepared and analyzed by western blotting for VEGFR2, VEGFR3 and β-tubulin levels. Bottom panel: All the conditions were the same as in upper panel except that pups were received siRNA at P11, P12 and P13 and at P15, eyes were enucleated, fixed, sections were made and immunostained for CD31 and VEGFR3. c All the conditions are same as in bottom (b) except that eyes were enucleated at P17, fixed, retinas were isolated, stained with isolectin B4 and flat mounts were made. Retinal vascularization is shown in the first column at 2.5× magnification (scale bar, 1000 μm). Neovascularization is highlighted in red in the second column. The third column shows the selected rectangular areas of the images in the first column at 10× magnification (scale bar, 200 μm). d,e. Retinal neovascularization (d) and avascular area (e) were determined as described in “Materials and Methods.” f The effect of siControl and siVEGFR3 on VEGFA (40 ng/ml)-induced DNA synthesis in MRMVECs. g Left panel: All the conditions were the same as in (c) except that the retinal flat mounts were examined for filopodia at 40× magnification (scale bar, 50 μm). Right panel: Quantitative analysis of number of filopodia/unit vessel length. h Upper left panel: western blot analysis of normoxic and 24 h of hypoxic retina of WT and PKCθ−/− mice pups for VEGFR3, PKCθ and β-tubulin levels. Bottom left panel: All the conditions were the same as in upper panel except that eyes were enucleated at 3 days of hypoxia (P15), fixed, sections were made and immunostained for CD31 and VEGFR3. Upper and bottom right panels: Quantitative analysis of VEGFR3 levels and CD31 and VEGFR3-positive cells, respectively. i Upper left panel: Normoxic or hyperoxic JunBflox/flox:Cdh5-CreERT2 mice pups at P10 and P11 were injected with 100 μg tamoxifen intraperitoneally, and RNA was isolated from normoxic and 24 h of hypoxic (P13) pup retinas and analyzed by RT-PCR for VEGFR3 and α-actin mRNA levels. Upper right panel: All the conditions were the same as in the left panel except that retinal extracts were prepared and analyzed for western blotting for VEGFR3, JunB and β-tubulin levels. Lower panel: All the conditions were the same as in the upper panels except that eyes were enucleated, fixed, sections were made and co-immunostained for CD31 and VEGFR3. The bar graphs represent quantitative analysis of three blots or 7 retinas. The values are presented as mean ± SD. *p < 0.01 vs normoxia or WT + normoxia or siControl + normoxia; **p < 0.01 vs WT + hypoxia or siControl + hypoxia.
Fig. 7
Fig. 7. Depletion of VEGFR2 levels blunts retinal neovascularization.
a Upper panel: Equal amount of protein from control and the indicated time periods of VEGFA-treated HRMVECs were analyzed for phospho and total VEGFR1, 2 and 3 levels. Lower panel: The cell extracts were analyzed for VEGFR2 and VEGFR3 complex formation. b HRMVECs were transfected with siControl or siVEGFR2 (100 nM), quiesced, treated with and without VEGFA (40 ng/ml) for 10 min (for pPKCθ) or 120 min (for JunB and VEGFR3) and cell extracts were prepared and analyzed by western blotting for the indicated proteins. c Retinas from normoxic and 24 h (i.e., at P13) of hypoxic WT mice pups that received siControl or siVEGFR2 (1 μg/0.5 μl/eye) by intravitreal injections at P10 and P11 were isolated, extracts were prepared and analyzed by western blotting for the indicated proteins. d Eyes from normoxic and 72 h (i.e., at P15) of hypoxic WT mice pups that received siControl or siVEGFR2 (1 μg/0.5 μl/eye) by intravitreal injections at P11, P12 and P13 were enucleated, fixed, sections were made and coimmunostained for CD31 and VEGFR2 (left panel) and CD31 and VEGFR3 (right panel). e Eyes from normoxic and 24 h (i.e., at P13) of hypoxic WT mice pups that were injected intravitreally with vehicle or 0.05 μg/0.5 μl/eye of soluble VEGFR2 at P11 and P12 were enucleated, retinas were isolated, protein extracts were prepared and analyzed by western blotting for the indicated proteins using their specific antibodies. f Eyes from normoxic and 24 h of hypoxic mice pups that were injected intravitreally with siControl or siVEGFR2 (0.5 μg/0.5 μl/eye) at P11 and P12 were enucleated, retinas were isolated, protein extracts were prepared and analyzed by western blotting for VEGFR3 levels using its specific antibodies and the blot was normalized for β-tubulin. g All the conditions were the same as in (d) except that sections were coimmunostained for CD31 and Ki67. The bar graph shows quantification of proliferating ECs per section. h All the conditions were the same as in (d) except that eyes were enucleated at P17, fixed, retinas were isolated, stained with isolectin B4, flat mounts were made and examined for filopodia at 40× magnification (scale bar, 50 μm). Bar graph shows quantification of the number of filopodia/unit vessel length. i All the conditions were the same as in (h) except that the flat mounts were examined for retinal vascularization. Retinal vascularization is shown in the first column at 2.5× magnification (scale bar, 500 μm). Neovascularization is highlighted in red in the second column. The third column shows the selected rectangular areas of the images in the first column at 10× magnification (scale bar, 200 μm). j,k Retinal neovascularization (j) and avascular area (k) were determined as described in “Materials and Methods.” The values are presented as mean ± SD. *p < 0.01 vs normoxia; **p < 0.01 vs siControl + hypoxia.
Fig. 8
Fig. 8. VEGFR3 mediates retinal neovascularization in ligand dependent and independent manner.
a Upper panel: western blot analysis of control and the indicated time periods of VEGFA (40 ng/ml)-treated HRMVECs for phospho (Y705) and total STAT3 levels. Middle and bottom panels: The effect of siControl, siVEGFR2 and siVEGFR3 (100 nM) on VEGFA (40 ng/ml)-induced STAT3 phosphorylation. The blots were sequentially reprobed for total STAT3, VEGFR2 or VEGFR3 levels to show the loading control and the specificity and efficacy of siRNAs on their target molecules. b Upper two panels: Eyes from normoxic and 24 h (i.e., at P13) of hypoxic WT mice pups that were injected intravitreally with siControl, siVEGFR2 (0.5 μg/0.5 μl/eye) or sVEGFR2 (0.05 μg/0.5 μl/eye) at P11 and P12 were enucleated, retinas were isolated, protein extracts were prepared and analyzed by western blotting for phospho and total STAT3 levels using their specific antibodies. Lower two panels: Eyes from normoxic and 24 h (i.e., at P13) of hypoxic WT mice pups that were injected intravitreally with siControl, siVEGFR3 (0.5 μg/0.5 μl/eye) or sVEGFR3 (0.05 μg/0.5 μl/eye) at P11 and P12 were enucleated, retinas were isolated, protein extracts were prepared and analyzed by western blotting for phospho and total STAT3 levels using their specific antibodies. c Mice pups were injected intravitreally with vehicle or 0.05 μg/0.5 μl/eye of soluble VEGFR3 at P11, P12 and P13 and normoxic and 72 h of hypoxic eyes were enucleated, fixed, sections were made and coimmunostained for CD31 and Ki67. d All the conditions were the same as in (c) except that eyes were enucleated at 120 h of hypoxia (i.e., at P17), fixed, retinas were isolated, stained with isolectin B4, flat mounts were made and examined for filopodia at 40× magnification (scale bar, 50 μm). Bar graph shows quantitative analysis of the number of filopodia/unit vessel length. e All the conditions were the same as in (d) except that the flat mounts were examined for retinal vascularization. Retinal vascularization is shown in the first column at 2.5× magnification (scale bar, 500 μm). Neovascularization is highlighted in red in the second column. The third column shows the selected rectangular areas of the images in the first column at 10× magnification (scale bar, 200 μm). f,g Retinal neovascularization (f) and avascular area (g) were determined as described in “Materials and Methods.” The values are presented as mean±SD. *p < 0.01 vs normoxia; **p < 0.01 vs control + hypoxia.

Similar articles

Cited by

References

    1. Andreoli CM, Miller JW. Anti-vascular endothelial growth factor therapy for ocular neovascular disease. Curr. Opin. Ophthalmol. 2007;18:502–508. doi: 10.1097/ICU.0b013e3282f0ca54. - DOI - PubMed
    1. Chen J, Smith LE. Retinopathy of prematurity. Angiogenesis. 2007;10:133–140. doi: 10.1007/s10456-007-9066-0. - DOI - PubMed
    1. Ferrara N, Kerbel RS. Angiogenesis as a therapeutic target. Nature. 2005;438:967–974. doi: 10.1038/nature04483. - DOI - PubMed
    1. Hurwitz H, et al. Bevacizumab plus irinotecan, fluorouracil, and leucovorin for metastatic colorectal cancer. N. Engl. J. Med. 2004;350:2335–2342. doi: 10.1056/NEJMoa032691. - DOI - PubMed
    1. Gragoudas ES, et al. Pegaptanib for neovascular age-related macular degeneration. N. Engl. J. Med. 2004;351:2805–2816. doi: 10.1056/NEJMoa042760. - DOI - PubMed

Publication types

MeSH terms

Substances