. 2020 May 7;11(5):330.
doi: 10.1038/s41419-020-2548-3.

QKI deficiency leads to osteoporosis by promoting RANKL-induced osteoclastogenesis and disrupting bone metabolism

Affiliations

QKI deficiency leads to osteoporosis by promoting RANKL-induced osteoclastogenesis and disrupting bone metabolism

Tianshu Du et al. Cell Death Dis. .

Abstract

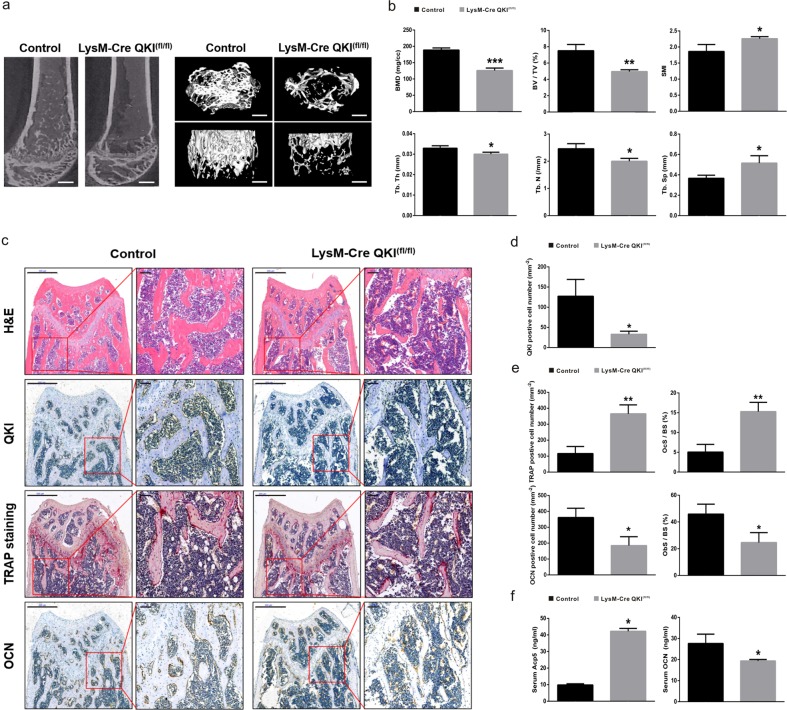
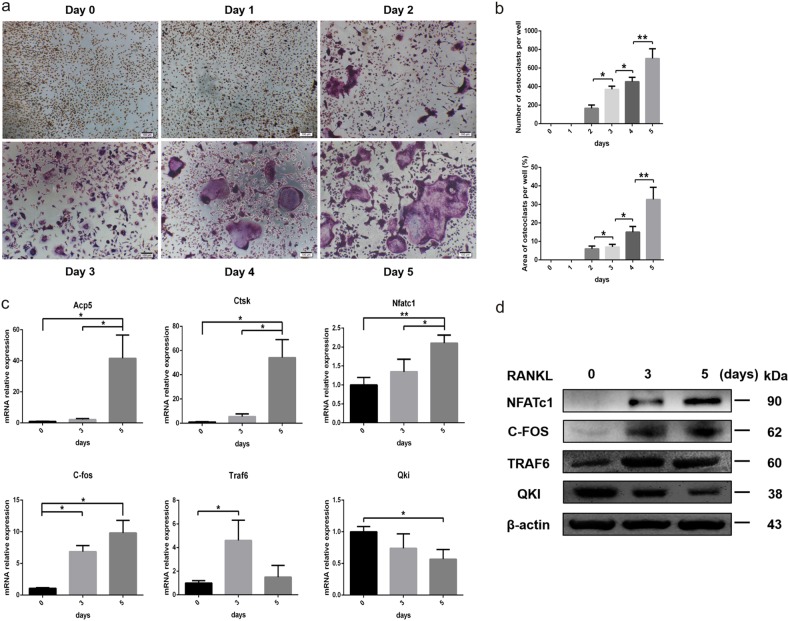
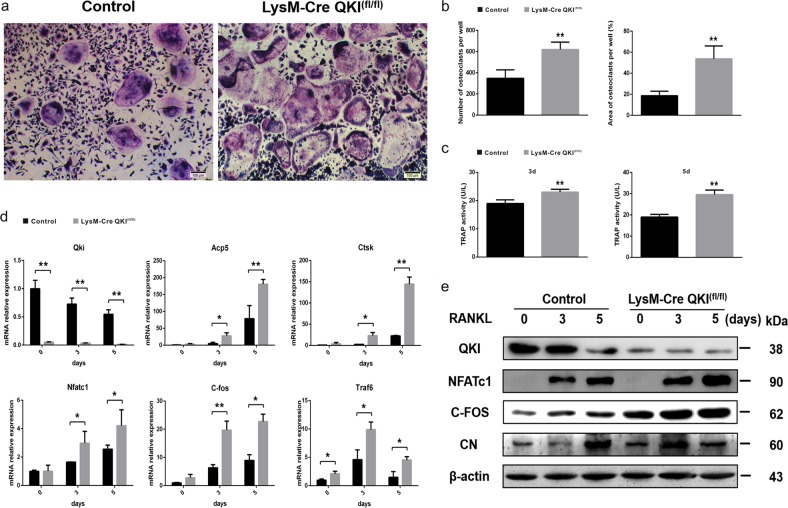
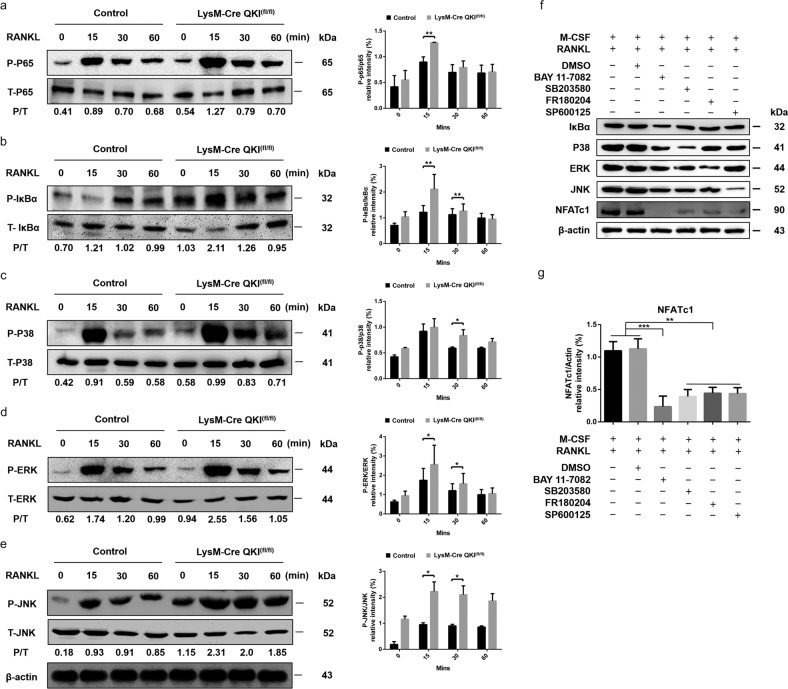
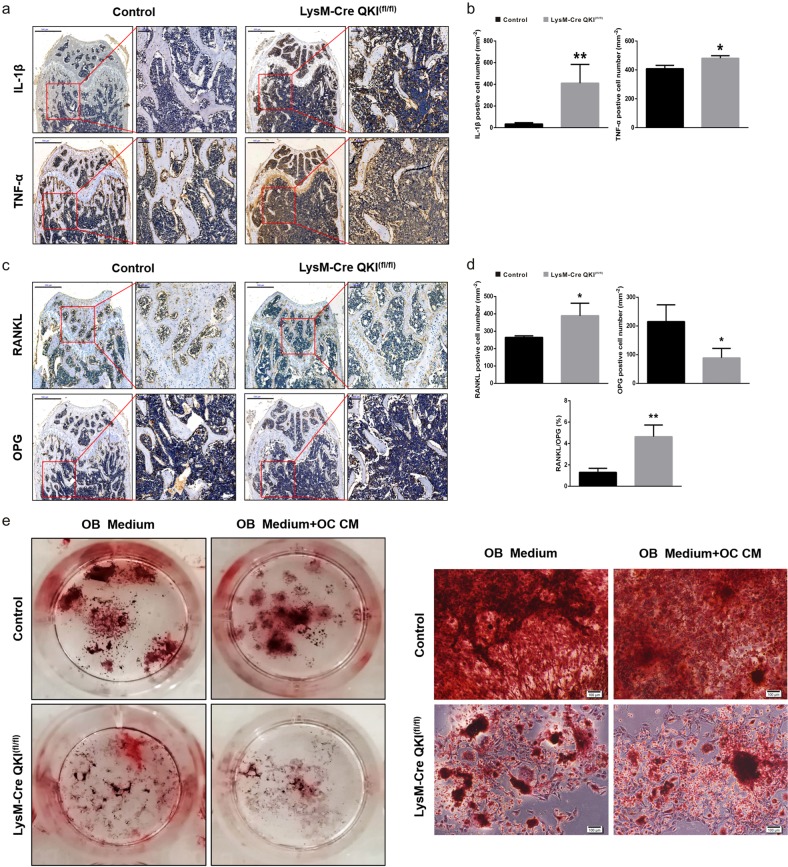
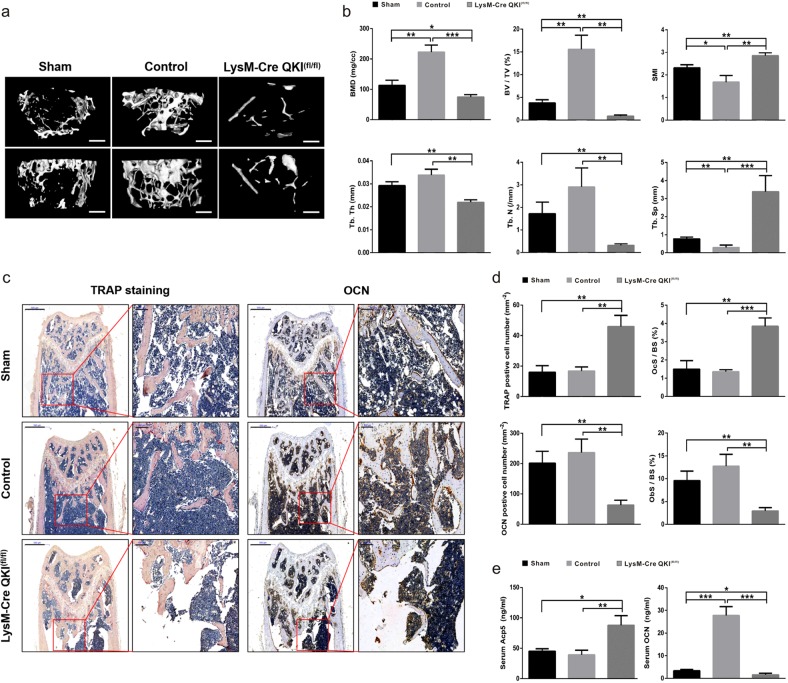
Quaking (QKI), an RNA-binding protein, has been reported to exhibit numerous biological functions, such as mRNA regulation, cancer suppression, and anti-inflammation. However, little known about the effects of QKI on bone metabolism. In this study, we used a monocyte/macrophage-specific QKI knockout transgenic mouse model to investigate the effects of QKI deficiency on receptor activator of NF-κB ligand (RANKL)-induced osteoclastogenesis. The loss of QKI promoted the formation of multinucleated tartrate-resistant acid phosphatase (TRAP)-positive osteoclasts (OCs) from bone marrow macrophages, and upregulated the expression of OC-specific markers, including TRAP (Acp5) and cathepsin K (Ctsk). The pro-osteoclastogenesis effect of QKI deficiency was achieved by amplifying the signaling cascades of the NF-κB and mitogen-activated protein kinase (MAPK) pathways; then, signaling upregulated the activation of nuclear factor of activated T cells c1 (NFATc1), which is considered to be the core transcription factor that regulates OC differentiation. In addition, QKI deficiency could inhibit osteoblast (OB) formation through the inflammatory microenvironment. Taken together, our data suggest that QKI deficiency promoted OC differentiation and disrupted bone metabolic balance, and eventually led to osteopenia under physiological conditions and aggravated the degree of osteoporosis under pathological conditions.


Conflict of interest statement

The authors declare that they have no conflict of interest.

Figures

Fig. 1
Fig. 1. Decreased bone mass and increased OC number in 8-week-old KO mice.
a Representative μCT reconstructed images of trabecular bone from KO or control group. Scale bar, 200 μm (left image, sagittal view of metaphyseal region; top in right image, horizontal view; bottom, coronal view). b Quantification of BMD, BV/TV, Tb.Th, Tb.N, Tb.Sp, and SMI were measured. n = 6, *P < 0.05, **P < 0.01, ***P < 0.001. c Histological analysis of H&E, TRAP staining, and QKI, OCN IHC in femur metaphyseal region. Scale bar, 500 μm in left image in each group and 100 μm in right image in each group. d, e The data shown as the mean ± sd. OcS/BS osteoclast surface per bone surface, ObS/BS osteoblast surface per bone surface. n = 6, *P < 0.05, **P < 0.01. f Serum Acp5 and OCN abundance in KO and control mice. n = 6, *P < 0.05.
Fig. 2
Fig. 2. During osteoclastogenesis, QKI expression decreased gradually.
a TRAP staining was performed in BMMs treated with 25 ng/ml M-CSF and 50 ng/ml RANKL on day 5. Scale bar, 100 μm. b The number and area of TRAP-positive cells were counted. n = 5, *P < 0.05, **P < 0.01. c qt-PCR analysis of OC formation specific genes and Qki gene. n = 4, *P < 0.05, **P < 0.01. d Western blot analysis of OC formation important transcription factors and QKI expression.
Fig. 3
Fig. 3. QKI deficiency stimulate osteoclastogenesis.
a TRAP staining was performed in OCs induced by BMMs from KO or control group treated with 25 ng/ml M-CSF and 50 ng/ml RANKL. Scale bar, 100 μm. b The number and area of TRAP-positive cells was counted. n = 5, **P < 0.01. c TRAP activity assessment using cell supernatant was accomplished on the third and fifth day after BMMs from KO or control group treated with 25 ng/ml M-CSF and 50 ng/ml RANKL. n = 4, **P < 0.01. d qt-PCR analysis of Qki gene and OCs formation specific genes and important transcription factors expression. n = 4, *P < 0.05, **P < 0.01. e Western blot analysis of QKI and OC formation important transcription factors between KO and control group on certain day during osteoclastogenesis stimulated with M-CSF and RANKL.
Fig. 4
Fig. 4. QKI deficiency amplified the activation of the NF-κB and MAPK signaling pathways during osteoclastogenesis.
ae Western blot analysis of RANKL-induced p65, IκBα, p38, ERK, JNK in BMMs from KO and control mice, and quantitative analysis of the western blot data, respectively. n = 4, *P < 0.05, **P < 0.01. f Western blot analysis of NFATc1 expression after blocking IκBα, p38, ERK, and JNK by inhibitors. g Quantitative analysis of the western blot data evaluating NFATc1 expression after blocking signaling pathways. n = 4, **P < 0.01, ***P < 0.001.
Fig. 5
Fig. 5. QKI deficiency aggravated the imbalance in OB-OC crosstalk in bone metabolism in 8-week-old KO mice.
a Histological analysis of IL-1β and TNF-α IHC in femur metaphyseal region. Scale bar, 500 μm in left and 100 μm in right. b The data shown as the mean ± sd. n = 6, *P < 0.05, **P < 0.01. c Histological analysis of RANKL and OPG IHC in femur metaphyseal region. Scale bar, 500 μm in left and 100 μm in right. d The data shown as the mean ± sd. n = 6, *P < 0.05, **P < 0.01. e Induced OBs were stained by Alizarin red staining. Scale bar, 100 μm.
Fig. 6
Fig. 6. QKI deficiency led to more serious osteopenia in OVX mice model.
a Representative μCT reconstructed images of trabecular bone from sham, control and KO group. Scale bar, 200 μm (top, horizontal view; bottom, coronal view). b Quantification of BMD, BV/TV, Tb.Th, Tb.N, Tb.Sp, and SMI were measured. n = 5, *P < 0.05, **P < 0.01, ***P < 0.001. c Histological analysis of TRAP staining and OCN IHC in femur metaphyseal region. Scale bar, 500 μm in left and 100 μm in right. d The data shown as the mean ± sd. n = 5, **P < 0.01, ***P < 0.001. e Serum Acp5 and OCN abundance in sham, control, and KO group. n = 5, *P < 0.05, **P < 0.01, ***P < 0.001.

References

    1. Liu C, et al. Lumichrome inhibits osteoclastogenesis and bone resorption through suppressing RANKL-induced NFAT activation and calcium signaling. J. Cell Physiol. 2018;233:8971–8983. doi: 10.1002/jcp.26841. - DOI - PubMed
    1. Ferron M, et al. A RANKL-PKC -TFEB signaling cascade is necessary for lysosomal biogenesis in osteoclasts. Genes Dev. 2013;27:955–969. doi: 10.1101/gad.213827.113. - DOI - PMC - PubMed
    1. Kim H, et al. Tmem64 modulates calcium signaling during RANKL-mediated osteoclast differentiation. Cell Metab. 2013;17:249–260. doi: 10.1016/j.cmet.2013.01.002. - DOI - PMC - PubMed
    1. Lee B, et al. RIP140 in monocytes/macrophages regulates osteoclast differentiation and bone homeostasis. JCI Insight. 2017;2:e90517. doi: 10.1172/jci.insight.90517. - DOI - PMC - PubMed
    1. Teitelbaum SL. Bone resorption by osteoclasts. Science. 2000;289:1504–1508. doi: 10.1126/science.289.5484.1504. - DOI - PubMed

Publication types

MeSH terms