. 2021 Feb;35(2):377-388.
doi: 10.1038/s41375-020-0845-6. Epub 2020 May 7.

SHMT inhibition is effective and synergizes with methotrexate in T-cell acute lymphoblastic leukemia

Affiliations

SHMT inhibition is effective and synergizes with methotrexate in T-cell acute lymphoblastic leukemia

Juan C García-Cañaveras et al. Leukemia. 2021 Feb.

Abstract

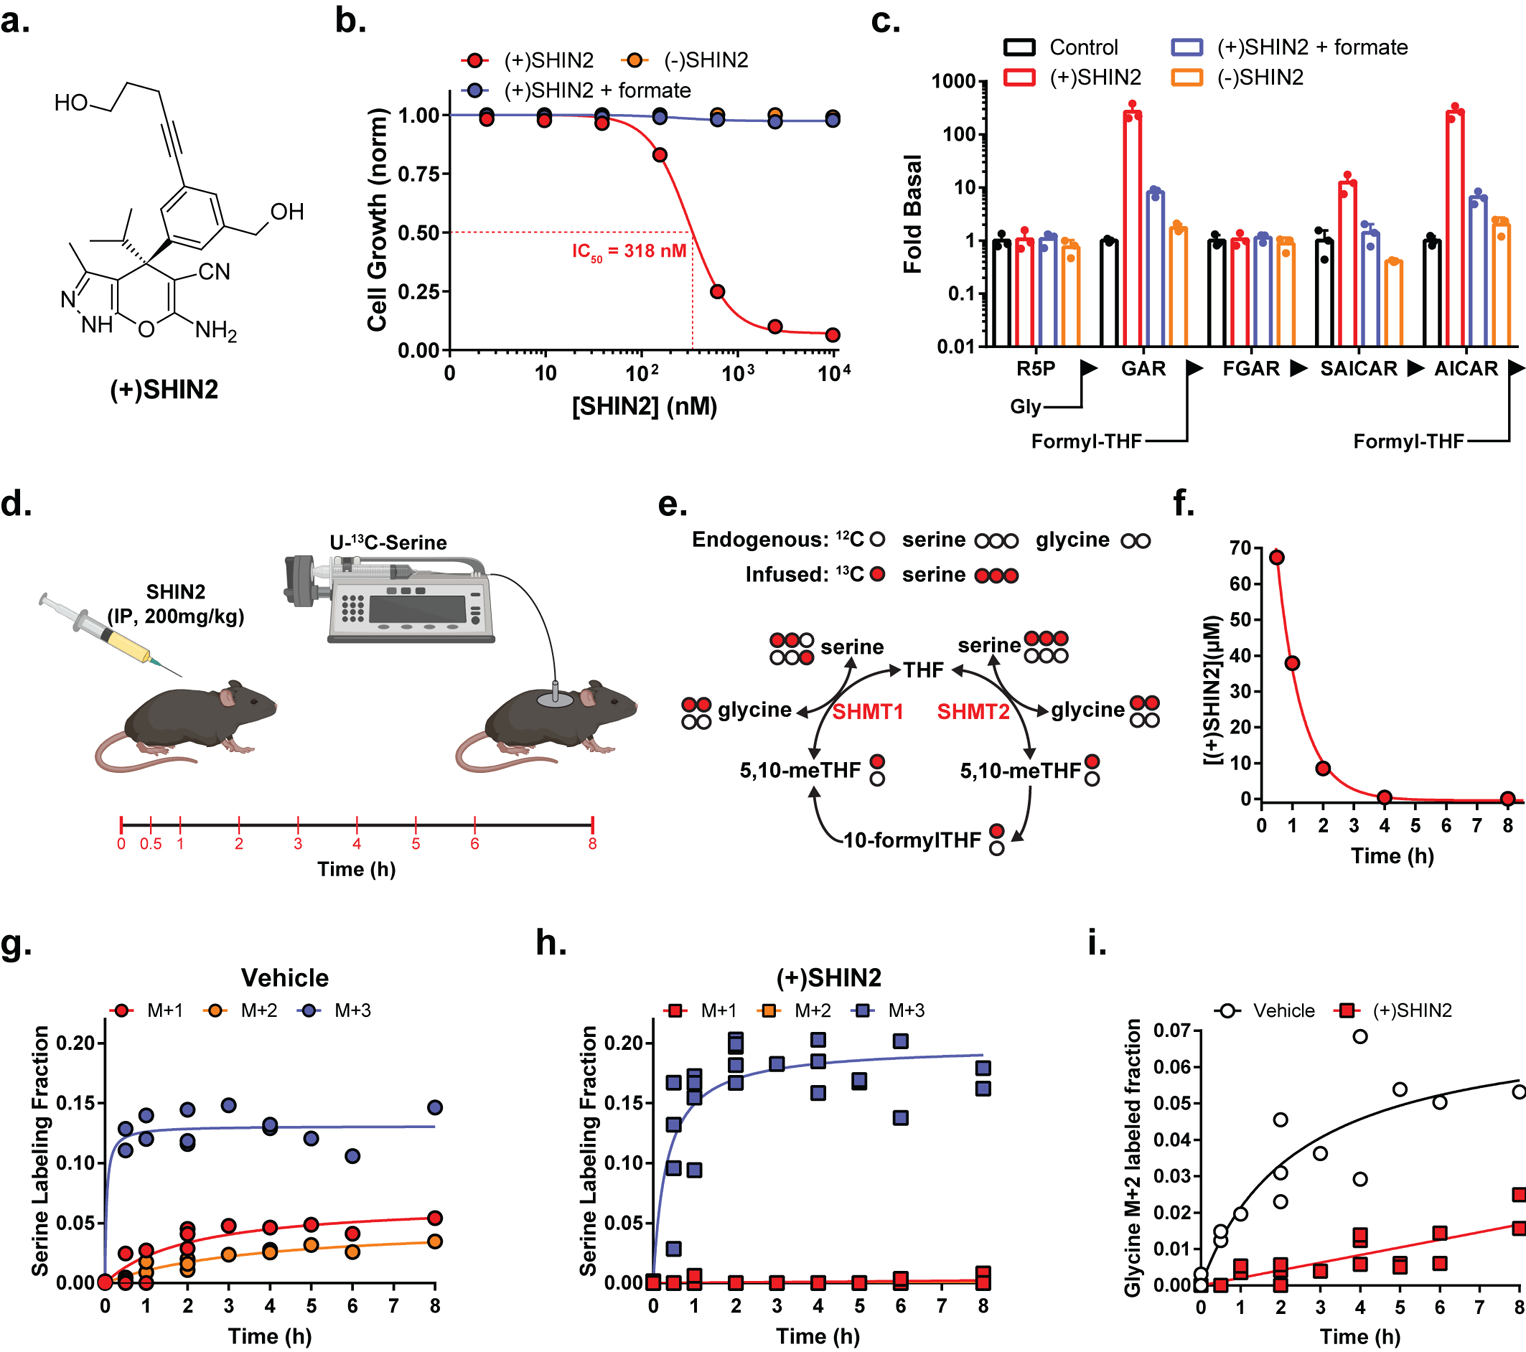
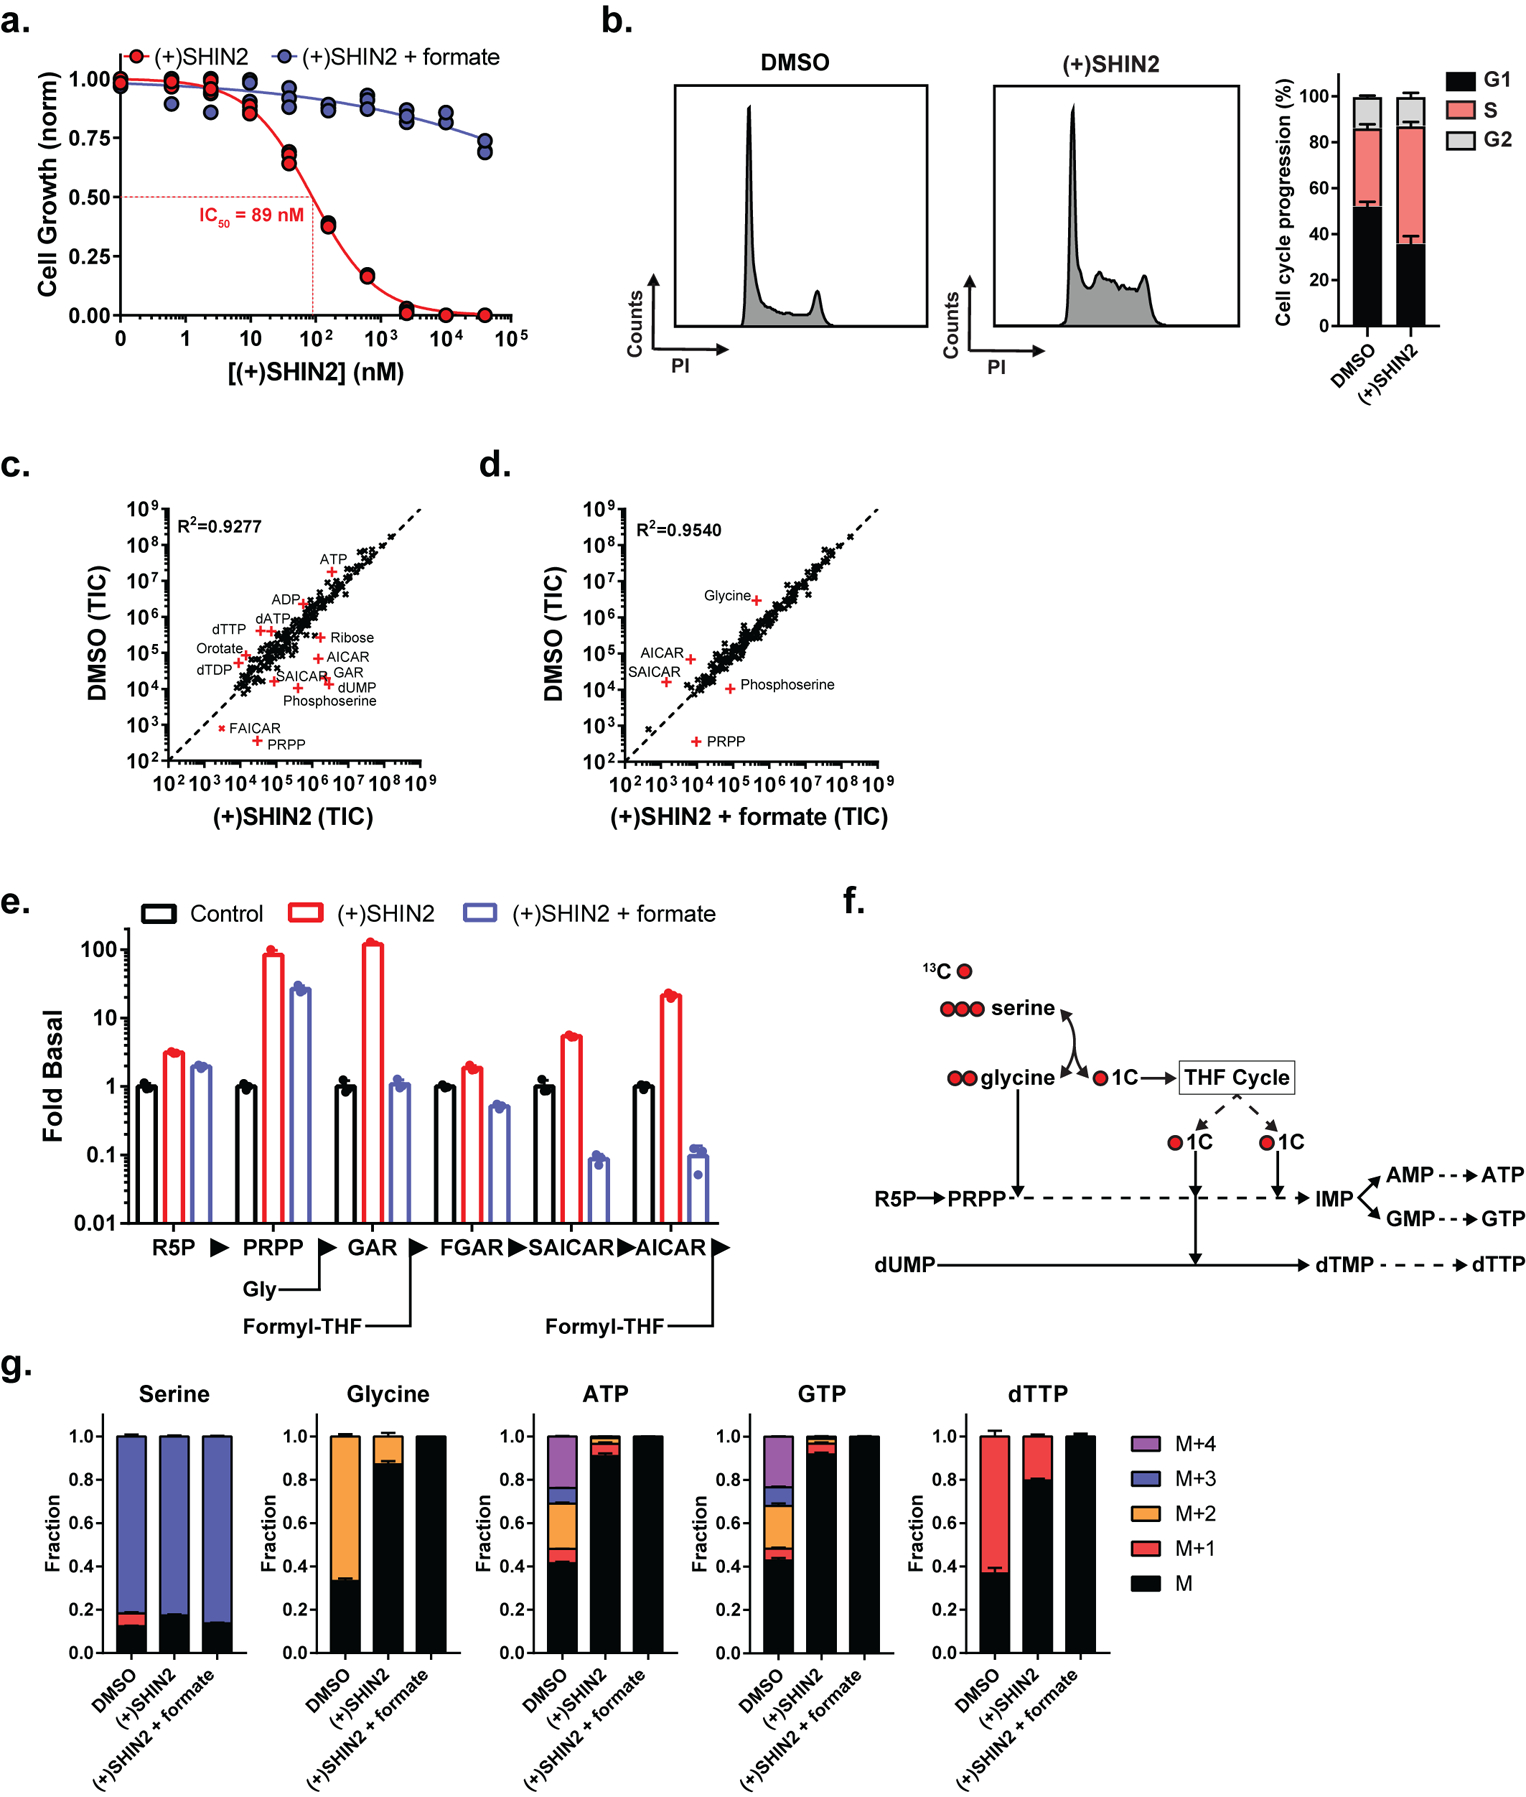
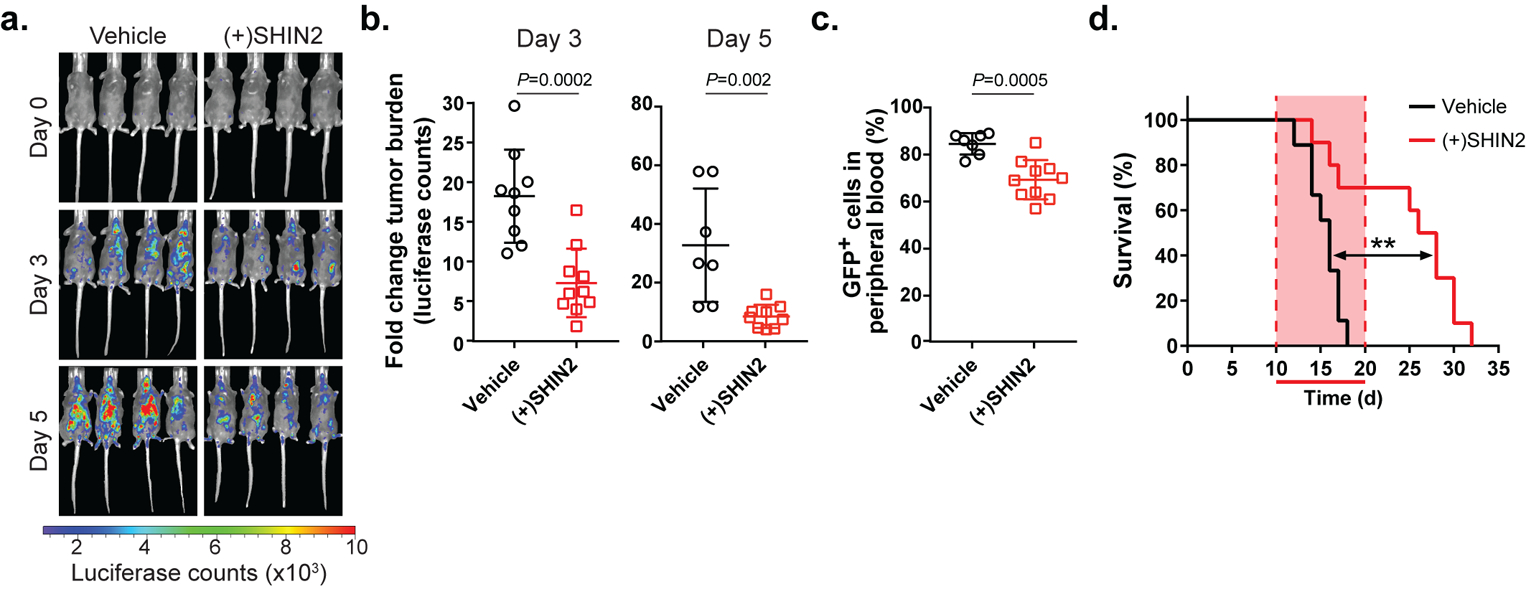
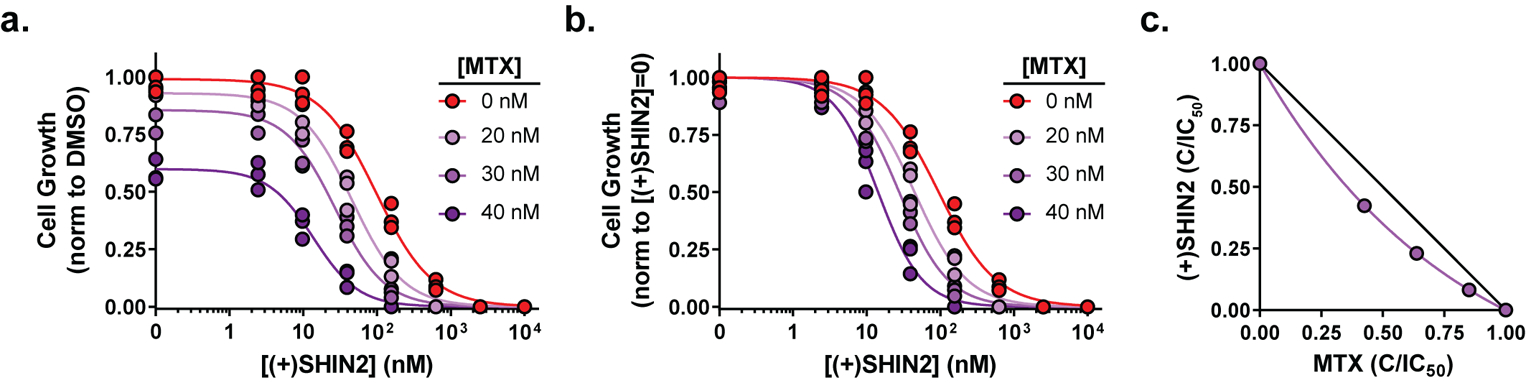
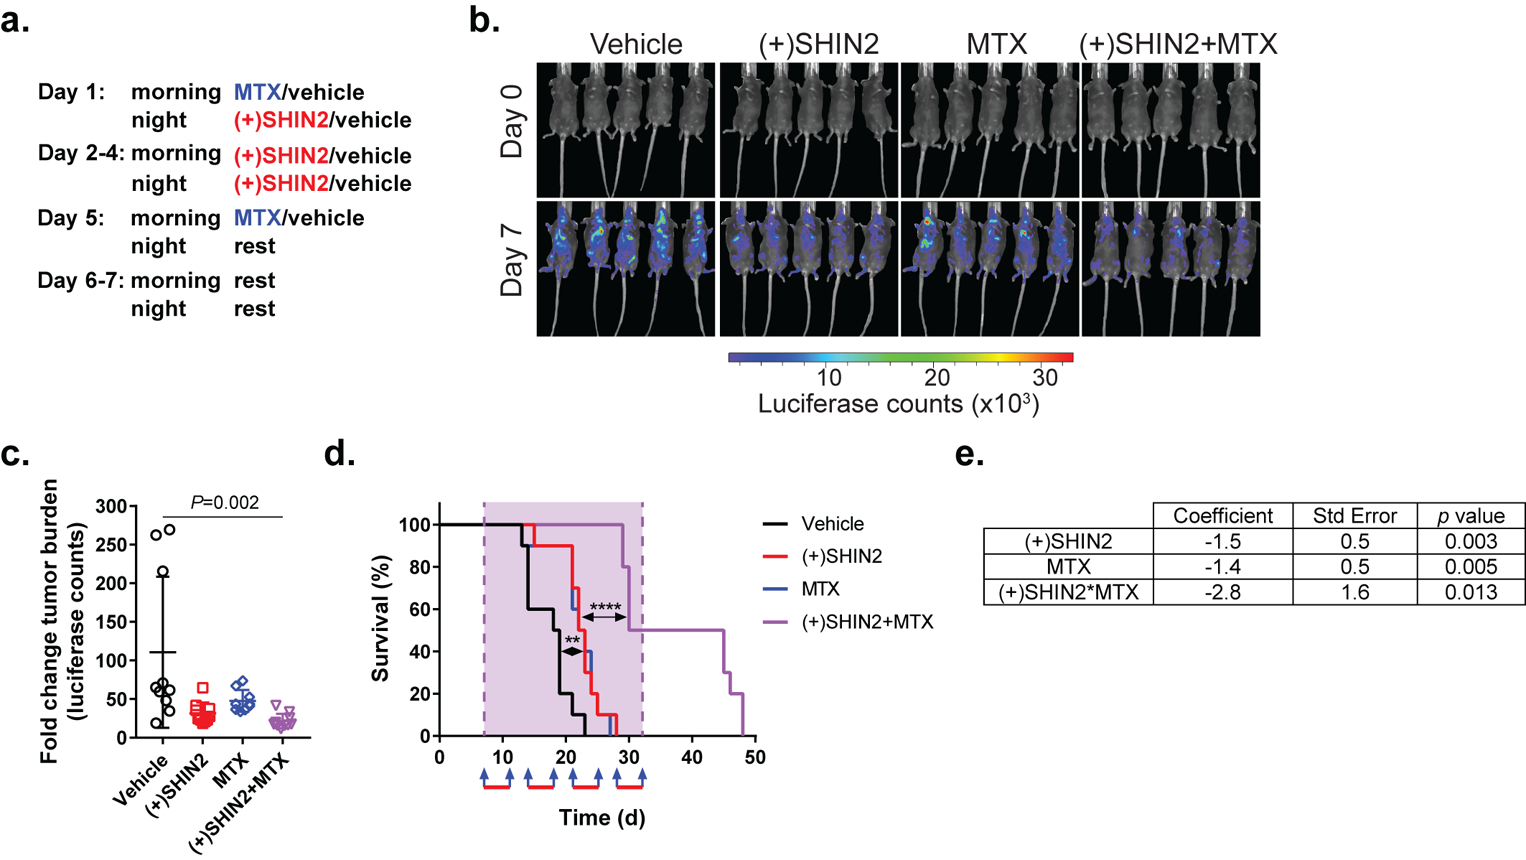
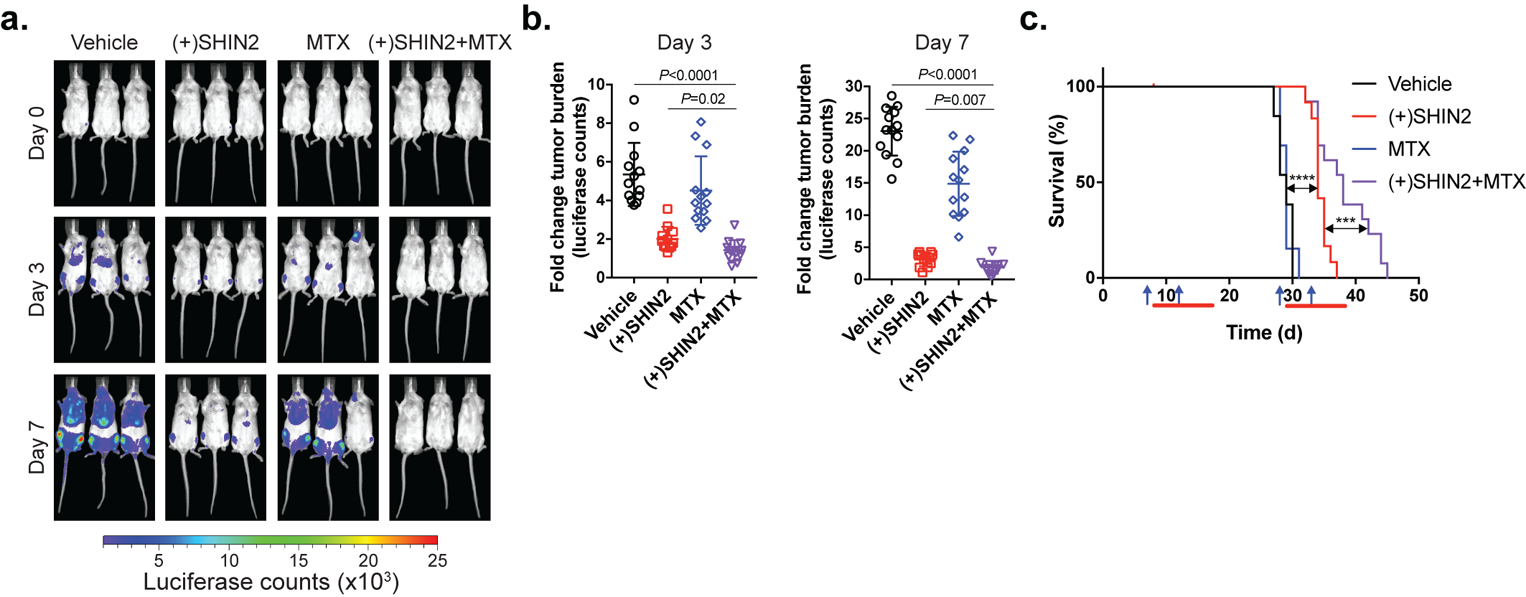
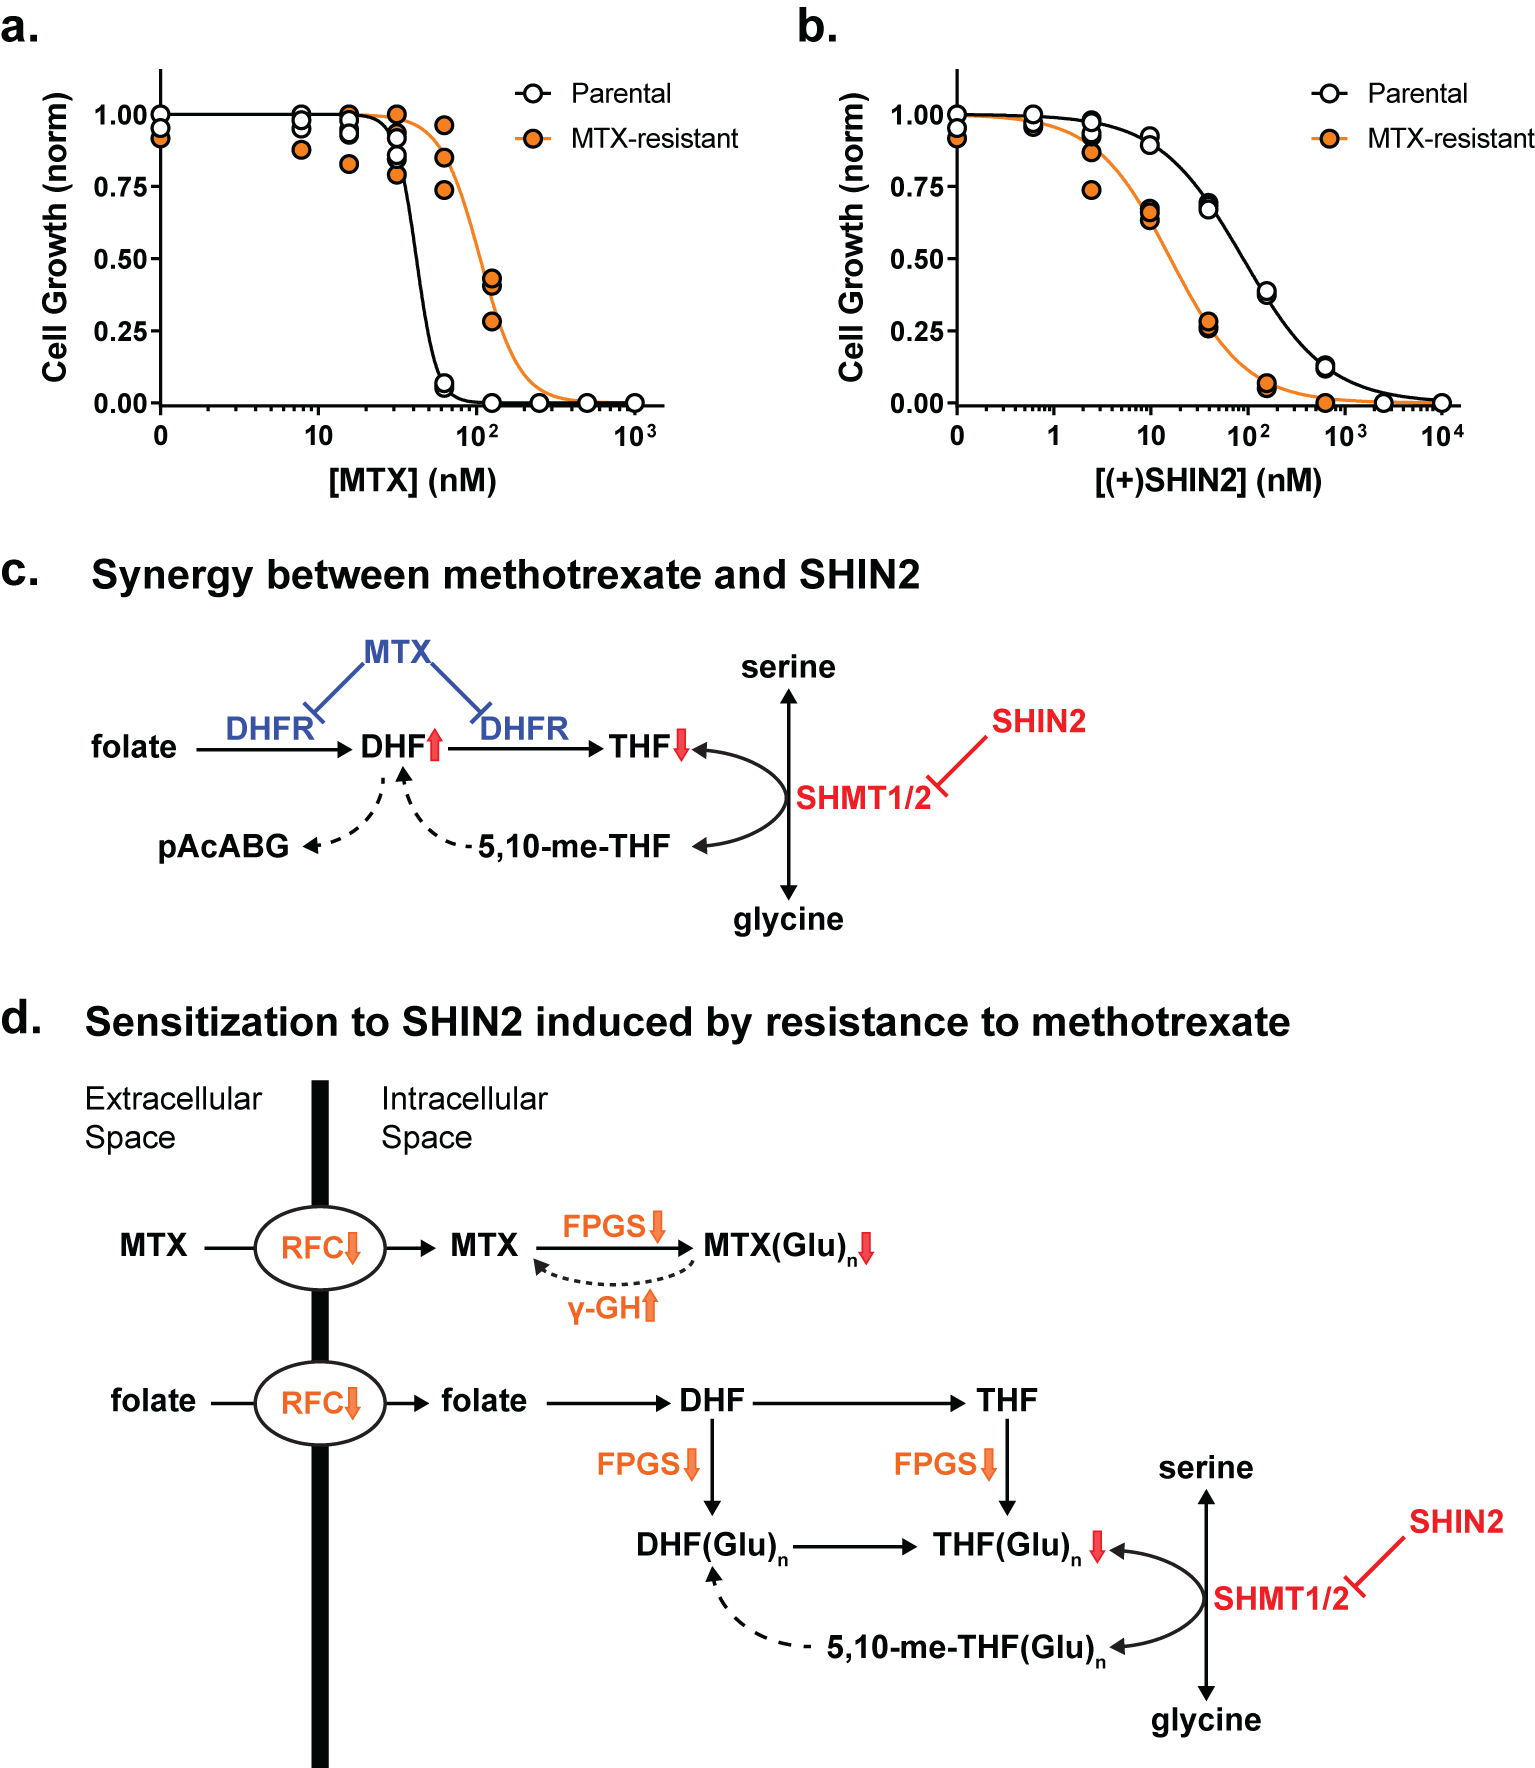
Folate metabolism enables cell growth by providing one-carbon (1C) units for nucleotide biosynthesis. The 1C units are carried by tetrahydrofolate, whose production by the enzyme dihydrofolate reductase is targeted by the important anticancer drug methotrexate. 1C units come largely from serine catabolism by the enzyme serine hydroxymethyltransferase (SHMT), whose mitochondrial isoform is strongly upregulated in cancer. Here we report the SHMT inhibitor SHIN2 and demonstrate its in vivo target engagement with 13C-serine tracing. As methotrexate is standard treatment for T-cell acute lymphoblastic leukemia (T-ALL), we explored the utility of SHIN2 in this disease. SHIN2 increases survival in NOTCH1-driven mouse primary T-ALL in vivo. Low dose methotrexate sensitizes Molt4 human T-ALL cells to SHIN2, and cells rendered methotrexate resistant in vitro show enhanced sensitivity to SHIN2. Finally, SHIN2 and methotrexate synergize in mouse primary T-ALL and in a human patient-derived xenograft in vivo, increasing survival. Thus, SHMT inhibition offers a complementary strategy in the treatment of T-ALL.


Conflict of interest statement

Conflict of Interest Disclosures. G. S. Ducker, J. M. Ghergurovich, H. Kim, and J. D. Rabinowitz are inventors on a Princeton University patent covering serine hydroxymethyltransferase inhibitors and their use in cancer. J. D. Rabinowitz is a co-founder of Raze Therapeutics and advisor and stock owner in Kadmon, Agios, L.E.A.F., and Rafael Pharmaceuticals. No competing interests were disclosed by the other authors.

Figures

Figure 1.
Figure 1.. SHIN2 inhibits SHMT in vitro and in vivo.
(a) Chemical structure. (b) Growth of HCT116 cells (n=3). (c) Normalized levels of purine biosynthetic pathway intermediates in HCT116 cells (24 h drug exposure at 2 μM) (mean ± SD, n=3). In b and c, formate concentration is 1 mM and (−)SHIN2 is the inactive enantiomer. (d) Experimental design for the analysis of in vivo target engagement using IP delivery of (+)SHIN2 followed by infusion of U-13C-serine. The times in red indicate blood collection. (e) Schematic showing labeling from infused U-13C-serine into glycine and serine via 1C/folate metabolism. (f) Plasma (+)SHIN2 concentration over time after a 200 mg/kg IP dose (mean, n = 2). (g,h) Circulating serine labeling pattern upon vehicle (g) or 200 mg/kg IP (+)SHIN2 (h) administration (n=2). (i) Circulating glycine M+2 fraction upon vehicle or (+)SHIN2 administration (n=2).
Figure 2.
Figure 2.. SHIN2 blocks growth of the human T-ALL cell line Molt4 via SHMT inhibition.
(a) Growth of Molt4 cells (n=3). (b) Analysis of (+)SHIN2 effects on cell cycle in Molt4 cells (48 h after treatment). Representative cell cycle histograms are shown on the panels on the left; quantification is shown on the panel on the right (mean ± SD, n=3). (c-e) Metabolite levels in Molt4 cells (24 h drug exposure) (mean, n=3). In c and d, metabolites displaying a fold-change > 4 are highlighted in red. (f) Schematic showing the incorporation of U-13C-serine-derived carbons into downstream products. (g) Metabolite labeling patterns in Molt4 cells after a 6 h incubation with U-13C-serine (mean ± SD, n=3). (+)SHIN2 concentration is 2 μM, formate concentration is 1 mM.
Figure 3.
Figure 3.. SHIN2 has an antileukemic effect in T-ALL in vivo.
(a-b) Representative images from treated mice (a) and quantification (b) of changes in tumor burden at day 3 and day 5 post-treatment initiation with (+)SHIN2 (200 mg/kg, BID) as assessed by bioimaging in mice allografted with NOTCH1-induced mouse leukemia cells (n=9 for vehicle; n=10 for (+)SHIN2). P values were calculated using a two-tailed unpaired Student’s t-test. (c) Changes in leukemic burden at day 4 post treatment initiation with (+)SHIN2 (200 mg/kg, BID) as assessed by FACS detection of leukemic GFP-positive cells in peripheral blood (n=9 for vehicle; n=10 for (+)SHIN2). P value was calculated using a two-tailed unpaired Student’s t-test. (d) Kaplan-Meier survival curves of mice harboring NOTCH1-induced mouse T-ALL treated with vehicle or (+)SHIN2 (200 mg/kg) for 11 days (log-rank test; **P<0.01) (n=9 for vehicle; n=10 for (+)SHIN2).
Figure 4.
Figure 4.. SHIN2 and methotrexate synergize in Molt4 cells.
(a-b) Growth of Molt4 cells incubated with increasing concentrations of (+)SHIN2 in the presence of 0, 20, 30 and 40 nM methotrexate (MTX) normalized to DMSO control proliferation (a) or to proliferation for the same methotrexate dose in the absence of (+)SHIN2 (b) (n=3). (c) Isobologram for (+)SHIN2 and methotrexate showing the combinations of the drug that achieve a decrease in proliferation of > 50%; purple, actual values; black line, theoretical additive effect.
Figure 5
Figure 5. Synergistic in vivo antileukemic effect of SHIN2 and methotrexate in mouse primary leukemia
. (a) Dosage regimen for each of the 4 cycles of treatment. Methotrexate was administered at 10 mg/kg (IP injection), (+)SHIN2 was administered at 200 mg/kg (IP injection). (b-c) Representative images from five treated mice (b) and quantification (c) of changes in tumor burden as assessed by bioimaging in mice allografted with NOTCH1-induced mouse leukemia cells after one treatment cycle (n=10 for all groups). P value was calculated using one-way ANOVA testing. (d) Kaplan-Meier survival curves (n=10 for all groups, log-rank test; **P<0.01, ****P<0.001). Blue arrows represent methotrexate injection. Red bars represent days under (+)SHIN2 treatment. (e) Results of a Cox regression with Firth’s penalized likelihood including the terms for (+)SHIN2, methotrexate and the interaction between (+)SHIN2 and methotrexate. For each parameter the actual value of the coefficient, the standard error and the p value (null hypothesis coefficient = 0) are shown.
Figure 6.
Figure 6.. Synergistic in vivo antileukemic effect of SHIN2 and methotrexate in a human patient-derived T-ALL xenograft.
(a-b) Representative images from treated mice (a) and quantification (b) of changes in tumor burden as assessed by bioimaging in mice xenografted with a human patient-derived T-ALL xenograft at day 3 or day 7 after treatment initiation (n=12 for (+)SHIN2 and n=13 for the other groups). P value was calculated using one-way ANOVA testing, p value for (+)SHIN2 vs (+)SHIN2 + MTX comparison was calculated using Tukey’s multiple comparisons test. (c) Kaplan-Meier survival curves (n=12 for (+)SHIN2 and n=13 for the other groups, log-rank test; ***P<0.005, ****P<0.001). Blue arrows represent methotrexate injection. Red bars represent days under (+)SHIN2 treatment.
Figure 7.
Figure 7.. Methotrexate resistance sensitizes Molt4 cells to SHIN2.
(a-b) Growth of parental or methotrexate (MTX)-resistant Molt4 cells incubated with increasing concentrations of methotrexate (a) or (+)SHIN2 (b) (n=3). (c) Proposed mechanism for the synergy between methotrexate and SHIN2 in T-ALL. DHFR inhibition by methotrexate decreases intracellular THF and thereby sensitizes cells to SHMT inhibition. (d) Proposed mechanism by which methotrexate resistance sensitizes to SHIN2. Decreases in folate import and polyglutamation (steps highlighted in orange) promote methotrexate resistance by decreasing intracellular polyglutamated-methotrexate (MTX(Glu)n), but also decrease polyglutamated-THF (THF(Glu)n), depleting the substrate of the SHMT reaction and thereby sensitizing the cells to SHIN2.

References

    1. Ducker GS, Rabinowitz JD. One-Carbon Metabolism in Health and Disease. Cell Metab 2017; 25: 27–42. - PMC - PubMed
    1. Fan J, Ye J, Kamphorst JJ, Shlomi T, Thompson CB, Rabinowitz JD. Quantitative flux analysis reveals folate-dependent NADPH production. Nature 2014; 510: 298–302. - PMC - PubMed
    1. Maddocks ODK, Labuschagne CF, Adams PD, Vousden KH. Serine Metabolism Supports the Methionine Cycle and DNA/RNA Methylation through De Novo ATP Synthesis in Cancer Cells. Mol Cell 2016; 61: 210–221. - PMC - PubMed
    1. Ducker GS, Chen L, Morscher RJ, Ghergurovich JM, Esposito M, Teng X et al. Reversal of Cytosolic One-Carbon Flux Compensates for Loss of the Mitochondrial Folate Pathway. Cell Metab 2016; 23: 1140–1153. - PMC - PubMed
    1. Jain M, Nilsson R, Sharma S, Madhusudhan N, Kitami T, Souza AL et al. Metabolite Profiling Identifies a Key Role for Glycine in Rapid Cancer Cell Proliferation. Science (80-) 2012; 336: 1040–1044. - PMC - PubMed

Publication types

MeSH terms