. 2020 Oct;27(10):2921-2941.
doi: 10.1038/s41418-020-0551-y. Epub 2020 May 7.

Adipogenesis of skeletal muscle fibro/adipogenic progenitors is affected by the WNT5a/GSK3/β-catenin axis

Affiliations

Adipogenesis of skeletal muscle fibro/adipogenic progenitors is affected by the WNT5a/GSK3/β-catenin axis

Alessio Reggio et al. Cell Death Differ. 2020 Oct.

Abstract

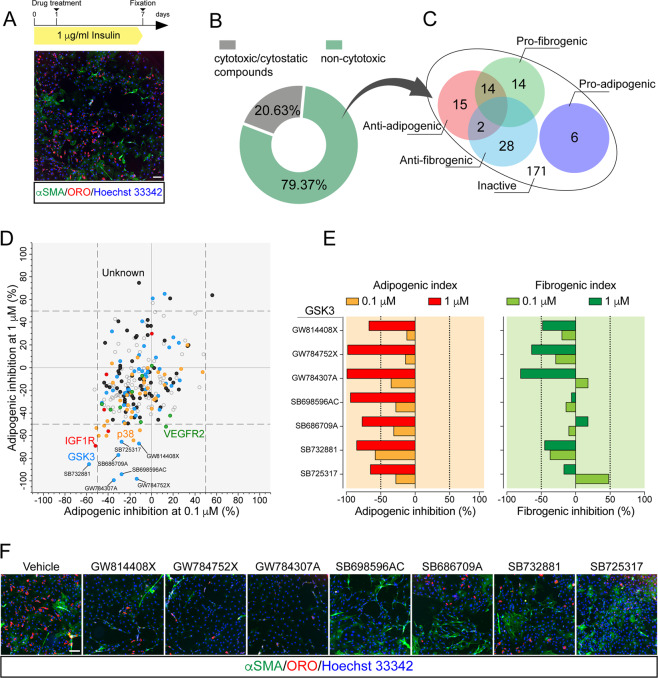
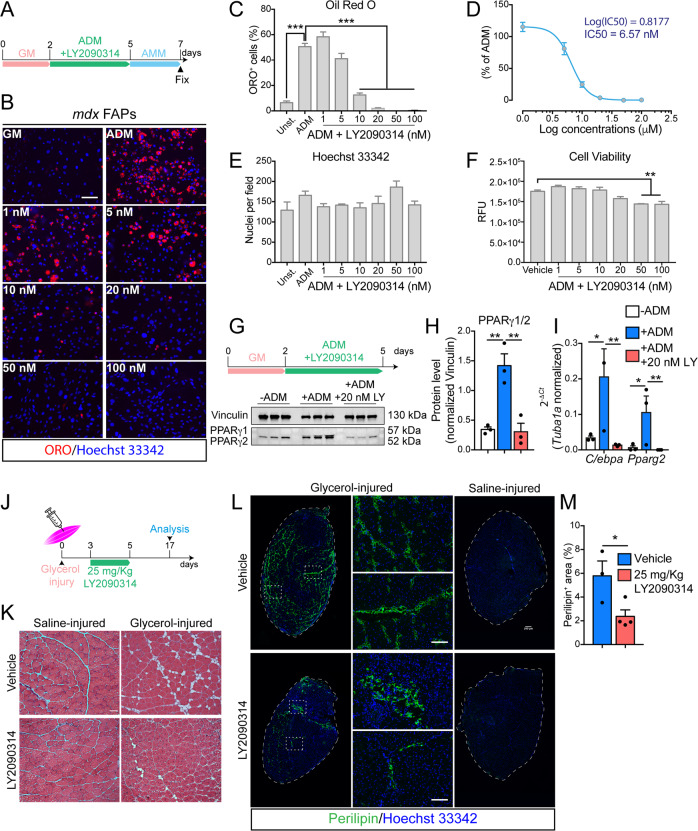
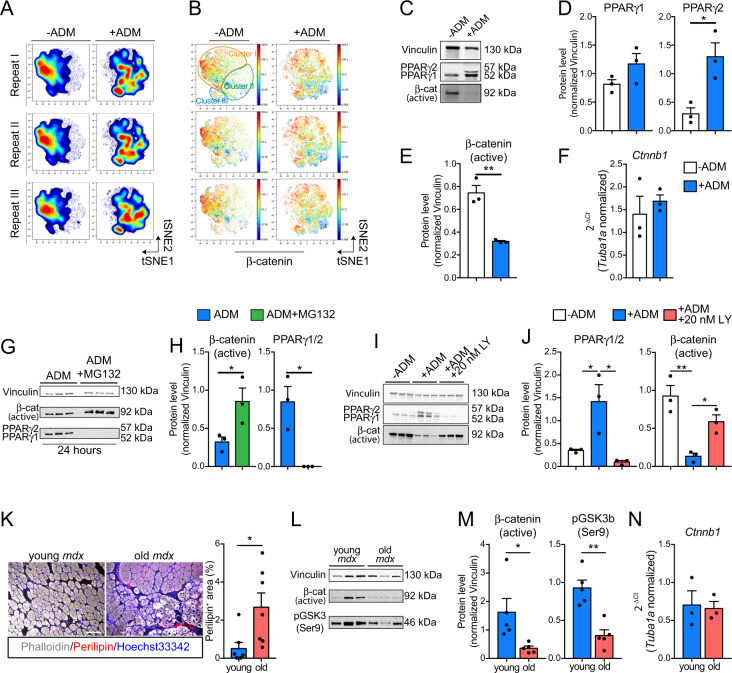
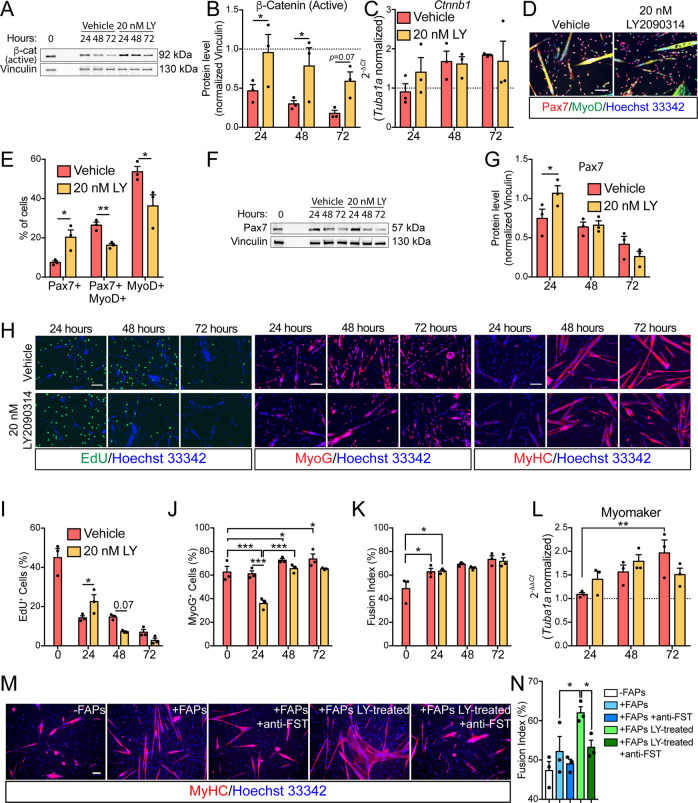
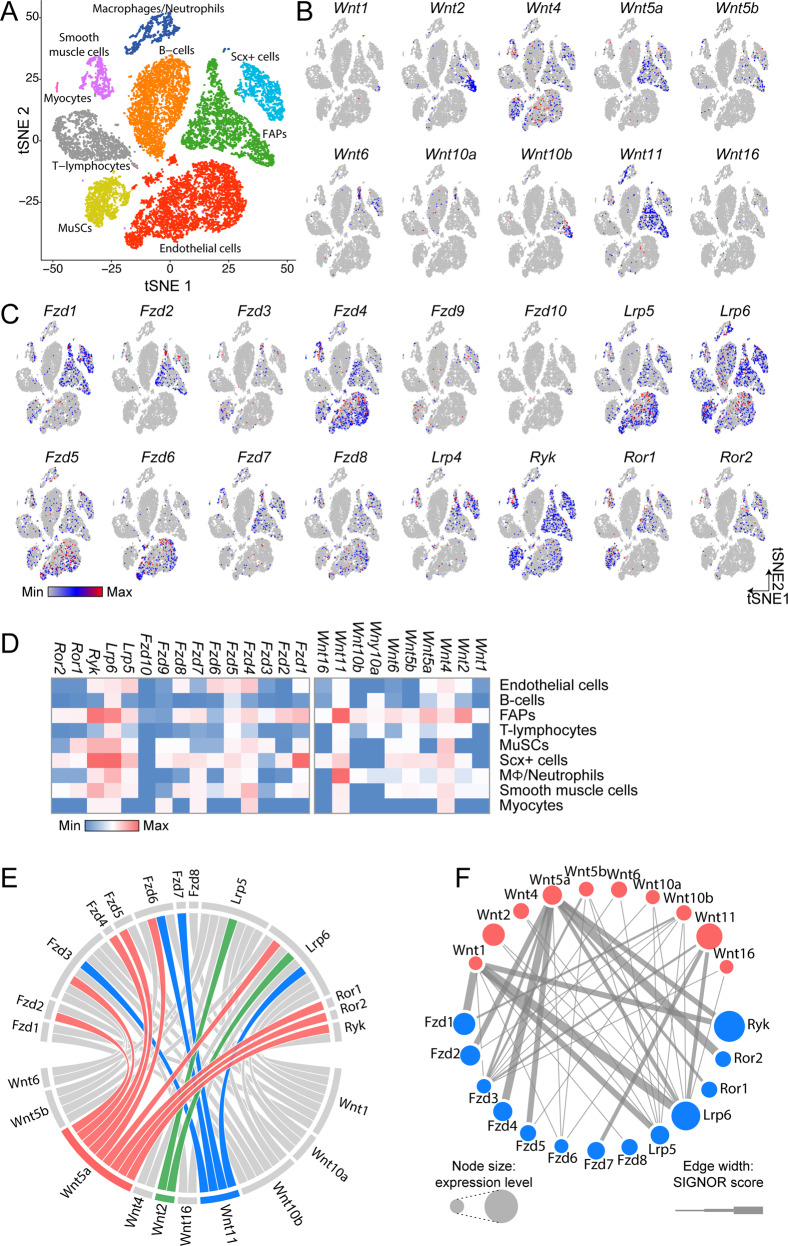
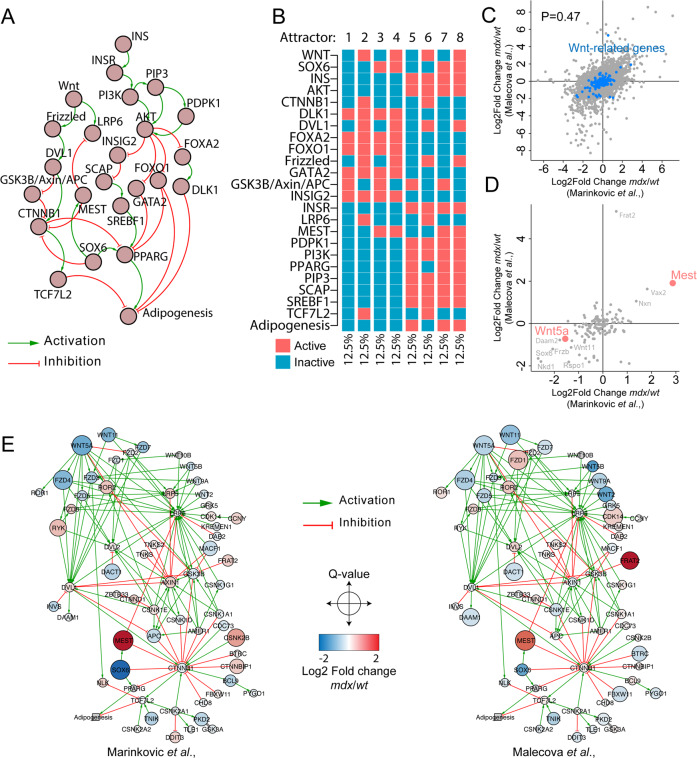
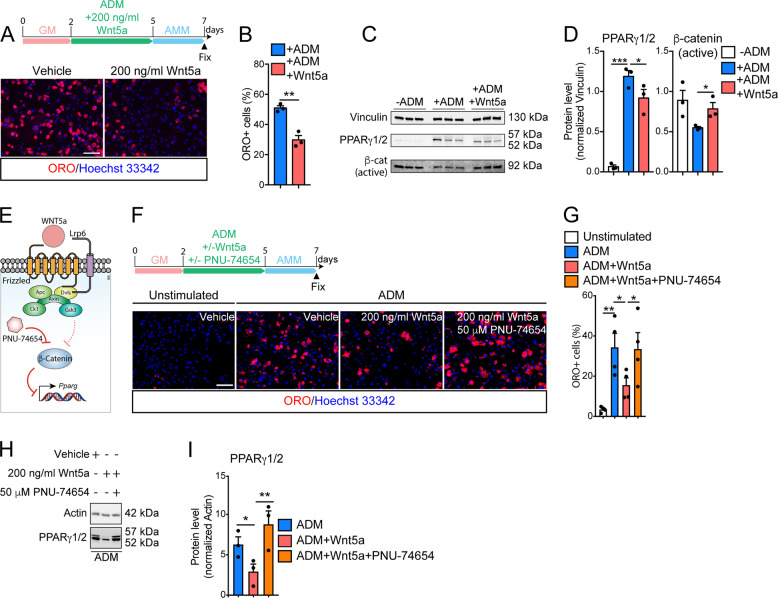
Fibro/Adipogenic Progenitors (FAPs) are muscle-interstitial progenitors mediating pro-myogenic signals that are critical for muscle homeostasis and regeneration. In myopathies, the autocrine/paracrine constraints controlling FAP adipogenesis are released causing fat infiltrates. Here, by combining pharmacological screening, high-dimensional mass cytometry and in silico network modeling with the integration of single-cell/bulk RNA sequencing data, we highlighted the canonical WNT/GSK/β-catenin signaling as a crucial pathway modulating FAP adipogenesis triggered by insulin signaling. Consistently, pharmacological blockade of GSK3, by the LY2090314 inhibitor, stabilizes β-catenin and represses PPARγ expression abrogating FAP adipogenesis ex vivo while limiting fatty degeneration in vivo. Furthermore, GSK3 inhibition improves the FAP pro-myogenic role by efficiently stimulating, via follistatin secretion, muscle satellite cell (MuSC) differentiation into mature myotubes. Combining, publicly available single-cell RNAseq datasets, we characterize FAPs as the main source of WNT ligands inferring their potential in mediating autocrine/paracrine responses in the muscle niche. Lastly, we identify WNT5a, whose expression is impaired in dystrophic FAPs, as a crucial WNT ligand able to restrain the detrimental adipogenic differentiation drift of these cells through the positive modulation of the β-catenin signaling.


Conflict of interest statement

The authors declare that they have no conflict of interest.

Figures

Fig. 1
Fig. 1. GSK inhibitors affect the differentiation potential of FAPs.
a Experimental plan to screen the PKI library. Representative vehicle-treated sample (10× magnification, scale bar: 100 μm) showing spontaneous differentiation of FAPs into adipocytes (red, ORO staining) and myofibroblasts (green, stained with anti-αSMA antibody). b Screening compounds were classified as safe or cytotoxic/cytostatic. Cytotoxic/cytostatic compounds were defined for their capability to reduce by more than 30% the number of Hoechst 33342-positive nuclei at the end of the assay. c Venn diagrams summarizing the number and class of hits. d Scatter plot representing the inhibition of adipogenesis of the safe compounds at the two tested concentrations (0.1 and 1 μM). Dashed vertical and horizontal lines indicate the cutoff used to define a “hit” (±50% of the effect vs. DMSO). KIs targeting the same kinase are labeled with the same color. e Bar plot representing the percentage of adipogenic (left) and myofibrogenic (right) inhibition for the active compounds targeting GSK3. Dashed vertical lines indicate the cutoff for hit selection. f Representative immunofluorescence images (10× magnification, scale bar: 100 μm) showing FAP adipogenesis and myofibrogenesis upon treatment with GSK3-targeting compounds. Nuclei (blue) were revealed using Hoechst 33342.
Fig. 2
Fig. 2. LY2090314 restricts FAP adipogenesis ex vivo while limiting fatty degeneration in vivo.
a Experimental plan for FAP differentiation. GM growth medium, ADM adipocyte differentiation medium, AMM adipocyte maintenance medium. b Representative ORO staining (20× magnification; scale bar: 100 μm) of mdx FAPs differentiated into adipocytes (red) in the presence of increasing doses (from 1 to 100 nM) of LY2090314 (n = 3). Nuclei (blue) were revealed using Hoechst 33342. Control samples were incubated with DMSO as vehicle. c Bar plot reporting the fraction of ORO-positive FAPs in each condition. The statistical significance was estimated by One-way ANOVA. d Plot reporting the non-linear regression analysis for the IC50 calculation of adipogenic inhibition at increasing doses of LY2090314 in FAPs undergoing adipogenesis. e Bar plot representing the average number of nuclei per field in each condition. The statistical significance was estimated by one-way ANOVA. f Viability assay of FAPs undergoing adipogenesis cultured  with increasing doses of LY2090314 (RFU relative fluorescence unit). The statistical significance was estimated by one-way ANOVA. g Experimental plan describing the timing of assay. Western blot of PPARγ1/2 protein levels (n = 3). h Bar plot representing the normalized densitometric signal of PPARγ1/2. The statistical significance was estimated by one-way ANOVA. i Quantitative PCR (qPCR) of C/ebpa, and Pparg2 in FAPs undergoing adipogenesis in the presence of 20 nM LY2090314. The statistical significance was estimated by one-way ANOVA. j Experimental plan to induce fatty degeneration in mice hind limbs. k Representative hematoxylin and eosin staining (20× magnification; scale bar: 200 μm) of TAs injected either with glycerol or saline solution from LY2090314 (25 mg/Kg) and vehicle (DMSO)-treated mice (vehicle, n = 3; LY2090314, n = 4). l Representative immunofluorescence of intramuscular adipocytes (green) in TA sections (10× magnification, scale bar: 200 μm), stained with anti-perilipin 1 antibody. TA section reconstructions from mice treated with LY2090314 or vehicle in glycerol- and saline-injured limbs are reported. Insets (20× magnification, scale bar: 100 μm) showing higher magnification images. Nuclei (blue) were revealed using Hoechst 33342. m Bar plot reporting the average percentage of perilipin-positive area over the total sections. The statistical significance was estimated by Student’s t test. All data are represented as mean ± SEM and the statistical significance is defined as *p < 0.05; **p < 0.01; ***p < 0.001.
Fig. 3
Fig. 3. β-catenin degradation marks FAPs undergoing adipogenesis.
a Contour maps obtained by projecting, onto a two-dimensional plane, single-cell multiparametric data using the viSNE algorithm. Data from three independent FAP preparations, in the presence or absence of ADM, are shown. b Dot plot representations of the viSNE maps showing β-catenin expression (color coded, blue = low, red = high) across the reported conditions for each repeat. c Representative western blot showing the protein levels of both PPARγ isoforms, non-phospho (active) β-catenin and Vinculin in FAPs unstimulated or induced to differentiate into adipocytes upon ADM incubation (n = 3). d Bar graphs representing the densitometric values of PPARγ1, PPARγ2 in both conditions. e Bar graph showing the protein levels of non-phospho (active) β-catenin in both conditions. Protein levels were normalized to Vinculin. The statistical significance was estimated by Student's t test. f Relative expression of Ctnn1b in FAPs unstimulated or induced to differentiate into adipocytes upon ADM exposure (n = 3). g Western blot showing the protein levels of PPARγ, non-phospho (active) β-catenin and Vinculin in FAPs undergoing adipogenesis in the absence or presence of 20 μM MG132 (n = 3). (h) Bar graphs representing the densitometric values of PPARγ and non-phospho (active) β-catenin in both conditions. Protein levels were normalized to Vinculin. The statistical significance was estimated by Student's t test. i Western blot showing the protein levels of PPARγ, non-phospho (active) β-catenin and Vinculin in FAPs unstimulated or incubated with ADM and ADM supplemented with 20 nM LY2090314 (n = 3). j Bar graphs representing the densitometric values of PPARγ and non-phospho (active) β-catenin in all conditions. Protein levels were normalized to Vinculin. The statistical significance was estimated by One-way ANOVA. k Representative immunofluorescence (left) (20× magnification; scale bar, 100 μm) of TAs of young (1.5-month-old, n = 6) and old (18-month-old, n = 7) mdx mice. Infiltrating adipocytes (arrow heads) were revealed using antibodies against perilipin-1 while fibers were stained using phalloidin-488. Bar plot (right) reporting the fraction of perilipin positive area in young and old mdx TAs. Statistical significance was estimated by Student's t test. l Immunoblot showing the protein level of non-phospho (active) β-catenin, pGSK3 (Ser9) and Vinculin (n = 5) in FAPs from young (1.5-month-old) and old (18-month-old) mdx mice. m Bar plots showing the densitometric analysis for non-phospho (active) β-catenin and pGSK3 (Ser9) normalized over Vinculin, respectively. n Quantitative PCR (qPCR) for Ctnnb1 from FAPs purified from young (1.5-month-old) and old (18-month-old) mdx mice (n = 3). Statistical significance was estimated by Student's t test. All data are represented as mean ± SEM and the statistical significance is defined as *p < 0.05; **p < 0.01; ***p < 0.001.
Fig. 4
Fig. 4. GSK3 inhibition promotes MuSC self-renewal and boosts the promyogenic ability of FAPs.
a Representative immunoblot showing the protein level of non-phospho (active) β-catenin and vinculin (n = 3) in MuSCs undergoing spontaneous myogenic differentiation in the presence of vehicle or 20 nM LY2090314. b Bar plot showing the densitometric analysis for non-phospho (active) β-catenin normalized over vinculin. c Quantitative PCR (qPCR) for Ctnnb1 in MuSCs undergoing spontaneous myogenic differentiation in the presence of vehicle or 20 nM LY2090314 (n = 3). The statistical significance was estimated by One-way ANOVA. d Representative Pax7/MyoD immunostaining (20× magnification; scale bar, 100 μm) in MuSCs after 24 h of culturing in the presence of vehicle or 20 nM LY2090314 (n = 3). e Bar plot showing the ratio of Pax7-, Pax7/MyoD-, and MyoD-positive cells. The statistical significance was estimated by two-way ANOVA. f Representative immunoblot showing the protein level of Pax7 in MuSCs undergoing spontaneous myogenic differentiation (n = 3). g Bar plot showing the densitometric values of Pax7 over vinculin. The statistical significance was estimated by two-way ANOVA. h Representative EdU labelling (left panel, 20× magnification; scale bar, 100 μm) in MuSCs undergoing spontaneous myogenic differentiation in the presence of vehicle or 20 nM LY2090314 (n = 3). Representative immunostaining against MyoG (central panel, 20× magnification; scale bar, 100 μm) in MuSCs undergoing spontaneous myogenic differentiation in the presence of vehicle or 20 nM LY2090314 (n = 3). Representative immunostaining against MyHC (left panel, 20× magnification; scale bar, 100 μm) in MuSCs undergoing spontaneous myogenic differentiation in the presence of vehicle or 20 nM LY2090314 (n = 3). Nuclei (blue) were revealed using Hoechst 33342. i Bar plot reporting the ratio of EdU-positive MuSCs. The statistical significance was estimated by two-way ANOVA. j Bar plot reporting the ratio of MyoG-positive MuSCs. The statistical significance was estimated by two-way ANOVA. k Bar plot reporting the percentage of fusion index of MuSCs-derived myotubes. The statistical significance was estimated by two-way ANOVA. l Quantitative PCR (qPCR) for Myomaker in MuSCs undergoing spontaneous myogenic differentiation in the presence of vehicle or 20 nM LY2090314 (n = 3). The statistical significance was estimated by One-way ANOVA. m Representative MyHC immunostaining (red, 20× magnification; scale bar, 100 μm) in MuSCs undergoing spontaneous myogenic differentiation in the presence of FAPs treated/untreated with 20 nM LY2090314 in the presence/absence of neutralizing anti-Follistatin antibodies (n = 3). n Bar plot reporting the percentage of fusion index of MuSCs-derived myotubes in each condition. The statistical significance was estimated by two-way ANOVA. Nuclei (blue) were revealed using Hoechst 33342. All data are represented as mean ± SEM and the statistical significance is defined as *p < 0.05; **p < 0.01; ***p < 0.001.
Fig. 5
Fig. 5. FAPs are the main source of Wnt ligands in the muscle stem cell niche.
a t-SNE map of cell populations identified upon combining single-cell RNA sequencing experiments from Giordani et al. with those of Tabula Muris consortium. Data processing yielded nine clusters that were assigned to specific cell populations on the basis of their expression profiles. b t-SNE maps showing the expression of WNT ligands at single-cell resolution. c t-SNE maps showing the expression of canonical and noncanonical WNT receptors at single-cell resolution. d Heatmap representing the relative abundance of specific WNT ligands and receptor transcripts RNA in each cell population. e Chord diagram representing the relations between WNT ligands and their receptors as stored in the SIGNOR database. The relations for WNT11, WNT2, and WNT5a are highlighted in blue, green, and red, respectively. f Network describing the interaction between WNTs (red) with their receptors (blue) in FAPs. Node sizes are proportional to the transcript expression levels while edge thickness is related to the SIGNOR confidence score for the reported interaction.
Fig. 6
Fig. 6. Wnt5a expression is impaired in mdx FAPs.
a Network showing the casual signaling relations between signaling proteins in the Wnt and Insulin pathways. FAP-specific signaling information were retrieved from Myo-REG. b Heatmap showing the attractors in the simulation of the Wnt/Ins pathway. c Scatter plot showing the correlation between the log2 differences of the genes that were observed both in the Marinkovic et al. and Malecova et al. RNAseq datasets. d Scatter plot showing the correlation between the common genes between the Marinkovic et al. and Malecova et al. RNAseq datasets that are associate to Wnt signaling pathway according to UniProt Keywords. Genes in red are reported as significant in both datasets. e Networks reporting the signaling relations, retrieved from SIGNOR, of Wnt protein products Marinkovic et al. and Malecova et al. datasets. Nodes are color coded according to the Log2 fold change difference between mdx and wt FAPs.
Fig. 7
Fig. 7. Wnt5a restrains FAP adipogenesis by activating the canonical β-catenin signaling.
a Representative ORO staining (20× magnification, scale bar:100 μm) of dystrophic FAPs differentiated in the presence of 200 ng/ml Wnt5a (n = 3). Control samples were incubated with vehicle. Nuclei (blue) were revealed with Hoechst 33342. b Bar plot reporting the fraction of FAP-derived adipocytes in both conditions described in a. The statistical significance was estimated by student t test. c Western blot showing the protein level of Vinculin, PPARγ1/2, and the active β-catenin in FAPs undergoing adipogenesis (n = 3). d Bar plots showing the densitometric values, normalized to Vinculin, of PPARγ1/2, and active β-catenin in each condition. e Schematic representation describing the WNT5a pathway in FAPs. f Representative ORO staining (20x magnification, scale bar:100 μm) of dystrophic FAPs differentiated in the presence of 200 ng/ml Wnt5a or in combination with 50 μm PNU-74654 (n = 3). g Bar plot reporting the fraction of FAP-derived adipocytes in both conditions. The statistical significance was estimated by one-way ANOVA. h Western blot showing the protein level of Actin and PPARγ1/2 (n = 3) upon treatment with 200 ng/ml Wnt5a or in combination with 50 μm PNU-74654 (n = 3). i Bar plots showing the densitometric values of PPARγ1/2, normalized to Actin, in each condition. The statistical significance was estimated by one-way ANOVA. All data are represented as mean ± SEM and the statistical significance is defined as *p < 0.05; **p < 0.01; ***p < 0.001.

References

    1. Besson V, Smeriglio P, Wegener A, Relaix F, Nait Oumesmar B, Sassoon DA, et al. PW1 gene/paternally expressed gene 3 (PW1/Peg3) identifies multiple adult stem and progenitor cell populations. Proc Natl Acad Sci USA. 2011;108:11470–5. - PMC - PubMed
    1. Christov C, Chrétien F, Abou-Khalil R, Bassez G, Vallet G, Authier F-J, et al. Muscle satellite cells and endothelial cells: close neighbors and privileged partners. Mol Biol Cell. 2007;18:1397–409. - PMC - PubMed
    1. Dellavalle A, Maroli G, Covarello D, Azzoni E, Innocenzi A, Perani L, et al. Pericytes resident in postnatal skeletal muscle differentiate into muscle fibres and generate satellite cells. Nat Commun. 2011;2:499. - PubMed
    1. Du H, Shih C-H, Wosczyna MN, Mueller AA, Cho J, Aggarwal A, et al. Macrophage-released ADAMTS1 promotes muscle stem cell activation. Nat Commun. 2017;8:669. - PMC - PubMed
    1. Fry CS, Johnson DL, Ireland ML, Noehren B. ACL injury reduces satellite cell abundance and promotes fibrogenic cell expansion within skeletal muscle: ACL injury induces muscle maladaptations. J Orthop Res. 2017;35:1876–85. - PMC - PubMed

Publication types

LinkOut - more resources