. 2020 Jun;26(6):849-854.
doi: 10.1038/s41591-020-0895-3. Epub 2020 May 7.

Modeling shield immunity to reduce COVID-19 epidemic spread

Affiliations

Modeling shield immunity to reduce COVID-19 epidemic spread

Joshua S Weitz et al. Nat Med. 2020 Jun.

Abstract

The COVID-19 pandemic has precipitated a global crisis, with more than 1,430,000 confirmed cases and more than 85,000 confirmed deaths globally as of 9 April 20201-4. Mitigation and suppression of new infections have emerged as the two predominant public health control strategies5. Both strategies focus on reducing new infections by limiting human-to-human interactions, which could be both socially and economically unsustainable in the long term. We have developed and analyzed an epidemiological intervention model that leverages serological tests6,7 to identify and deploy recovered individuals8 as focal points for sustaining safer interactions via interaction substitution, developing what we term 'shield immunity' at the population scale. The objective of a shield immunity strategy is to help to sustain the interactions necessary for the functioning of essential goods and services9 while reducing the probability of transmission. Our shield immunity approach could substantively reduce the length and reduce the overall burden of the current outbreak, and can work synergistically with social distancing. The present model highlights the value of serological testing as part of intervention strategies, in addition to its well-recognized roles in estimating prevalence10,11 and in the potential development of plasma-based therapies12-15.


Conflict of interest statement

Competing interests

The authors declare no competing interests.

Figures

Extended Data Fig. 1 |
Extended Data Fig. 1 |. Impact of shielding mechanisms on final size outcomes in a SIR model.
In each case, the epidemic size is plotted (on the y-axis) against the shielding strength, α (x-axis) given R0=2.5. The three curves denote shielding of recovered individuals by a factor of 1 + α (black) as described in the main text, a ‘flexible’ shielding mechanism where the total contact rate is constrained, but recovered individuals vary in their contact rates during the epidemic, and a ‘fixed’ shielding mechanism where the total contact rate is constrained, but recovered individuals have fixed contact rates during the epidemic. See Methods for details.
Extended Data Fig. 2 |
Extended Data Fig. 2 |. Model schematic.
We consider a population susceptible individuals (S), interacting with infected (Isym, Iasym) and recovered (R) individuals. Interactions between susceptible and infectious individuals lead to new exposed cases (E). Exposed individuals undergo a period of latency before disease onset, which are symptomatic (Isym) or asymptomatic (Iasym). A subset of symptomatic individuals require hospitalization (Ih) which we further categorize as acute/subcritical (Ihsub) and critical (Ihcri) cases, the latter of which can be fatal. Individuals who recover can then mitigate the rate of new exposure cases by interaction substitution - what we denote as immune shielding - by modulating the rate of susceptible-infectious interactions by fasym(α, R) and fsym(α, R) respectively, where fasym(α,R)=S(a)Iasym,totNtot+αRshields. Here, the tot subscript denotes the total number of cases across all ages, that is Isym,tot=aIsym(a)..
Extended Data Fig. 3 |
Extended Data Fig. 3 |. Impact of demography on the intervention benefits of immune shielding.
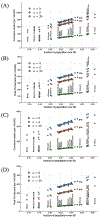
Panels depict a high (a, b) and low (c, d) R0 scenario. States are ordered by fraction of population above 60 (x-axis) with the baseline, low and high shielding scenarios shown; labels of some but not all states are shown for clarity.
Extended Data Fig. 4 |
Extended Data Fig. 4 |. Impact of asymptomatic fraction and shielding on the total deaths and the peak ICU cases.
Panels depict a constant R0 (low scenario panel a, high scenario panel b) and a dynamic R0 (panel c). The fraction of asymptomatic p is the same for all ages in the three panels. Shielding offers improvement to outcomes, particularly at lower asymptomatic fractions.
Extended Data Fig. 5 |
Extended Data Fig. 5 |. Age distribution assumptions of the asymptomatic fraction.
The profiles of p correspond to three different average p: p=0.5, p=0.75, and p=0.9.
Extended Data Fig. 6 |
Extended Data Fig. 6 |. COVID-19 dynamics in a baseline case without interventions compared to two shielding scenarios and three asymptomatic fraction cases.
The shield scenarios (α=0 and α=20) and three age-distributed asymptomatic fraction values (p=0.5, p=0.75 and p=0.9) are evaluated for both a high scenario (R0=2.33 - panel a) and low scenario (R0=1.57, panel b). The impact of immune shielding is robust to observed age-specific variation p, that is, leading to significant decreases of projected deaths and ICU cases.
Extended Data Fig. 7 |
Extended Data Fig. 7 |. COVID-19 dynamics given variation in immune duration.
Panels denote simulations with high (a) and low (b) R0 scenarios. We compared a baseline case without interventions to two shielding scenarios (α=2 and α=20) with a mean immunity duration of 2 months. Immune shielding can still significantly reduce the number of deaths and ICU beds needed for a finite immunity duration.
Extended Data Fig. 8 |
Extended Data Fig. 8 |. Comparing the effectiveness of shielding given variation in immunity duration.
Simulations correspond to high (a) and low (b) R0 scenarios. Shielding is effective at reducing epidemic burden compared to the baseline with no shielding for a wide range of immunity duration. When immunity lasts approximately 4 months or less, re-infection of recovered individuals leads to an increase in the number of deaths and total cases.
Extended Data Fig. 9 |
Extended Data Fig. 9 |. COVID-19 dynamics given optimized age-dependent shield deployment.
Simulations in the two shielding scenarios (α=2 and α=20) are compared to the scenarios with optimized age-dependent shield deployment for the same values of α with the baseline case included for reference. The results are displayed for both high (a) and low (b) R0 scenarios. The optimal deployment significantly reduces the total death count and the need for ICU beds for both α=2 and α=20.
Extended Data Fig. 10 |
Extended Data Fig. 10 |. Optimal shielding concentration for all age classes.
Panels denote high (A) and low (B) R0 scenarios. The optimal shielding concentrations (for both scenarios) are obtained via solving an optimization problem with low and high shielding levels (see Methods). The optimal shielding concentration (θa/fa is larger for classes with a higher age, which would reduce casualties as the older population is disproportionately affected by COVID-19.
Fig. 1 |
Fig. 1 |. Simplified schematic of intervention serology via shield immunity.
a, Population dynamics of susceptible, infectious and recovered, in which recovered individuals reduce contact between susceptible and infectious individuals. Arrows denote flows between population-level compartments. b, Individual views of the baseline scenario (left) and shielding scenario (right), in which the identification, designation and deployment of recovered individuals is critical to enabling susceptible–recovered and infectious–recovered interactions to replace susceptible–infectious interactions. Bonds denote interactions between individuals. In the ‘Shield immunity’ panel, the icon in the recovered individuals denotes the identification of individuals with protective antibodies, and hence the enhanced contribution of such individuals to shield immunity in contrast to the ‘Baseline’ panel.
Fig. 2 |
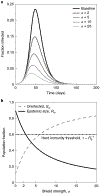
Fig. 2 |. Shield immunity dynamics in a SIR model.
a, Infectious case dynamics with different levels of shielding, α. b, Final state of the system as a function of α. In both panels, β = 0.25 (transmission rate 1/days) and γ = 0.1 (recovery rate 1/days). S, susceptible individuals; I, infectious individuals; R, recovered individuals.
Fig. 3 |
Fig. 3 |. COVID-19 dynamics in a baseline scenario without interventions compared with two shield immunity scenarios, α = 2 and α = 20, including deaths, ICU beds needed and age distribution of fatalities.
a,b, See Methods and Extended Data Fig. 1 for more details on the alternative scenarios with high transmission (R0=2.33) (a) and low transmission (R0=1.57) (b).
Fig. 4 |
Fig. 4 |. Impacts of combined interventions of shielding and social distancing in the high-transmission scenario.
a, Fractional reduction in deaths compared to baseline for the high-transmission scenario (R0=2.33). b, Peak level of ICU beds needed per 100,000 individuals on a given day during the epidemic for the high-transmission scenario (R0=2.33). The red line denotes 25 ICU beds per 100,000 individuals as a demarcation point for surge capacity.

Update of

Comment in

References

    1. Fauci AS, Lane HC & Redfield RR Covid-19—navigating the uncharted. N. Engl. J. Med 382, 1268–1269 (2020). - PMC - PubMed
    1. Li Q et al. Early transmission dynamics in Wuhan, China, of novel coronavirus-infected pneumonia. N. Engl. J. Med 382, 1199–1207 (2020). - PMC - PubMed
    1. Zhou P et al. A pneumonia outbreak associated with a new coronavirus of probable bat origin. Nature 579, 270–273 (2020). - PMC - PubMed
    1. World Health Organization Coronavirus Disease 2019 (COVID-19) Situation Report 70 (2020); https://www.who.int/docs/default-source/coronaviruse/situation-reports/2...
    1. Ferguson N et al. Impact of Non-Pharmaceutical Interventions (NPIs) to Reduce COVID19 Mortality and Healthcare Demand (Imperial College, 2020); https://www.imperial.ac.uk/media/imperial-college/medicine/sph/ide/gida-... - PMC - PubMed

Publication types

MeSH terms