Use of Small-Area Estimates to Describe County-Level Geographic Variation in Prevalence of Extreme Obesity Among US Adults
- PMID: 32383746
- PMCID: PMC7210484
- DOI: 10.1001/jamanetworkopen.2020.4289
Use of Small-Area Estimates to Describe County-Level Geographic Variation in Prevalence of Extreme Obesity Among US Adults
Abstract
Importance: The prevalence of extreme obesity continues to increase among adults in the US, yet there is an absence of subnational estimates and geographic description of extreme obesity. This shortcoming prevents a thorough understanding of the geographic distribution of extreme obesity, which in turn limits the ability of public health agencies and policy makers to target areas with a known higher prevalence.
Objectives: To use small-area estimation to create county-level estimates of extreme obesity in the US and apply spatial methods to identify clusters of high and low prevalence.
Design, setting, and participants: A cross-sectional analysis was conducted using multilevel regression and poststratification with data from the 2012 Behavioral Risk Factor Surveillance System and the US Census Bureau to create prevalence estimates of county-level extreme obesity (body mass index ≥40 [calculated as weight in kilograms divided by height in meters squared]). Data were included on adults (aged ≥18 years) living in the contiguous US. Analysis was performed from June 4 to December 28, 2018.
Main outcomes and measures: Multilevel logistic regression models estimated the probability of extreme obesity based on individual-level and area-level characteristics. Census counts were multiplied by these probabilities and summed by county to create county-level prevalence estimates. Moran index values were calculated to assess spatial autocorrelation and identify spatial clusters of hot and cold spots. Estimates of moderate obesity were obtained for comparison.
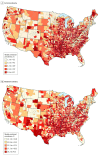
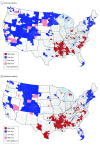
Results: Overall, the weighted prevalence of extreme obesity was 4.0% (95% CI, 3.9%-4.1%) and the prevalence of moderate obesity was 23.7% (95% CI, 23.4%-23.9%). County-level prevalence of extreme obesity ranged from 1.3% (95% CI, 1.3%-1.3%) to 15.7% (95% CI, 15.3%-16.0%). The Pearson correlation coefficient comparing model-predicted estimates with direct estimates was 0.81 (P < .001). The Moran index I score was 0.35 (P < .001), indicating spatial clustering. Significant clusters of high and low prevalence were identified. Hot spots indicating clustering of high prevalence of extreme obesity in several regions, including the Mississippi Delta region and the Southeast, were identified, as well as clusters of low prevalence in the Rocky Mountain region and the Northeast.
Conclusions and relevance: Substantial geographic variation was identified in the prevalence of extreme obesity; there was considerable county-level variation even in states generally known as having high or low prevalence of obesity. The results suggest that extreme obesity prevalence demonstrates spatial dependence and clustering and may support the need for substate analysis and benefit of disaggregation of obesity by group. Findings from this study can inform local and national policies seeking to identify populations most at risk from very high body mass index.
Conflict of interest statement
Figures


References
-
- Fryar CD, Carroll MD, Ogden CL Prevalence of overweight, obesity, and extreme obesity among adults aged 20 and over: United States, 1960-1962 through 2013-2014. National Center for Health Statistics; 2016.
-
- World Health Organization Obesity: preventing and managing the global epidemic. World Health Organization. Published 2000. Accessed June 8, 2017. https://www.who.int/nutrition/publications/obesity/WHO_TRS_894/en/ - PubMed

