. 2020 Jun 19;48(11):6340-6352.
doi: 10.1093/nar/gkaa335.

Regulation of mRNA export through API5 and nuclear FGF2 interaction

Affiliations

Regulation of mRNA export through API5 and nuclear FGF2 interaction

Seoung Min Bong et al. Nucleic Acids Res. .

Abstract

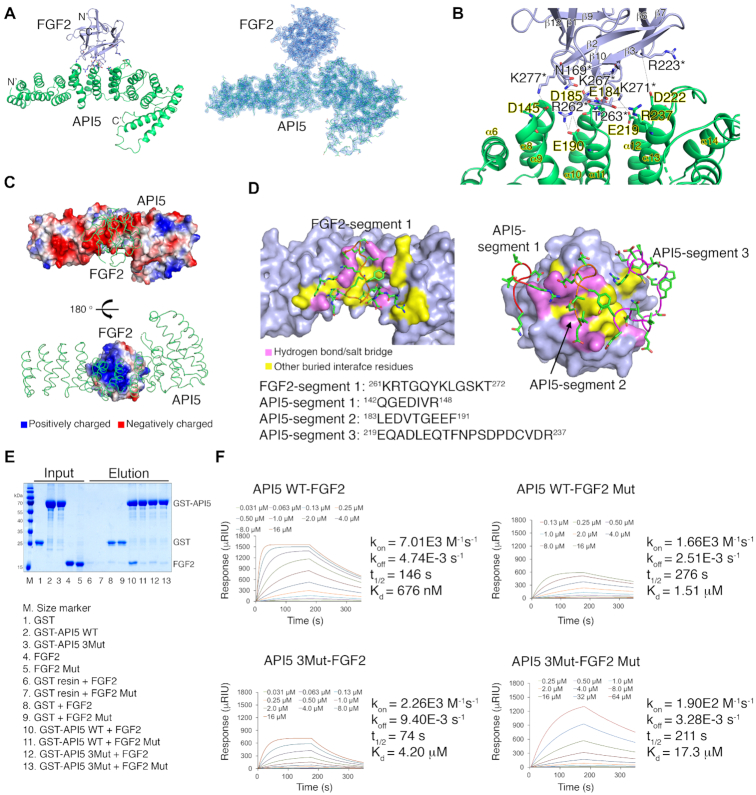
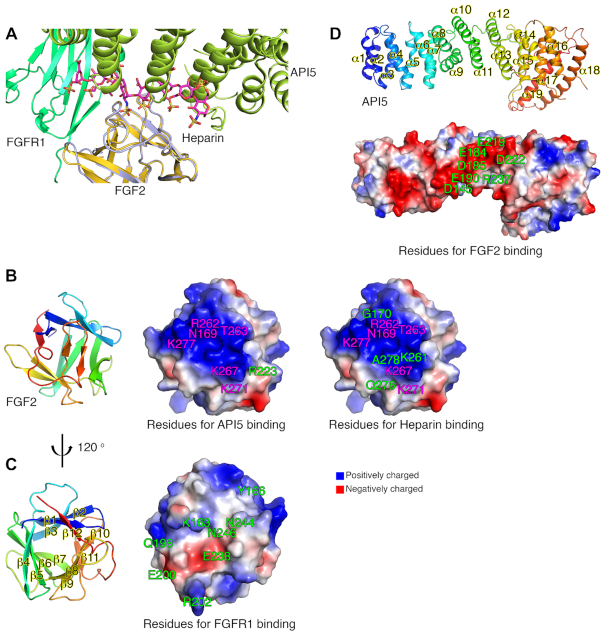
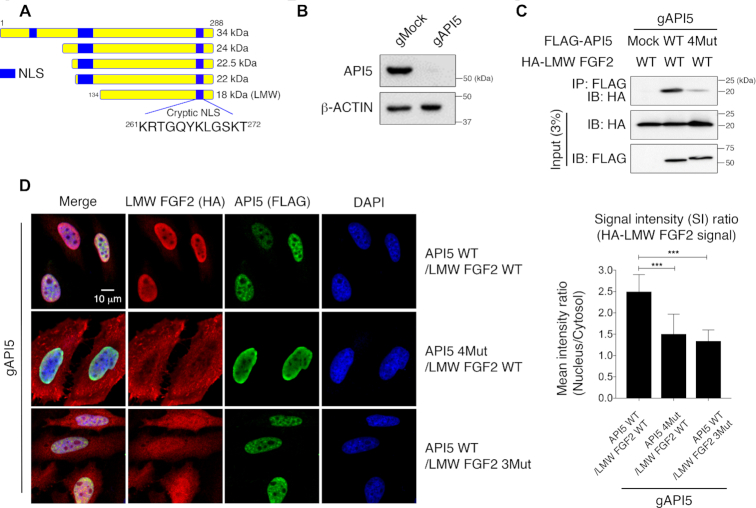
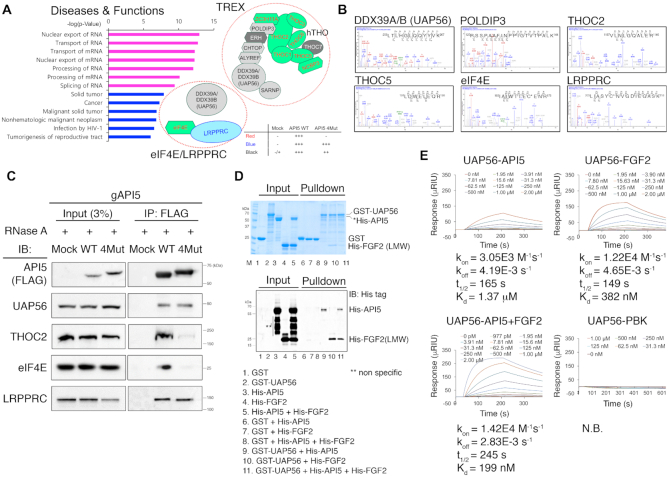
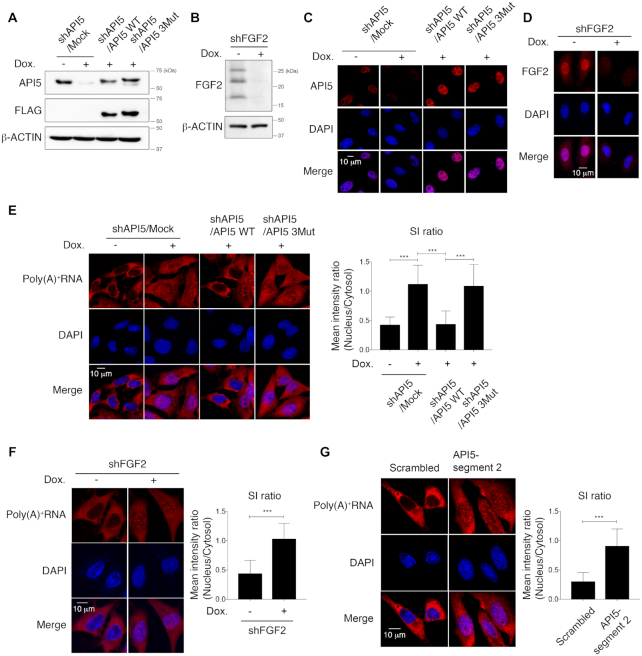
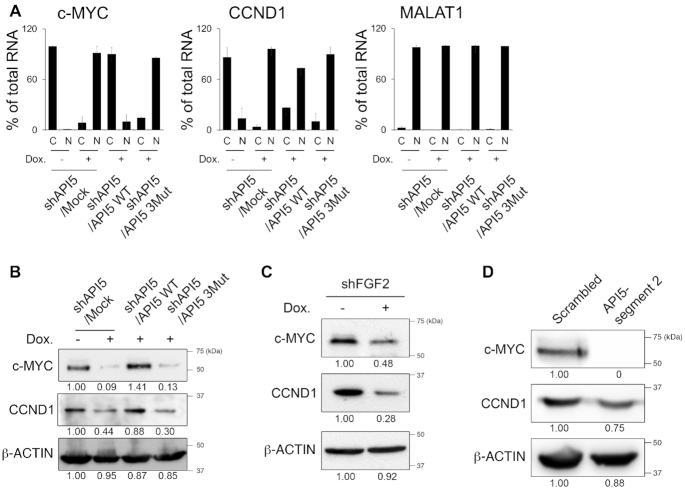
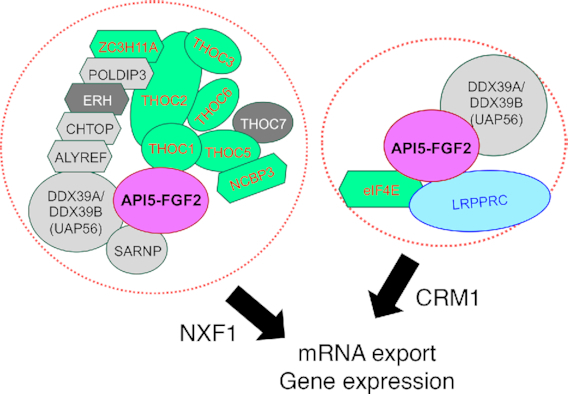
API5 (APoptosis Inhibitor 5) and nuclear FGF2 (Fibroblast Growth Factor 2) are upregulated in various human cancers and are correlated with poor prognosis. Although their physical interaction has been identified, the function related to the resulting complex is unknown. Here, we determined the crystal structure of the API5-FGF2 complex and identified critical residues driving the protein interaction. These findings provided a structural basis for the nuclear localization of the FGF2 isoform lacking a canonical nuclear localization signal and identified a cryptic nuclear localization sequence in FGF2. The interaction between API5 and FGF2 was important for mRNA nuclear export through both the TREX and eIF4E/LRPPRC mRNA export complexes, thus regulating the export of bulk mRNA and specific mRNAs containing eIF4E sensitivity elements, such as c-MYC and cyclin D1. These data show the newly identified molecular function of API5 and nuclear FGF2, and provide a clue to understanding the dynamic regulation of mRNA export.


Figures

Figure 1.
Figure 1.
Crystal structure of the API5–FGF2 complex and validation of the API5–FGF2 interaction. (A) Left, overall structure of the API5–FGF2 complex. The N- and C-termini of each protein are indicated by N’ and C’, respectively. Structure of API5 are colored in green and the FGF2 structure are colored in light blue. Right, electron density map of the API5–FGF2 complex. (B) Detailed view of the protein-protein interaction interface. Residues participating in the hydrogen bonds and salt bridges in the protein interaction are shown. Residues of FGF2 are marked with asterisks. (C) Electrostatic surface potential of API5 and FGF2. Positively charged residues are colored in blue, negatively charged residues are colored in red, and neutral residues are represented in white. (D) Segments of FGF2 and API5 participating in the interaction. One major basic segment from FGF2 (FGF2-segment 1) and three major acidic segments from API5 (API5-segment1, API5-segment 2, and API5-segment3) participate in the protein-protein interaction. In the API5–FGF2 interaction interface, the residues involved in hydrogen bonding or salt bridges are colored in pink and other buried interface residues are colored in yellow. (E) GST pulldown with purified recombinant GST-API5 and His-FGF2. Protein bands were visualized by the Coomassie blue staining method. (F) SPR experiments with purified recombinant His-API5 and His-FGF2. The kon is the association rate constant (M−1 s−1), koff is the dissociation rate constant (s−1), t1/2 is the half-life of complex (s), and Kd is the equilibrium dissociation constant (M).
Figure 2.
Figure 2.
Structural analysis of the API5–FGF2 complex. (A) Detailed view of the structural superposition of API5–FGF2 on FGF2–FGFR1–heparin (PDB entry 1FQ9) with the FGF2 structure as the central figure. The heparin molecule in the FGF2–FGFR1–heparin complex is colored in magenta and API5 from the API5–FGF2 complex is drawn in limon. FGFR1 is drawn in green. FGF2 in the FGF2–FGFR1–heparin complex is drawn in yellow orange and FGF2 in the API5–FGF2 complex is drawn in light blue. (B) Residues of FGF2 forming hydrogen bonds or salt bridges with API5 or heparin. Residues of FGF2 involved in both API5 and heparin binding are colored in magenta, and residues of FGF2 participating either API5 or heparin interaction are colored in green. (C) Residues of FGF2 forming hydrogen bonds or salt bridges with FGFR1 are colored in green. (D) Residues of API5 forming hydrogen bonds or salt bridges with FGF2. Overall structures of API5 and FGF2 are shown to present the orientation of each molecule. All interface residues of FGF2 with API5, heparin and FGFR1 are summarized in Supplementary Tables S4 and S5.
Figure 3.
Figure 3.
Cellular localization of LMW FGF2 by API5. (A) Schematic representation of five human FGF2 isoforms and the position of the cryptic NLS region. The cryptic NLS corresponds to the FGF2-segment 1. (B) Western blot validation of HeLa cells after API5 knockout (gAPI5) by the CRISPR/Cas9 system. (C) Monitoring of intracellular interactions of API5 and LMW FGF2 by co-immunoprecipitation assay. Transiently co-expressed FLAG-API5 (WT or 4Mut) and HA-tagged LMW FGF2 WT in API5 knockout (gAPI5) HeLa cells were used. (D) Cellular localization of API5 and LMW FGF2 observed by confocal microscopy and quantified mean signal intensity (SI) ratios of nucleus/cytosol (n = 46 for each sample). The error bars represent the mean ± SD, ***P < 0.001 (Student's t-test).
Figure 4.
Figure 4.
API5 is associated with the mRNA export machineries. (A) Left, disease–function annotations and pathways analyses of the API5 interaction partner list derived from immunoprecipitation/proteomics analysis using the IPA program. Top 7 pathways (P < 10−9) were shown in magenta. Right, API5 interaction partners that are members of the human TREX or eIF4E/LRPPRC mRNA export complex. API5–FGF2 interaction-dependent API5 interaction partners are shown in red text with green background (‘WT only’ in Table 2). API5–FGF2 interaction-independent API5 interaction partner is shown in blue text (‘All’ in Table 2). The proteins shown in black text are API5 interaction partners partially dependent on API5–FGF2 interaction (‘WT ↑’ in Table 2). ERH and THOC7 (in white text with grey background) which are known members of the TREX complex were not identified positive in our proteomics analysis. (B) Representative mass spectrometry data of identified API5-binding proteins related to the mRNA export machineries. (C) Validation of the interaction between API5 and mRNA export machinery components by immunoprecipitation. API5 knockout (gAPI5) and reconstituted (WT or 4Mut) HeLa cells were used. RNase A was used during immunoprecipitation experiments to exclude any possible RNA-mediated interactions. (D) GST pulldown experiments with purified recombinant GST-UAP56, His-API5 and His-LMW FGF2 to monitor the direct interactions between UAP56 and API5, UAP56 and FGF2, and UAP56 and the API5–FGF2 complex. Protein bands were visualized both by Coomassie blue staining (up) and western blot analysis (down). Due to the contaminant protein bands of similar molecular weight to His-API5 (Marked in an asterisk, *), the His-API5 bands could not be distinguished clearly by Coomassie blue staining. Therefore, the His-API5 and His-FGF2 bands were validated by western blot with Anti-His tag antibody. The multiple bands marked in a double asterisk (**; lanes 3, 4 and 5) are likely to be non-specific bands. (E) Monitoring direct interactions between UAP56 and API5, UAP56 and FGF2, and UAP56 and the API5–FGF2 complex by SPR experiments. The concentrations of each analyte protein are indicated. The SPR experiment with UAP56 and PBK (PDZ-binding kinase) is the negative control (N.B.; no binding).
Figure 5.
Figure 5.
API5 functions in bulk mRNA export. (A) Western blot analysis of API5-depleted and API5 WT- and 3Mut-reconstituted HeLa cells. Dox., doxycycline. (B) Western blot analysis of FGF2-depleted HeLa cells. β-Actin was used as a loading control. (C) Determination of API5 depletion and reconstitution of API5 WT or 3Mut by immunocytochemistry. (D) Determination of FGF2 (HMW and LMW FGF2) depletion by immunocytochemistry. (E) Bulk mRNA export was monitored by RNA-FISH using an oligo(dT) probe following API5 depletion (shAPI5/Mock) and reconstitution (API5 WT or API5 3Mut). Cells were treated with actinomycin D for 2 h before the FISH experiment to reduce nascent RNA signals. The mean SI ratios of the nuclear/cytosolic fractions were quantified (***P < 0.001, n = 40 for each sample). (F) Same RNA-FISH experiment with FGF2 depletion (***P < 0.001, n = 51 for each sample). (G) Same RNA-FISH experiment after disruption of the API5–FGF2 interaction by treatment with lentiviruses expressing API5-segment 2 peptide (***P < 0.001, n = 50 for each sample).
Figure 6.
Figure 6.
API5 functions in 4E-SE containing mRNA export. (A) RT-qPCR analysis of the subcellular levels of 4E-SE-containing mRNAs following API5 depletion and reconstitution. ‘C’ is the cytosolic fraction and ‘N’ is the nucleus fraction. (B) Protein levels were monitored by western blot analysis for the protein products of the representative 4E-SE-containing genes c-MYC and cyclin D1 following API5 depletion and reconstitution. (C) Western blot analysis showing the c-MYC and cyclin D1 levels following FGF2 depletion. (D) Western blot analysis showing the c-MYC and cyclin D1 levels after treatment with lentivirus expressing the API5-segment 2 peptide. Numbers below the western blots indicate the expression of proteins as measured by fold change.
Figure 7.
Figure 7.
Model of the API5–FGF2 function A model showing the function of API5–FGF2 in mRNA export and gene expression.

References

    1. Tewari M., Yu M., Ross B., Dean C., Giordano A., Rubin R.. AAC-11, a novel cDNA that inhibits apoptosis after growth factor withdrawal. Cancer Res. 1997; 57:4063–4069. - PubMed
    1. Cho H., Chung J.Y., Song K.H., Noh K.H., Kim B.W., Chung E.J., Ylaya K., Kim J.H., Kim T.W., Hewitt S.M. et al.. Apoptosis inhibitor-5 overexpression is associated with tumor progression and poor prognosis in patients with cervical cancer. BMC Cancer. 2014; 14:545. - PMC - PubMed
    1. Krejci P., Pejchalova K., Rosenbloom B.E., Rosenfelt F.P., Tran E.L., Laurell H., Wilcox W.R.. The antiapoptotic protein Api5 and its partner, high molecular weight FGF2, are up-regulated in B cell chronic lymphoid leukemia. J. Leukoc. Biol. 2007; 82:1363–1364. - PubMed
    1. Sasaki H., Moriyama S., Yukiue H., Kobayashi Y., Nakashima Y., Kaji M., Fukai I., Kiriyama M., Yamakawa Y., Fujii Y.. Expression of the antiapoptosis gene, AAC-11, as a prognosis marker in non-small cell lung cancer. Lung Cancer. 2001; 34:53–57. - PubMed
    1. Garcia-Jove Navarro M., Basset C., Arcondeguy T., Touriol C., Perez G., Prats H., Lacazette E.. Api5 contributes to E2F1 control of the G1/S cell cycle phase transition. PLoS One. 2013; 8:e71443. - PMC - PubMed

Publication types

MeSH terms