. 2020 Aug;69(8):1624-1635.
doi: 10.2337/db19-1226. Epub 2020 May 8.

Lactation Versus Formula Feeding: Insulin, Glucose, and Fatty Acid Metabolism During the Postpartum Period

Affiliations

Lactation Versus Formula Feeding: Insulin, Glucose, and Fatty Acid Metabolism During the Postpartum Period

Maria A Ramos-Roman et al. Diabetes. 2020 Aug.

Abstract

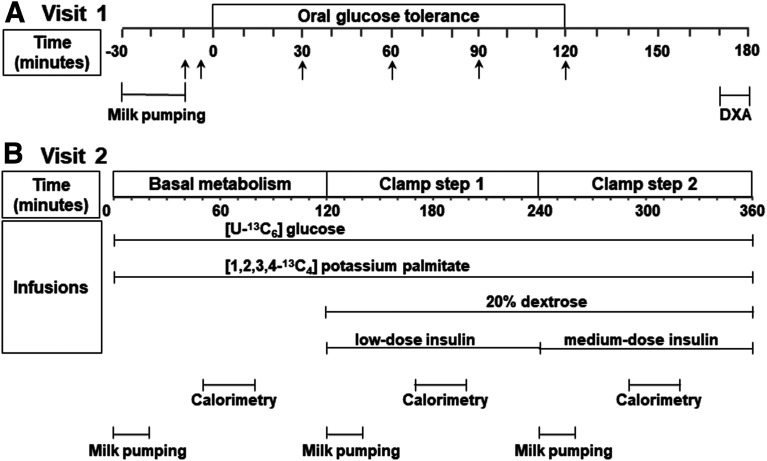
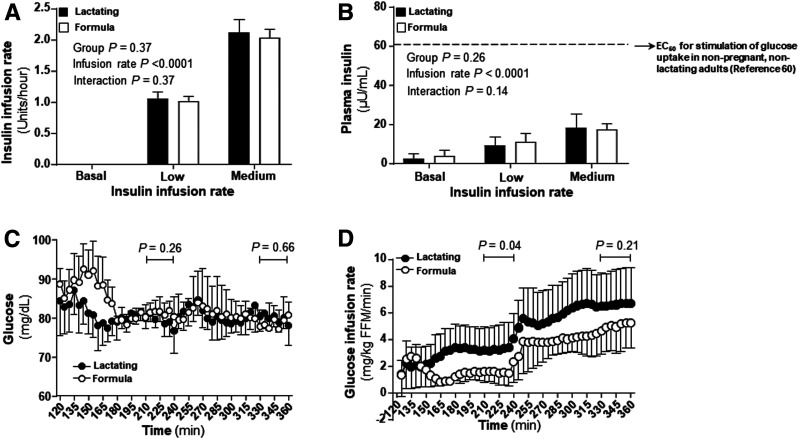
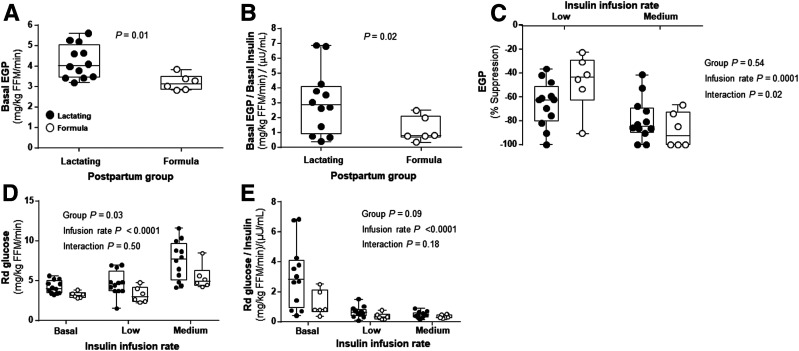
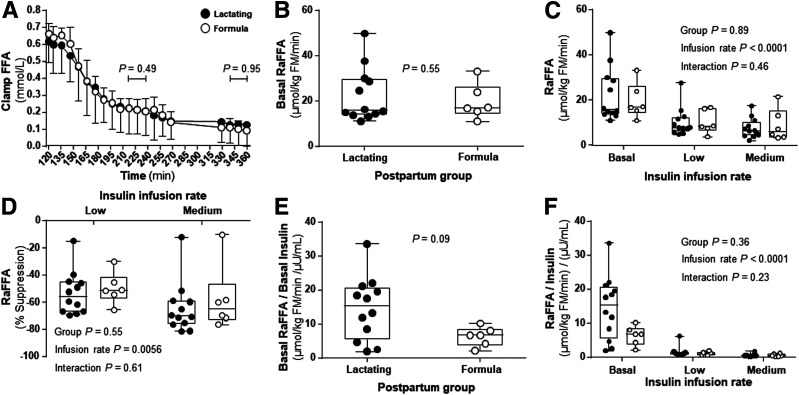
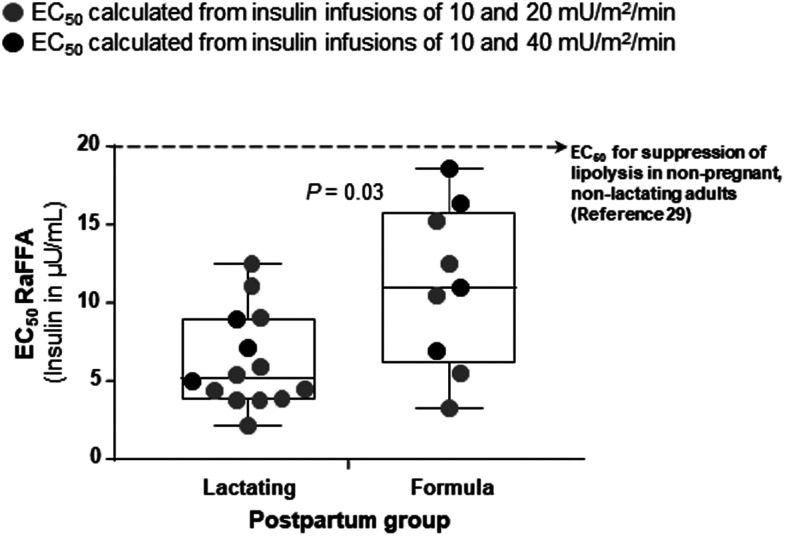
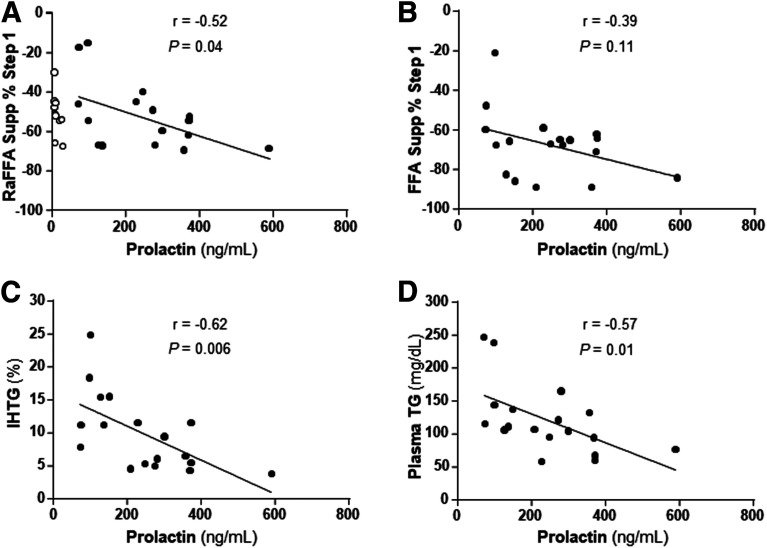
Milk production may involve a transient development of insulin resistance in nonmammary tissues to support redistribution of maternal macronutrients to match the requirements of the lactating mammary gland. In the current study, adipose and liver metabolic responses were measured in the fasting state and during a two-step (10 and 20 mU/m2/min) hyperinsulinemic-euglycemic clamp with stable isotopes, in 6-week postpartum women who were lactating (n = 12) or formula-feeding (n = 6) their infants and who were closely matched for baseline characteristics (e.g., parity, body composition, and intrahepatic lipid). When controlling for the low insulin concentrations of both groups, the lactating women exhibited a fasting rate of endogenous glucose production (EGP) that was 2.6-fold greater and a lipolysis rate that was 2.3-fold greater than the formula-feeding group. During the clamp, the groups exhibited similar suppression rates of EGP and lipolysis. In the lactating women only, higher prolactin concentrations were associated with greater suppression rates of lipolysis and lower intrahepatic lipid and plasma triacylglycerol concentrations. These data suggest that whole-body alterations in glucose transport may be organ specific and facilitate nutrient partitioning during lactation. Recapitulating a shift toward noninsulin-mediated glucose uptake could be an early postpartum strategy to enhance lactation success in women at risk for delayed onset of milk production.


Figures

Figure 1
Figure 1
Research protocols. A: Visit 1. Arrows indicate times of blood draws. B: Visit 2. DXA, dual-energy X-ray absorptiometry.
Figure 2
Figure 2
Insulin infusion rate, insulin and glucose concentrations, and glucose infusion rate. A: Insulin infusion rates, insulin and glucose concentrations, and glucose infusion rates. B: Insulin concentrations during the clamp compared with literature values (denoted by the top dashed line) for the mean insulin concentration that will half maximally stimulate glucose uptake in nonpregnant, nonlactating adults (60). C: Glucose concentrations during the clamp. D: Glucose infusion rates during the clamp. Data are mean ± SD. Filled bars and filled circles represent lactating women. Open bars and open circles represent formula-feeding women.
Figure 3
Figure 3
EGP, EGP suppression, and whole-body glucose disposal. A: Basal EGP without adjustment for basal insulin concentration. B: Basal EGP with adjustment for basal insulin concentration. C: EGP suppression. D: Rd glucose without normalization for insulin concentrations at basal state and at low and medium insulin infusion rates. E: Rd glucose with normalization for insulin concentrations at basal state and at low and medium insulin infusion rates. Data are mean ± SD for lactating (n = 12, filled circles) and formula-feeding (n = 6, open circles) women.
Figure 4
Figure 4
Hyperinsulinemic-euglycemic clamp FFA concentrations and rates of lipolysis. A: FFA during the clamp. B: RaFFA in the basal state. C: RaFFA during clamp conditions. D: RaFFA suppression. E: RaFFA adjusted for insulin in the basal state. F: RaFFA adjusted for insulin during clamp conditions. Data are mean ± SD for lactating (n = 12, filled circles) and formula-feeding (n = 6, open circles) women.
Figure 5
Figure 5
Insulin concentration EC50 for half maximal suppression of RaFFA. Data represent the EC50 RaFFA. Each gray-filled symbol represents datum from a lactating or formula-feeding woman who underwent the two-step hyperinsulinemic-euglycemic clamp at low and medium insulin levels (10 and 20 mU/m2/min, respectively). Only 16 of the 18 subjects are reported in the main analysis because 2 subjects did not reach 50% suppression of RaFFA with the medium-dose infusion. To increase the sample size and to determine whether the choice of clamp protocol insulin levels influenced the calculated EC50 RaFFA, an additional group of lactating and formula-feeding women (black-filled symbols) underwent an insulin infusion at 10 and 40 mU/m2/min insulin. Only 7 of the 10 subjects are reported from this additional group because 2 did not receive isotopes and 1 did not reach 50% suppression of RaFFA with the high-dose infusion. The box and whiskers graph represent minimum, maximum, median, and 25th and 75th percentiles. Lastly, the horizontal dotted line represents data from a published study (29) in nonpregnant, nonlactating women for comparison. In that study, the EC50 was calculated from a two-step clamp using insulin infusions of 0.25 and 2.5 mU/kg FFM/min (equivalent to 6 and 60 mU/m2/min when put in the units used in present study).
Figure 6
Figure 6
Relationships between prolactin and metabolic parameters. A: Data (filled circles) represent the relationship between prolactin concentration and suppression of RaFFA in lactating women during step 1 of the clamp (10 mU/m2/min insulin). Data from the nonlactating (formula-feeding, open circles) women were not included in these correlations (prolactin concentration = 11 ± 5 ng/mL). BD: Relationships between the lactating women’s prolactin concentrations and the percent suppression of FFA concentrations during step 1 of the clamp (B), intrahepatic TG levels (C), and fasting plasma TG concentrations (D).

References

    1. Catalano PM, Tyzbir ED, Wolfe RR, et al. . Carbohydrate metabolism during pregnancy in control subjects and women with gestational diabetes. Am J Physiol 1993;264:E60–E67 - PubMed
    1. Catalano PM, Huston L, Amini SB, Kalhan SC. Longitudinal changes in glucose metabolism during pregnancy in obese women with normal glucose tolerance and gestational diabetes mellitus. Am J Obstet Gynecol 1999;180:903–916 - PubMed
    1. Neville MC, Casey C, Hay WW Jr. Endocrine regulation of nutrient flux in the lactating woman. Do the mechanisms differ from pregnancy? In Nutrient Regulation During Pregnancy, Lactation, and Infant Growth. Allen L, King J, Lonnerdal B, Eds. New York, Plenum Press, 1994, p. 85–98 - PubMed
    1. McManus RM, Cunningham I, Watson A, Harker L, Finegood DT. Beta-cell function and visceral fat in lactating women with a history of gestational diabetes. Metabolism 2001;50:715–719 - PubMed
    1. Tigas S, Sunehag A, Haymond MW. Metabolic adaptation to feeding and fasting during lactation in humans. J Clin Endocrinol Metab 2002;87:302–307 - PubMed

Publication types