

Impact of climate and public health interventions on the COVID-19 pandemic: a prospective cohort study
- PMID: 32385067
- PMCID: PMC7259972
- DOI: 10.1503/cmaj.200920
Impact of climate and public health interventions on the COVID-19 pandemic: a prospective cohort study
Abstract
Background: It is unclear whether seasonal changes, school closures or other public health interventions will result in a slowdown of the current coronavirus disease 2019 (COVID-19) pandemic. We aimed to determine whether epidemic growth is globally associated with climate or public health interventions intended to reduce transmission of severe acute respiratory syndrome coronavirus 2 (SARS-CoV-2).
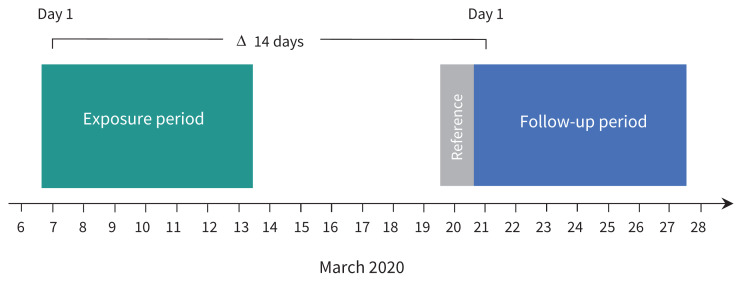
Methods: We performed a prospective cohort study of all 144 geopolitical areas worldwide (375 609 cases) with at least 10 COVID-19 cases and local transmission by Mar. 20, 2020, excluding China, South Korea, Iran and Italy. Using weighted random-effects regression, we determined the association between epidemic growth (expressed as ratios of rate ratios [RRR] comparing cumulative counts of COVID-19 cases on Mar. 27, 2020, with cumulative counts on Mar. 20, 2020) and latitude, temperature, humidity, school closures, restrictions of mass gatherings, and measures of social distancing during an exposure period 14 days previously (Mar. 7 to 13, 2020).
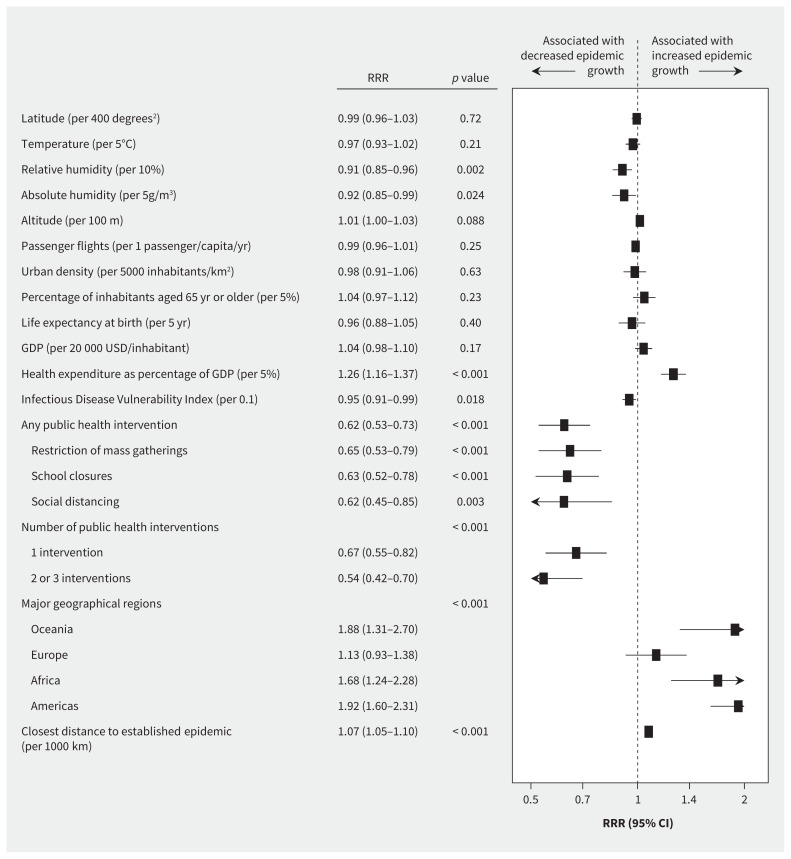
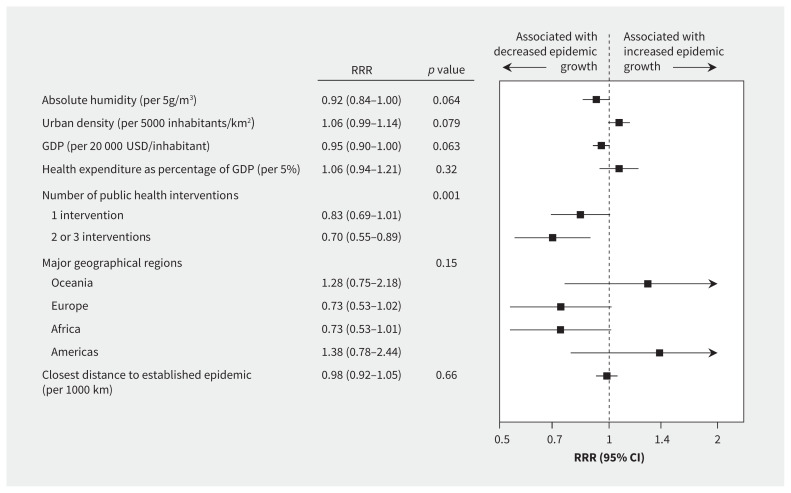
Results: In univariate analyses, there were no associations of epidemic growth with latitude and temperature, but weak negative associations with relative humidity (RRR per 10% 0.91, 95% confidence interval [CI] 0.85-0.96) and absolute humidity (RRR per 5 g/m3 0.92, 95% CI 0.85-0.99). Strong associations were found for restrictions of mass gatherings (RRR 0.65, 95% CI 0.53-0.79), school closures (RRR 0.63, 95% CI 0.52-0.78) and measures of social distancing (RRR 0.62, 95% CI 0.45-0.85). In a multivariable model, there was a strong association with the number of implemented public health interventions (p for trend = 0.001), whereas the association with absolute humidity was no longer significant.
Interpretation: Epidemic growth of COVID-19 was not associated with latitude and temperature, but may be associated weakly with relative or absolute humidity. Conversely, public health interventions were strongly associated with reduced epidemic growth.
© 2020 Joule Inc. or its licensors.
Conflict of interest statement
Competing interests: None declared.
Figures

References
-
- Filleul L, D’Ortenzio E, Kermarec F, et al. Pandemic influenza on Reunion Island and school closure. Lancet Infect Dis 2010;10:294–5. - PubMed
-
- Cauchemez S, Valleron A-J, Boëlle P-Y, et al. Estimating the impact of school closure on influenza transmission from Sentinel data. Nature 2008;452:750–4. - PubMed
-
- Couzin-Frankel J. Does closing schools slow the spread of coronavirus? Past outbreaks provide clues. Science 2020. Mar. 10 Available: www.sciencemag.org/news/2020/03/does-closing-schools-slow-spread-novel-c... (accessed 2020 Apr. 7).
Publication types
MeSH terms
LinkOut - more resources
Full Text Sources
Miscellaneous